 Triplex
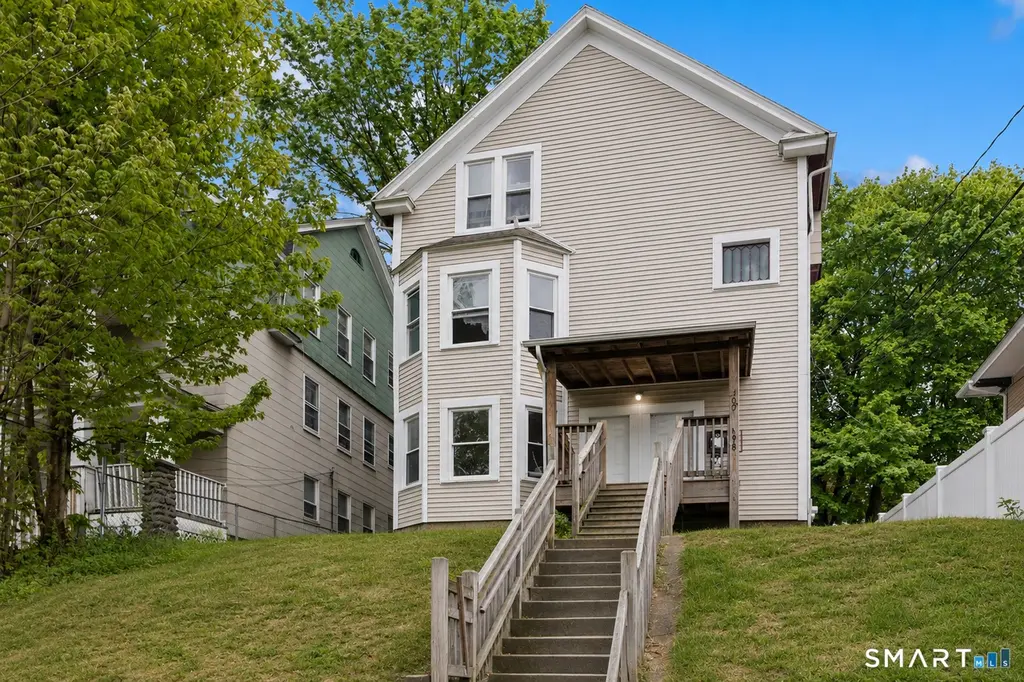
500 Wilson St · Waterbury, CT
Flood risk 1/10 · Minimal
- FEMA flood zone
- X (unshaded)
- Chance of flooding over 30 yrs
- 0.0%
- Est. flood insurance / yr
- $473 – $860
Fire risk 1/10 · Minimal
- Est. fire insurance / yr
- $829 – $1,539
Heat risk 5/10 · Moderate
- Hot days now (above 96°F)
- 7 days/yr
- Hot days in 30 yrs
- 15 days/yr
Wind risk 6/10 · Moderate
- Chance of severe wind over 30 yrs
- 27.0%
Air-quality risk 3/10 · Minor
- Unhealthy air days now
- 2 days/yr
- Unhealthy air days in 30 yrs
- 4 days/yr
Risk factors via First Street. Map © Google.
Why this score? — see what drove the D+ grade
The composite is a weighted blend of 9 inputs, each scored 0–100. Each bar is that input's sub-score; the figure is the points it added to the 100-point composite (weight × sub-score).
- Cash flow +20.1/30.0
- DSCR +6.4/10.0
- 1% rule +5.6/10.0
- Rent growth +4.9/5.0
- Livability +4.0/5.0
- Condition / age +2.5/5.0
- Schools +1.5/10.0
- ARV discount +0.0/15.0
- Appreciation +0.0/10.0
$425,000
🖨 Deal sheet (PDF) 📄 Offer letter ✓ Due diligence
Multi-family units
County records classify this as Multi-Family (2-4 Unit). Listing-text estimate: 3 units. confirmed
Listing remarks MLS
Check out this 3-family property right on the fringe of Town Plot! This property has been a good building to produce income, and is also a good value-add opportunity. The units are in kept condition, with some including a mixture of updated kitchens, baths, flooring, and or fresh paint throughout. Each unit is 2 beds and 1 bath and has front & back porches. The basement is clean and organized, and mechanics are running strong. This location is close to many amenities, minutes to the highway, and also close to Waterbury Hospital & Saint Mary's Hospital. Excellent opportunity to add to or start a portfolio. Inquire today!
Key facts
- 3 unit
- Cash flowing asset
- Move in ready
Tags
Property features AI
Exterior
- Utilities: Public water connected; Public sewer connected; Domestic hot water
- Home design: Multi-family property (3-family)
- Construction: Frame construction; Concrete foundation
- Exterior features: Level lot; Vinyl siding; Asphalt shingle roof
Interior
- Bedrooms: 6 bedrooms
- Bathrooms: 3 full bathrooms
- Heating & cooling: Hot air heat; Ceiling fans; Natural gas heat fuel
- Interior features: Ceiling fans; No basement; Total of 18 rooms
Neighborhood map
What this means for you Summary
Snapshot
- This is a 3 × 2-bed/?-bath units multifamily listed at $425k.
Deal economics
- At list price, monthly cash flow is $532 ($6k/yr) — positive. Per door: $177/mo.
- The deal already cash-flows at list — no discount required.
- Meets the 1% rule at list price ($5k rent vs $425k).
- Recommended offer: $419k (1.5% below list) — sets the bar for market timing.
- Cap rate 7.8% vs local median 3.6% in Waterbury — top-decile yield for the area; either an underpriced asset or a hidden risk that comps aren't pricing in. Stress-test before assuming the spread holds.
Location & tenants
- Location reads 79/100 on livability (#32 in CT, #2,205 nationally) — a middle-class / working-renter tenant base. Strengths: commute A+, cost of living A+, housing A+; Watch: schools D+, crime D, employment D.
- Waterbury School District (suburban): math 12% / reading 23% proficiency, ranked #148 of 153 in CT (top 97%) — low school quality limits family demand, transient renter base, plan for 1-2y turnover; 73% free/reduced lunch — lower-income household profile, screen leases tightly.
- Market conditions: Rents rising fast (+9.8%/yr); 121 active listings in the ZIP; 1 comparable units currently listed for rent nearby; 502 units permitted in Naugatuck Valley Planning Region in 2024 (171 in 5+ unit buildings).
- At $4,511/mo this rent would consume 80% of the median local household income ($67k/yr) (locally 1276% of renters already pay >50% of income on rent) — very limited rent-growth headroom before tenants either downsize or default.
Forward outlook
- Local home prices are declining (-3.0%/yr); year-one equity from $3k of loan paydown is wiped out by about $13k of value loss. Plan a longer hold.
- At projected returns (-3.0% appreciation + 8.0% rent growth), your $119k cash investment doubles in ~9 years — after that, you're playing with house money.
Negotiation context
- It's been on market 26 days — a 2% lower offer ($419k) is reasonable based on typical stale-listing flexibility.
- 8 sale attempts since 23y ago with the ask held roughly flat each time — persistent listings suggest the price (not the market) is what's stuck; bring a comps-based counter.
- Current owner paid $220k; list at $425k implies a 93% gain — meaningful room to come down on a strong offer.
Risks & watch-outs
- Watch-outs: built in 1914 — expect roof / HVAC / electrical / plumbing capex.
- Climate carrying-cost: major wind risk, 27% chance of damaging wind over 30y; extreme-heat days projected 7→15/yr by 2055 (HVAC capex compounding) — expect insurance premiums to compound above CPI over the hold.
Questions for the listing agent
- Can we see the unit-by-unit rent roll, current vacancy, and any below-market leases? What's the average tenancy length?
- What capital expenditures (roof, boiler, parking lot, exteriors) have been made in the last 5 years, and what's planned in the next 2?
- Built in 1914 — when were the roof, HVAC, electrical panel, plumbing, and water heater last replaced?
- Is there a deadline driving the sale (1031 exchange, divorce, estate, relocation)? That informs how much negotiation room exists.
- Schools are D-rated, which usually means shorter tenancies and higher turnover. Who's the typical renter profile here, and what's been the actual vacancy rate?
- Crime grade is D in this area — have there been break-ins, vandalism, or insurance claims at this property in the last 3 years? What carrier currently insures it and at what premium?
- The area grade is low — what's the realistic commute time and amenity access for the typical tenant pool here? Any planned neighborhood developments (good or bad) we should know about?
- What's the average days-on-market for RENTAL listings here right now (not sales)? A rising rental-DOM trend means longer vacancies and softer asking-rent achievability than the comps imply.
- What's the recent tenant-quality profile in this submarket — average credit score on applications, eviction rate, late-payment / NSF rate, and stable-employment percentage? A property-management company in the area should have these aggregated.
- How much new apartment / multifamily construction is in the pipeline within 1–3 miles? Heavy new supply (>2% of stock underway) typically softens rents 12–24 months out; light construction supports rent growth.
Investment metrics
- 1% rule
- 1.06% ✓
- Cap rate
- 7.79%
- Cash-on-cash
- 5.36%
- DSCR
- 1.24
- GRM
- 7.9
CMA / ARV
- ARV (on-the-fly)
- $364,280
- Comps found
- 12
Show comp detail 12 sales within ~0.75 mi
| Address | Dist | Beds/Ba | Sqft | Sold | Price | $/sf | Match |
|---|---|---|---|---|---|---|---|
| 70 Vail St | 0.14mi | 7/3.0 (+1) | 2,633 (+1%) | 5mo | $450,000 | $171 | 83 |
| 324 Congress Ave | 0.23mi | 6/3.0 | 2,760 (+6%) | 8mo | $326,400 | $118 | 73 |
| 465 Washington Ave | 0.12mi | 7/3.5 (+1) | 2,822 (+8%) | 2mo | $475,000 | $168 | 72 |
| 82 Chambers St | 0.26mi | 7/3.0 (+1) | 2,465 (-5%) | 13mo | $390,000 | $158 | 64 |
| 18 Rutland St | 0.35mi | 6/3.0 | 2,700 (+4%) | 18mo | $350,000 | $130 | 62 |
| 80 Fox St | 0.17mi | 7/2.5 (+1) | 2,700 (+4%) | 20mo | $376,000 | $139 | 62 |
| 37 N Leonard St | 0.30mi | 6/4.0 | 2,876 (+10%) | 7mo | $370,000 | $129 | 59 |
| 32 3rd St | 0.35mi | 5/4.0 (-1) | 2,723 (+5%) | 16mo | $260,000 | $95 | 54 |
| 316 Wilson St | 0.34mi | 5/3.0 (-1) | 2,240 (-14%) | 4mo | $426,000 | $190 | 53 |
| 389 Highland Ave | 0.34mi | 5/1.5 (-1) | 2,488 (-4%) | 18mo | $310,000 | $125 | 50 |
| 520 Highland Ave | 0.22mi | 5/3.0 (-1) | 2,973 (+14%) | 15mo | $415,000 | $140 | 48 |
| 40 Geddes Ter | 0.55mi | 6/2.0 | 2,782 (+7%) | 19mo | $420,000 | $151 | 43 |
Match score weights: distance 35% · size 25% · config 20% · recency 20%. Top-matched comps best support the ARV.
Projected returns pro-forma
-3.0% appreciation · 8.0% rent growth · sell at horizon
- IRR
- -2.3%
- Equity multiple
- 0.91×
- Total profit
- $-11,044
- Equity at exit
- $63,369
- IRR
- 12.3%
- Equity multiple
- 2.20×
- Total profit
- $142,999
- Equity at exit
- $36,746
Cash invested: $119,000 (down + closing). Projections, not guarantees.
Landlord ↔ Tenant lean methodology
- Overall (STATE)
- 27 Tenant-Leaning
- State Connecticut
- 27 Tenant-Leaning · D+7
- County
- — inherits STATE
- City
- — inherits STATE
ZIP-level market 06708
- Rents YoY
- 9.8%
- Active inventory
- 121
- Price-to-rent
- 23.6×
Monthly cashflow live
- Estimated rent
- $4,511 high interval (Pro) →
- Mortgage (P&I)
- −$2,229
- Tax from tax record
- −$626 /mo · $7,515/yr
- Insurance
- −$177
- HOA
- −$0
- Vacancy / Maint / Mgmt
- −$947
- Net cashflow
- $532
Break-even live
Sensitivity live
| Price | -10% $772 | -5% $652 | +0% $532 | +5% $411 | +10% $291 |
|---|---|---|---|---|---|
| Rent | -10% $175 | -5% $353 | +0% $532 | +5% $710 | +10% $888 |
| Rate | -1.0pp $746 | -0.5pp $640 | base $532 | +0.5pp $421 | +1.0pp $309 |
3-unit breakdown (identical units grouped — click to expand)
| Units | Beds | Baths | Est. rent |
|---|---|---|---|
| 3× units | 2 | — | $4,512 |
| #1 | 2 | — | $1,504 |
| #2 | 2 | — | $1,504 |
| #3 | 2 | — | $1,504 |
| Total (3 units) | $4,511 | ||
UW: 25.0% down · 7.5% · 30yr · 1.5% tax · 5.0% vac · 8.0% maint · 8.0% mgmt
Financing live
Cash to close
- Down payment
- $106,250
- Closing costs
- $12,750
- Reserves months
- —
- Total cash needed
- —
Loan-product check · same deal, 3 products live
Conventional
25% down · 7.5% · 30yr
- Down + closing
- —
- Monthly P&I
- —
- Monthly cashflow
- —
- DSCR
- —
- Eligible?
- —
Personal DTI + credit; lowest rate.
DSCR
20% down · 8.5% · 30yr
- Down + closing
- —
- Monthly P&I
- —
- Monthly cashflow
- —
- DSCR
- —
- Eligible?
- —
No personal income docs; deal must DSCR.
Hard money
10% down · 12.0% · 12mo
- Down + closing
- —
- Monthly P&I
- —
- Monthly cashflow
- —
- DSCR
- —
- Eligible?
- —
Short-term bridge; refi at stabilization.
Rent comps 1 comps
| Address | Beds | Baths | Sqft | Rent | $/sqft | DOM | Units | Dist |
|---|---|---|---|---|---|---|---|---|
| 37 Johnson St Waterbury, CT | 6.0 | 1.5 | 2002 | $3,200 | $1.60 | 3d | 1 | 1.10mi |
Listing history 34 events
-
2026-06-15status $425,000 Under Contract 26 DOM
-
2026-06-15days on market $425,000 Active 26 DOM
-
2026-06-14days on market $425,000 Active 24 DOM
-
2026-06-13days on market $425,000 Active 23 DOM
-
2026-06-10days on market $425,000 Active 21 DOM
-
2026-06-09days on market $425,000 Active 20 DOM
-
2026-06-08days on market $425,000 Active 19 DOM
-
2026-06-07days on market $425,000 Active 18 DOM
-
2026-06-05days on market $425,000 Active 15 DOM
-
2026-06-03days on market $425,000 Active 14 DOM
-
2026-06-03days on market $425,000 Active 13 DOM
-
2026-06-01days on market $425,000 Active 12 DOM
-
2026-05-31days on market $425,000 Active 11 DOM
-
2026-05-20$425,000 Active
-
2022-12-22soldstatus $220,000 Closed 635-char remark
Show marketing remark (635 chars)
Check out this 3-family property right on the fringe of Town Plot! This property has been a good building to produce income, and is also a good value-add opportunity. The units are in kept condition, with some including a mixture of updated kitchens, baths, flooring, and or fresh paint throughout. Each unit is 2 beds and 1 bath and has front & back porches. The basement is clean and organized, and mechanics are running strong. This location is close to many amenities, minutes to the highway, and also close to Waterbury Hospital & Saint Mary's Hospital. Excellent opportunity to add to or start a portfolio. Inquire today!
-
2022-12-16status Under Contract 635-char remark
Show marketing remark (635 chars)
Check out this 3-family property right on the fringe of Town Plot! This property has been a good building to produce income, and is also a good value-add opportunity. The units are in kept condition, with some including a mixture of updated kitchens, baths, flooring, and or fresh paint throughout. Each unit is 2 beds and 1 bath and has front & back porches. The basement is clean and organized, and mechanics are running strong. This location is close to many amenities, minutes to the highway, and also close to Waterbury Hospital & Saint Mary's Hospital. Excellent opportunity to add to or start a portfolio. Inquire today!
-
2022-12-12$242,000 Active 635-char remark
Show marketing remark (635 chars)
Check out this 3-family property right on the fringe of Town Plot! This property has been a good building to produce income, and is also a good value-add opportunity. The units are in kept condition, with some including a mixture of updated kitchens, baths, flooring, and or fresh paint throughout. Each unit is 2 beds and 1 bath and has front & back porches. The basement is clean and organized, and mechanics are running strong. This location is close to many amenities, minutes to the highway, and also close to Waterbury Hospital & Saint Mary's Hospital. Excellent opportunity to add to or start a portfolio. Inquire today!
-
2017-10-20soldstatus $111,000 107-char remark
Show marketing remark (107 chars)
TOWN PLOT!!! 3 FAMILY with spacious 2 bedroom units, great views and access to major highways and shopping.
-
2017-10-17historical 107-char remark
Show marketing remark (107 chars)
TOWN PLOT!!! 3 FAMILY with spacious 2 bedroom units, great views and access to major highways and shopping.
-
2017-03-29$119,900 107-char remark
Show marketing remark (107 chars)
TOWN PLOT!!! 3 FAMILY with spacious 2 bedroom units, great views and access to major highways and shopping.
-
2015-01-05soldstatus $95,750
-
2014-12-04historical
-
2014-11-14$109,900
-
2014-10-08soldstatus $66,000
-
2014-08-05$64,900
-
2008-02-11soldstatus $220,000
-
2007-09-21soldstatus $77,500
-
2007-06-26$75,900
-
2004-05-03soldstatus $144,900
-
2004-04-29soldstatus $139,900
-
2004-01-21$139,900
-
2003-08-04soldstatus $130,000
-
2003-06-30soldstatus $130,000
-
2003-03-27$134,900
ⓘ Source: listings_history table (triggers on properties + properties_extension) + one-shot
backfill from property_details.listing_events for pre-trigger history.
Tax reassessment forecast CT · Partial reset (capped growth)
- Current annual tax
- $7,515 · $626/mo
- Projected year-2 tax
- $8,305 · $692/mo
- Expected delta
- +$790/yr (+$66/mo · 10.5%)
ⓘ Screening estimate from a state-policy table — verify with the county assessor before closing.
Climate risk First Street
- Flood 1/10 Low FEMA zone X (unshaded) · 0% chance over 30 yrs
- Wildfire 1/10 Low
- Heat 5/10 Major 7 d/yr ≥96°F today · 15 d/yr by 30 yrs out
- Wind 6/10 Major 27% chance of damaging wind over 30 yrs
- Air quality 3/10 Moderate 2 unhealthy d/yr today · 4 by 30 yrs out
Nearby sold comps map
Loading sold comps map…
Walkable amenities ~0.75 mi
Loading nearby amenities…
Taxation est. · year 1
- Rental income
- $54,132
- − Mortgage interest
- −$23,807
- − Property taxes
- −$7,515
- − Insurance
- −$2,125
- − Repairs & maintenance
- −$4,331
- − Management
- −$4,331
- − Depreciation
- −$12,364
- Taxable loss
- −$339
- Est. tax savings @ 24.0%
- +$81
- After-tax cash flow
- $6,461/yr
For passive investors: Depreciation is non-cash, so a rental often shows a tax loss while cash-flowing — sheltering income. Rental losses are passive: they offset passive income freely, and up to $25,000/yr can offset ordinary (W-2) income if you actively participate and your MAGI is under $100k (phasing out to $0 by $150k); unused losses carry forward. On sale, claimed depreciation is recaptured at up to 25%, and gains may owe capital-gains tax (a 1031 exchange can defer both). Figures are a year-1 estimate at your 24.0% rate — not tax advice; consult a CPA.
Schools (NCES district)
- District
- Waterbury School District
- NCES district ID
- 0904830
- Math proficiency
- 12% ▼ -7.00%
- Reading proficiency
- 23% ▼ -8.00%
- Median HH income
- $40,040
- Composite
- 14.85/100
- National rank
- #9380
- State rank
- #148 of 153 in CT
Livability — Waterbury
- Score
- 79/100
- State rank
- #32
- US rank
- #2205
Category grades
Schools grade is shown separately in the Schools card above.
Census & demographics
- Census place
- Waterbury, CT
- County
- New Haven County · 688,236 people
- City population
- 115,012
- Metro
- New Haven-Milford, CT
- Population (ZIP)
- 29,594
- Household income
- $67,364
- Rent vs Own
- Severe rent burden
- 1276.0
Population outlook (Naugatuck Valley County) Hauer SSP2
- By 2040
- 496,846
Race, ethnicity, and origin ACS 2023
- Neighborhood character
- Diverse neighborhood (Simpson 0.68)
- Race & ethnicity
- White 43% Hispanic / Latino 33% Black 17% Two or more races 13% Asian 2%
- Hispanic origin (detail)
- Puerto Rican 17% Dominican 8%
- Common ancestry
- Romanian 2% Russian 2% Estonian 2%
- Foreign-born
- 20% · Canada, Jamaica, China
- Languages at home
- 64% English-only · Spanish 23% Other Indo-European 8% French/Haitian/Cajun 1%
Political lean MEDSL · Naugatuck Valley
- 2024 margin
- Lean R (+7.4) · D 45.6% · R 53.0% · Other 1.4%
- All cycles
- 2024: R+7.4
Not yet ingested
- Civics
- —
Market trends
- HPI YoY
- ▼ -297.81%
- Current HPI
- 281.1446
- Rent YoY
- ▲ 9.75%
- Metro
- New Haven-Milford, CT
- State GDP YoY
- ▲ 1.06%
- F500 in state
- 38
Industry mix (Fortune 500 HQ in CT)
| Industry | F500 HQs | Revenue |
|---|---|---|
| Industrial Machinery | 4 | $38B |
|
||
| Insurance | 3 | $71B |
|
||
| Financial Services | 2 | $25B |
|
||
| Transportation / Logistics | 2 | $18B |
|
||
| Healthcare | 1 | $247B |
|
||
| Telecommunications | 1 | $55B |
|
||
Price history
+215.0% since first listed21 events — show timeline
- 2026-05-20 Listed $425,000 Smart MLS
- 2022-12-22 Sold (MLS) $220,000 Smart MLS
- 2022-12-16 Pending — Smart MLS
- 2022-12-12 Listed $242,000 Smart MLS
- 2017-10-20 Sold (MLS) $111,000 Smart MLS
- 2017-10-17 Listing Removed — Smart MLS
- 2017-03-29 Listed $119,900 Smart MLS
- 2015-01-05 Sold (MLS) $95,750 Smart MLS
- 2014-12-04 Listing Removed — Smart MLS
- 2014-11-14 Listed $109,900 Smart MLS
- 2014-10-08 Sold (MLS) $66,000 Smart MLS
- 2014-08-05 Listed $64,900 Smart MLS
- 2008-02-11 Sold (Public Records) $220,000 Public Records
- 2007-09-21 Sold (MLS) $77,500 Smart MLS
- 2007-06-26 Listed $75,900 Smart MLS
- 2004-05-03 Sold (Public Records) $144,900 Public Records
- 2004-04-29 Sold (MLS) $139,900 Smart MLS
- 2004-01-21 Listed $139,900 Smart MLS
- 2003-08-04 Sold (Public Records) $130,000 Public Records
- 2003-06-30 Sold (MLS) $130,000 Smart MLS
- 2003-03-27 Listed $134,900 Smart MLS
Property tax history
+5.2%/yrLatest (2023): $7,515 · +69.0% YoY. Source: county tax records.
Cash-flow waterfall
monthlySold comps — $/sqft
last 12 mo · ≤1 miLoading sold comps…