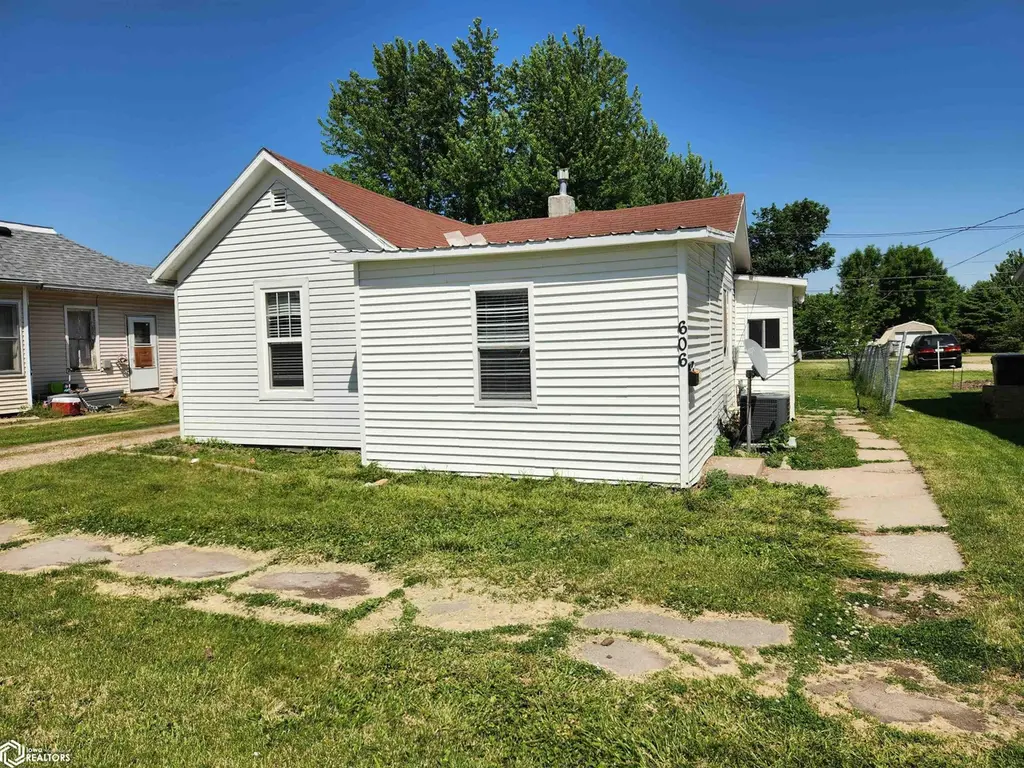
606 Siegel St · Tama, IA
Flood risk 1/10 · Minimal
- FEMA flood zone
- X (unshaded)
- Chance of flooding over 30 yrs
- 0.0%
- Est. flood insurance / yr
- $473 – $860
Fire risk 7/10 · Major
- Est. fire insurance / yr
- $902 – $1,676
Heat risk 3/10 · Minor
- Hot days now (above 103°F)
- 7 days/yr
- Hot days in 30 yrs
- 15 days/yr
Wind risk 2/10 · Minimal
- Chance of severe wind over 30 yrs
- —
Air-quality risk 1/10 · Minimal
- Unhealthy air days now
- 0 days/yr
- Unhealthy air days in 30 yrs
- 0 days/yr
Risk factors via First Street. Map © Google.
Why this score? — see what drove the C+ grade
The composite is a weighted blend of 9 inputs, each scored 0–100. Each bar is that input's sub-score; the figure is the points it added to the 100-point composite (weight × sub-score).
- Cash flow +18.0/30.0
- ARV discount +11.5/15.0
- Appreciation +8.4/10.0
- DSCR +5.6/10.0
- 1% rule +4.3/10.0
- Schools +4.0/10.0
- Livability +3.6/5.0
- Rent growth +2.5/5.0
- Condition / age +2.5/5.0
$75,000
🖨 Deal sheet 📄 Offer letter ✓ Due diligence
Listing remarks
Income-producing property or perfect starter home! This cozy 920-square-foot house features 3 bedrooms and 1 bathroom, along with a smaller living room and a functional kitchen. Call today to schedule a viewing.
Key facts
- 8,276 sq ft lot
- Garage
- Built 1910
Property features AI
Exterior
- Parking: Detached 1-car garage
- Utilities: Public water; Public sewer
- Home design: Single family residence; Residential property
- Construction: Vinyl siding
- Exterior features: 50' x 163' lot (0.19 acres)
Interior
- Bathrooms: 1 full bathroom
- Heating & cooling: Forced air heating; Central air conditioning
- Interior features: Basement present
Neighborhood map
What this means for you Summary
Snapshot
- This is a 2-bed/1.0-bath single-family listed at $75k.
Deal economics
- At list price, monthly cash flow is $64 ($773/yr) — positive.
- The deal already cash-flows at list — no discount required.
- To meet the 1% rule (rent ≥ 1% of price), the offer needs to be $70k (6.7% below list).
- Recommended offer: $70k (6.7% below list) — sets the bar for 1% rule.
Location & tenants
- Location reads 72/100 on livability (#298 in IA) — a middle-class / working-renter tenant base. Strengths: crime A+, cost of living A+, housing A+; Watch: schools D, employment D, amenities F.
- South Tama County (town): math 44% / reading 50% proficiency, ranked #287 of 289 in IA (top 99%) — families likely to look elsewhere, expect single-tenant / working-renter base with shorter leases.
- Market conditions: 21 active listings in the ZIP; 1 comparable units currently listed for rent nearby; 17 units permitted in Tama County in 2024 (0 in 5+ unit buildings).
Forward outlook
- In year one you build about $6k of equity ($519 loan paydown + $5k appreciation (6.8% local appreciation)).
- Tama County population projected at -15% by 2050 — secular population decline; favor cash flow + early exit over multi-decade hold.
- At projected returns (6.8% appreciation + 3.0% rent growth), your $21k cash investment doubles in ~4 years — after that, you're playing with house money.
- By year 6, paydown + projected appreciation supports a ~$31k cash-out refi (75% LTV) — recoverable capital for the next deal without selling this one.
Negotiation context
- It's been on market 28 days — a 2% lower offer ($74k) is reasonable based on typical stale-listing flexibility.
- Current owner paid $14k; list at $75k implies a 417% gain — meaningful room to come down on a strong offer.
Risks & watch-outs
- Watch-outs: built in 1910 — expect roof / HVAC / electrical / plumbing capex.
- Climate carrying-cost: major wildfire risk — expect insurance premiums to compound above CPI over the hold.
Questions for the listing agent
- Built in 1910 — when were the roof, HVAC, electrical panel, plumbing, and water heater last replaced?
- Is there a deadline driving the sale (1031 exchange, divorce, estate, relocation)? That informs how much negotiation room exists.
- Schools are D-rated, which usually means shorter tenancies and higher turnover. Who's the typical renter profile here, and what's been the actual vacancy rate?
- What's the average days-on-market for RENTAL listings here right now (not sales)? A rising rental-DOM trend means longer vacancies and softer asking-rent achievability than the comps imply.
- What's the recent tenant-quality profile in this submarket — average credit score on applications, eviction rate, late-payment / NSF rate, and stable-employment percentage? A property-management company in the area should have these aggregated.
- How much new for-sale + rental construction is in the pipeline within 1–3 miles? Heavy new supply typically softens prices + rents 12–24 months out; constrained supply supports both.
Investment metrics
- 1% rule
- 0.93% ✗
- Cap rate
- 7.32%
- Cash-on-cash
- 3.68%
- DSCR
- 1.16
- GRM
- 8.9
CMA / ARV
- ARV (on-the-fly)
- $82,236
- Comps found
- 5
Show comp detail 5 sales within ~0.75 mi
| Address | Dist | Beds/Ba | Sqft | Sold | Price | $/sf | Match |
|---|---|---|---|---|---|---|---|
| 707 Harding St | 0.15mi | 3/2.0 (+1) | 930 (+1%) | 2mo | $72,000 | $77 | 81 |
| 801 State St | 0.16mi | 2/1.0 | 840 (-9%) | 8mo | $75,000 | $89 | 71 |
| 400 E 12th St | 0.46mi | 2/1.0 | 912 (-1%) | 8mo | $128,000 | $140 | 69 |
| 504 Harding St | 0.13mi | 2/1.0 | 808 (-13%) | 22mo | $128,600 | $159 | 54 |
| 610 E 5th St | 0.50mi | 3/1.0 (+1) | 986 (+7%) | 13mo | $55,000 | $56 | 50 |
Match score weights: distance 35% · size 25% · config 20% · recency 20%. Top-matched comps best support the ARV.
Projected returns pro-forma
6.83% appreciation · 3.0% rent growth · sell at horizon
- IRR
- 20.2%
- Equity multiple
- 2.40×
- Total profit
- $29,477
- Equity at exit
- $51,112
- IRR
- 19.1%
- Equity multiple
- 4.94×
- Total profit
- $82,682
- Equity at exit
- $96,319
Cash invested: $21,000 (down + closing). Projections, not guarantees.
Landlord ↔ Tenant lean methodology
- Overall (STATE)
- 83 Strongly Landlord-Friendly
- State Iowa
- 83 Strongly Landlord-Friendly · R+6
- County
- — inherits STATE
- City
- — inherits STATE
ZIP-level market 52339
- Home prices YoY
- 3.9%
- Active inventory
- 21
- Price-to-rent
- 8.9×
Monthly cashflow live
- Estimated rent
- $700 medium interval (Pro) →
- Mortgage (P&I)
- −$393
- Tax from tax record
- −$64 /mo · $768/yr
- Insurance
- −$31
- HOA
- −$0
- Vacancy / Maint / Mgmt
- −$147
- Net cashflow
- $64
Break-even live
UW: 25.0% down · 7.5% · 30yr · 1.5% tax · 5.0% vac · 8.0% maint · 8.0% mgmt
Financing live
Cash to close
- Down payment
- $18,750
- Closing costs
- $2,250
- Reserves months
- —
- Total cash needed
- —
Loan-product check · same deal, 3 products live
Conventional
25% down · 7.5% · 30yr
- Down + closing
- —
- Monthly P&I
- —
- Monthly cashflow
- —
- DSCR
- —
- Eligible?
- —
Personal DTI + credit; lowest rate.
DSCR
20% down · 8.5% · 30yr
- Down + closing
- —
- Monthly P&I
- —
- Monthly cashflow
- —
- DSCR
- —
- Eligible?
- —
No personal income docs; deal must DSCR.
Hard money
10% down · 12.0% · 12mo
- Down + closing
- —
- Monthly P&I
- —
- Monthly cashflow
- —
- DSCR
- —
- Eligible?
- —
Short-term bridge; refi at stabilization.
Rent comps 1 comps
| Address | Beds | Baths | Sqft | Rent | $/sqft | DOM | Units | Dist |
|---|---|---|---|---|---|---|---|---|
| 1710 Harding St Tama, IA | 1.0–2.0 | 1.0 | 603 | $700 | $1.16 | 43d | 6 | 0.85mi |
Listing history 18 events
-
2026-06-19days on market $75,000 Active 28 DOM
-
2026-06-18days on market $75,000 Active 27 DOM
-
2026-06-17days on market $75,000 Active 26 DOM
-
2026-06-16days on market $75,000 Active 25 DOM
-
2026-06-15days on market $75,000 Active 24 DOM
-
2026-06-14days on market $75,000 Active 22 DOM
-
2026-06-12days on market $75,000 Active 21 DOM
-
2026-06-09days on market $75,000 Active 18 DOM
-
2026-06-08days on market $75,000 Active 17 DOM
-
2026-06-07days on market $75,000 Active 16 DOM
-
2026-06-05days on market $75,000 Active 13 DOM
-
2026-06-03days on market $75,000 Active 12 DOM
-
2026-06-02days on market $75,000 Active 11 DOM
-
2026-06-01days on market $75,000 Active 10 DOM
-
2026-05-31days on market $75,000 Active 9 DOM
-
2026-05-30days on market $75,000 Active 8 DOM
-
2026-05-22$75,000 Active
-
2018-10-11soldstatus $14,500
ⓘ Source: listings_history table (triggers on properties + properties_extension) + one-shot
backfill from property_details.listing_events for pre-trigger history.
Tax reassessment forecast IA · Partial reset (capped growth)
- Current annual tax
- $768 · $64/mo
- Projected year-2 tax
- $973 · $81/mo
- Expected delta
- +$205/yr (+$17/mo · 26.7%)
ⓘ Screening estimate from a state-policy table — verify with the county assessor before closing.
Climate risk First Street
- Flood 1/10 Low FEMA zone X (unshaded) · 0% chance over 30 yrs
- Wildfire 7/10 Severe
- Heat 3/10 Moderate 7 d/yr ≥103°F today · 15 d/yr by 30 yrs out
- Wind 2/10 Low
- Air quality 1/10 Low 0 unhealthy d/yr today · 0 by 30 yrs out
Nearby sold comps map
Loading sold comps map…
Walkable amenities ~0.75 mi
Loading nearby amenities…
Taxation est. · year 1
- Rental income
- $8,400
- − Mortgage interest
- −$4,201
- − Property taxes
- −$768
- − Insurance
- −$375
- − Repairs & maintenance
- −$672
- − Management
- −$672
- − Depreciation
- −$2,182
- Taxable loss
- −$470
- Est. tax savings @ 24.0%
- +$113
- After-tax cash flow
- $886/yr
For passive investors: Depreciation is non-cash, so a rental often shows a tax loss while cash-flowing — sheltering income. Rental losses are passive: they offset passive income freely, and up to $25,000/yr can offset ordinary (W-2) income if you actively participate and your MAGI is under $100k (phasing out to $0 by $150k); unused losses carry forward. On sale, claimed depreciation is recaptured at up to 25%, and gains may owe capital-gains tax (a 1031 exchange can defer both). Figures are a year-1 estimate at your 24.0% rate — not tax advice; consult a CPA.
Schools (NCES district)
- District
- South Tama County
- NCES district ID
- 1926730
- Math proficiency
- 44% ▼ -14.00%
- Reading proficiency
- 50% ▼ -7.00%
- Median HH income
- $46,147
- Composite
- 39.91/100
- National rank
- #3853
- State rank
- #287 of 289 in IA
Livability — Tama
- Score
- 72/100
- State rank
- #298
- US rank
- #5799
Category grades
Schools grade is shown separately in the Schools card above.
Census & demographics
- Census place
- Tama, IA
- Population (ZIP)
- 4,311
Population outlook (Tama County) Hauer SSP2
- Today (2025)
- 16,690 people
- By 2030
- 16,217 · -2.8%
- By 2040
- 15,207 · -8.9%
- By 2050
- 14,186 · -15.0%
- By 2075
- 12,228 · -26.7%
- By 2100
- 10,386 · -37.8%
Race, ethnicity, and origin ACS 2023
- Neighborhood character
- Diverse neighborhood (Simpson 0.66)
- Race & ethnicity
- White 52% Hispanic / Latino 27% Native American 18% Two or more races 16% Black 2%
- Hispanic origin (detail)
- Mexican 22%
- Common ancestry
- Portuguese 1% Lithuanian 1% Iranian 1%
- Foreign-born
- 12% · Canada, United Kingdom
- Languages at home
- 68% English-only · Spanish 19% French/Haitian/Cajun 1%
Political lean MEDSL · Tama
- 2024 margin
- Strong R (+26.9) · D 35.7% · R 62.6% · Other 1.7%
- 2008→2024 swing
- -39.1pp toward R · 2008: 12.2pp · 2024: -26.9pp
- All cycles
- 2024: R+26.9 2020: R+19.1 2016: R+20.6 2012: D+7.4 2008: D+12.2
Not yet ingested
- Civics
- —
Market trends
- HPI YoY
- ▲ 6.83%
- Current HPI
- 179.9862
- Rent YoY
- —
- Metro
- —
- State GDP YoY
- ▲ 2.48%
- F500 in state
- 4
Industry mix (Fortune 500 HQ in IA)
| Industry | F500 HQs | Revenue |
|---|---|---|
| Financial Services | 1 | $16B |
|
||
| Retail / Convenience | 1 | $15B |
|
||
Price history
+417.2% since first listed2 events — show timeline
- 2026-05-22 Listed $75,000 IAR
- 2018-10-11 Sold (Public Records) $14,500 Public Records
Property tax history
+5.1%/yrLatest (2025): $768 · +7.9% YoY. Source: county tax records.
Cash-flow waterfall
monthlySold comps — $/sqft
last 12 mo · ≤1 miLoading sold comps…