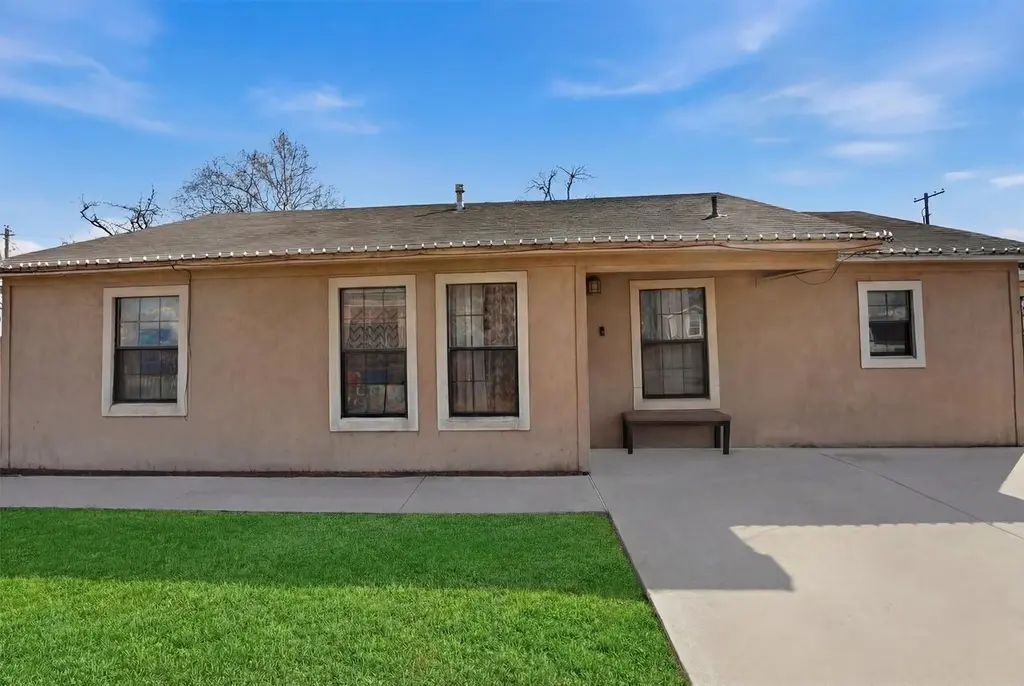
1002 Grenfell Ln · Houston, TX
Flood risk 4/10 · Minor
- FEMA flood zone
- X (unshaded)
- Chance of flooding over 30 yrs
- 0.21%
- Est. flood insurance / yr
- $507 – $1,088
Fire risk 1/10 · Minimal
- Est. fire insurance / yr
- $1,222 – $2,270
Heat risk 9/10 · Severe
- Hot days now (above 109°F)
- 7 days/yr
- Hot days in 30 yrs
- 24 days/yr
Wind risk 9/10 · Severe
- Chance of severe wind over 30 yrs
- 99.0%
Air-quality risk 3/10 · Minor
- Unhealthy air days now
- 3 days/yr
- Unhealthy air days in 30 yrs
- 4 days/yr
Risk factors via First Street. Map © Google.
Why this score? — see what drove the D grade
The composite is a weighted blend of 9 inputs, each scored 0–100. Each bar is that input's sub-score; the figure is the points it added to the 100-point composite (weight × sub-score).
- Cash flow +12.0/30.0
- ARV discount +10.5/15.0
- 1% rule +3.9/10.0
- Livability +3.7/5.0
- DSCR +3.5/10.0
- Schools +2.7/10.0
- Rent growth +2.5/5.0
- Condition / age +2.5/5.0
- Appreciation +0.0/10.0
$200,000
🖨 Deal sheet (PDF) 📄 Offer letter ✓ Due diligence
Listing remarks
Don't miss out on this incredible opportunity in a prime location! This charming home features a remodeled kitchen with a breakfast area, an additional bedroom and bathroom for a total of 4 bedrooms and 2 baths. With a little TLC, this spacious house has endless potential to become your dream home. Plumbing repairs have already been taken care of. Contact us today to schedule a tour and see for yourself the possibilities this property has to offer!
Key facts
- Updates in kitchen
- Tile flooring
- Walk-in showers
Tags
Property features AI
Finance
- Other: Seller disclosure available
Exterior
- Utilities: Public water; Public sewer
- Home design: Residential property; One-story (1950 construction)
- Construction: Built in 1950; Unknown construction materials; Composition roof; Slab foundation
- Exterior features: Subdivision lot
Interior
- Kitchen: Gas oven; Gas range
- Bedrooms: Up to 4 possible bedrooms; 7 total rooms
- Bathrooms: 2 full bathrooms
- Heating & cooling: Central heating (gas); Central electric air conditioning
- Interior features: Ceiling fans
Neighborhood map
What this means for you Summary
Snapshot
- This is a 3-bed/1.0-bath single-family listed at $200k.
Deal economics
- At list price, monthly cash flow is $-48 ($-579/yr) — negative.
- To cash-flow at today's rent, offer at most $191k (4.3% below list).
- To meet the 1% rule (rent ≥ 1% of price), the offer needs to be $178k (10.8% below list).
- Recommended offer: $178k (10.8% below list) — sets the bar for 1% rule.
- Cap rate 6.0% vs local median 3.2% in Houston — top-decile yield for the area; either an underpriced asset or a hidden risk that comps aren't pricing in. Stress-test before assuming the spread holds.
Location & tenants
- Location reads 74/100 on livability (#184 in TX, #4,771 nationally) — a middle-class / working-renter tenant base. Strengths: amenities A+, cost of living A+, housing A+; Watch: crime F.
- Houston ISD (urban): math 27% / reading 35% proficiency, ranked #593 of 826 in TX (top 72%) — families likely to look elsewhere, expect single-tenant / working-renter base with shorter leases; 71% free/reduced lunch — lower-income household profile, screen leases tightly.
- Zoned schools: Barrick El (math 16% / reading 24%, grade F, #3,536 of 4,322 statewide, top 83%, 486 students, 99% FRL); Henry Middle (math 8% / reading 12%, grade F, #1,641 of 1,662 statewide, top 99%, 690 students, 98% FRL); Houston Math Science And Technology Center (math 9% / reading 21%, grade F, #1,507 of 1,632 statewide, top 93%, 2,779 students, 95% FRL) — zoned schools average 97% FRL vs 71% district-wide (26 pts higher); higher-poverty schools than district average — tighter screening recommended.
- Zoned-school proficiency averages 15% at this address vs 31% district-wide (-16 pts) — the specific schools serving this property underperform the Houston ISD average; the district grade overstates school quality for this exact location.
- Market conditions: 84 active listings in the ZIP; 20 comparable units currently listed for rent nearby; rentals at typical pace (median 23d on market — plan ~3-4 weeks tenant-placement turnaround); lower-income renter base — watch delinquency; 29,883 units permitted in Harris County in 2024 (8,621 in 5+ unit buildings).
Forward outlook
- Local home prices are declining (-3.0%/yr); year-one equity from $1k of loan paydown is wiped out by about $6k of value loss. Plan a longer hold.
- Harris County population projected at +47% by 2050 — long-run rental-demand tailwind backs the buy-and-hold thesis.
Negotiation context
- Only 11 days on market — expect competitive offers; lowballing is unlikely to land.
- 4 sale attempts with the ask held roughly flat each time — persistent listings suggest the price (not the market) is what's stuck; bring a comps-based counter.
- Current owner paid $24k; list at $200k implies a 733% gain — meaningful room to come down on a strong offer.
Risks & watch-outs
- Watch-outs: built in 1950 — expect roof / HVAC / electrical / plumbing capex.
- Climate carrying-cost: severe wind risk, 99% chance of damaging wind over 30y; extreme-heat days projected 7→24/yr by 2055 (HVAC capex compounding) — expect insurance premiums to compound above CPI over the hold.
Questions for the listing agent
- What do current leases actually rent for vs. the listed asking? Can we see a recent rent roll and the last 12 months of T-12 income?
- Built in 1950 — when were the roof, HVAC, electrical panel, plumbing, and water heater last replaced?
- Is there a deadline driving the sale (1031 exchange, divorce, estate, relocation)? That informs how much negotiation room exists.
- Schools are D-rated, which usually means shorter tenancies and higher turnover. Who's the typical renter profile here, and what's been the actual vacancy rate?
- Crime grade is F in this area — have there been break-ins, vandalism, or insurance claims at this property in the last 3 years? What carrier currently insures it and at what premium?
- The area grade is low — what's the realistic commute time and amenity access for the typical tenant pool here? Any planned neighborhood developments (good or bad) we should know about?
- What's the average days-on-market for RENTAL listings here right now (not sales)? A rising rental-DOM trend means longer vacancies and softer asking-rent achievability than the comps imply.
- What's the recent tenant-quality profile in this submarket — average credit score on applications, eviction rate, late-payment / NSF rate, and stable-employment percentage? A property-management company in the area should have these aggregated.
- How much new for-sale + rental construction is in the pipeline within 1–3 miles? Heavy new supply typically softens prices + rents 12–24 months out; constrained supply supports both.
Investment metrics
- 1% rule
- 0.89% ✗
- Cap rate
- 6.00%
- Cash-on-cash
- -1.03%
- DSCR
- 0.95
- GRM
- 9.3
CMA / ARV
- ARV (median comp)
- $214,458
- List price
- $200,000
- Delta
- -4.41%
- Verdict
- FAIR
- Comps
- 20 within 1.0 mi
Show comp detail 12 sales within ~0.75 mi
| Address | Dist | Beds/Ba | Sqft | Sold | Price | $/sf | Match |
|---|---|---|---|---|---|---|---|
| 264 Parker Rd | 0.64mi | 3/1.0 | 1,448 (-1%) | 2mo | $225,000 | $155 | 67 |
| 11502 Catamore St | 0.37mi | 4/1.5 (+1) | 1,400 (-4%) | 5mo | $210,000 | $150 | 65 |
| 414 Stonework Landing Ln | 0.68mi | 3/2.5 | 1,465 (+0%) | 12mo | $309,900 | $212 | 52 |
| 1705 Margaret St | 0.38mi | 2/1.0 (-1) | 1,332 (-9%) | 13mo | $399,000 | $300 | 52 |
| 409 Stonework Landing Ln | 0.69mi | 3/2.5 | 1,463 (+0%) | 12mo | $309,000 | $211 | 51 |
| 11026 Catamore St | 0.35mi | 3/1.5 | 1,244 (-15%) | 7mo | $219,999 | $177 | 51 |
| 11315 Stonework Grove Ln | 0.70mi | 3/2.5 | 1,524 (+4%) | 5mo | $279,700 | $184 | 50 |
| 11213 Bannister Ln | 0.75mi | 4/2.0 (+1) | 1,398 (-4%) | 3mo | $265,000 | $190 | 47 |
| 413 Stonework Sage Ln | 0.67mi | 3/2.5 | 1,568 (+7%) | 7mo | $279,990 | $179 | 44 |
| 416 Stonework Landing Ln | 0.67mi | 3/2.5 | 1,568 (+7%) | 10mo | $299,900 | $191 | 42 |
| 11023 Vista Norte Ct | 0.52mi | 4/2.5 (+1) | 1,358 (-7%) | 14mo | $189,900 | $140 | 41 |
| 233 Wellington St | 0.70mi | 2/1.0 (-1) | 1,352 (-7%) | 14mo | $239,000 | $177 | 38 |
Match score weights: distance 35% · size 25% · config 20% · recency 20%. Top-matched comps best support the ARV.
Projected returns pro-forma
-3.0% appreciation · 3.0% rent growth · sell at horizon
- IRR
- -18.0%
- Equity multiple
- 0.37×
- Total profit
- $-35,407
- Equity at exit
- $29,821
- IRR
- -10.1%
- Equity multiple
- 0.38×
- Total profit
- $-34,490
- Equity at exit
- $17,292
Cash invested: $56,000 (down + closing). Projections, not guarantees.
Landlord ↔ Tenant lean methodology
- Overall (STATE)
- 87 Strongly Landlord-Friendly
- State Texas
- 87 Strongly Landlord-Friendly · R+5
- County
- — inherits STATE
- City
- — inherits STATE
ZIP-level market 77076
- Home prices YoY
- -21.5%
- Active inventory
- 84
- Price-to-rent
- 9.3×
Monthly cashflow live
- Estimated rent
- $1,784 high interval (Pro) →
- Mortgage (P&I)
- −$1,049
- Tax from tax record
- −$325 /mo · $3,904/yr
- Insurance
- −$83
- HOA
- −$0
- Vacancy / Maint / Mgmt
- −$375
- Net cashflow
- $-48
Break-even live
Sensitivity live
| Price | -10% $65 | -5% $8 | +0% $-48 | +5% $-105 | +10% $-161 |
|---|---|---|---|---|---|
| Rent | -10% $-189 | -5% $-119 | +0% $-48 | +5% $22 | +10% $93 |
| Rate | -1.0pp $52 | -0.5pp $3 | base $-48 | +0.5pp $-100 | +1.0pp $-153 |
UW: 25.0% down · 7.5% · 30yr · 1.5% tax · 5.0% vac · 8.0% maint · 8.0% mgmt
Financing live
Cash to close
- Down payment
- $50,000
- Closing costs
- $6,000
- Reserves months
- —
- Total cash needed
- —
Loan-product check · same deal, 3 products live
Conventional
25% down · 7.5% · 30yr
- Down + closing
- —
- Monthly P&I
- —
- Monthly cashflow
- —
- DSCR
- —
- Eligible?
- —
Personal DTI + credit; lowest rate.
DSCR
20% down · 8.5% · 30yr
- Down + closing
- —
- Monthly P&I
- —
- Monthly cashflow
- —
- DSCR
- —
- Eligible?
- —
No personal income docs; deal must DSCR.
Hard money
10% down · 12.0% · 12mo
- Down + closing
- —
- Monthly P&I
- —
- Monthly cashflow
- —
- DSCR
- —
- Eligible?
- —
Short-term bridge; refi at stabilization.
Rent comps 20 comps
| Address | Beds | Baths | Sqft | Rent | $/sqft | DOM | Units | Dist |
|---|---|---|---|---|---|---|---|---|
| 810 Charles Rd Houston, TX | 3.0 | 2.0 | 1320 | $1,450 | $1.10 | 1d | 1 | 0.22mi |
| 810 Charles Rd Houston, TX | 3.0 | 2.0 | 1320 | $1,450 | $1.10 | 45d | 1 | 0.22mi |
| 426 Stonework Sage Ln Houston, TX | 3.0 | 2.5 | 1600 | $2,650 | $1.66 | 45d | 1 | 0.68mi |
| 28 Bucan St Unit B Houston, TX | 3.0 | 2.5 | 1572 | $1,999 | $1.27 | 26d | 1 | 1.06mi |
| 28 Bucan St Unit G Houston, TX | 3.0 | 2.5 | 1572 | $1,999 | $1.27 | 1d | 1 | 1.06mi |
| 28 Bucan St Unit B Houston, TX | 3.0 | 2.5 | 1572 | $1,999 | $1.27 | 1d | 1 | 1.06mi |
| 24 Bucan St Unit A Houston, TX | 3.0 | 2.5 | 1572 | $1,999 | $1.27 | 0d | 1 | 1.08mi |
| 24 Bucan St Unit C Houston, TX | 3.0 | 2.5 | 1572 | $1,999 | $1.27 | 26d | 1 | 1.08mi |
| 209 Clark Meadows Ln Houston, TX | 3.0 | 2.5 | 1620 | $2,399 | $1.48 | 14d | 1 | 1.14mi |
| 815 Cravens St Apt C1 Houston, TX | 2.0 | 1.5 | 1100 | $1,300 | $1.18 | 6d | 1 | 1.15mi |
| 815 Cravens St Apt F2 Houston, TX | 2.0 | 1.5 | 1100 | $1,300 | $1.18 | 20d | 1 | 1.15mi |
| 9910 Clark Rd Unit B Houston, TX | 3.0 | 2.5 | 1695 | $1,900 | $1.12 | 9d | 1 | 1.15mi |
| 819 Tidwell Rd #819 Houston, TX | 2.0 | 1.5 | 1100 | $1,300 | $1.18 | 45d | 1 | 1.24mi |
| 965 Tidwell Rd Houston, TX | 3.0 | 2.0 | 1145 | $1,309 | $1.14 | 22d | 1 | 1.27mi |
| 965 Tidwell Rd Houston, TX | 2.0 | 2.0 | 933 | $1,109 | $1.19 | 26d | 1 | 1.27mi |
| 9406 Bauman Rd Houston, TX | 2.0 | 1.0 | 900 | $1,076 | $1.20 | 21d | 1 | 1.31mi |
| 9406 Bauman Rd Houston, TX | 2.0 | 1.0 | 900 | $1,076 | $1.20 | 45d | 1 | 1.31mi |
| 9400 Bauman Rd Houston, TX | 1.0–2.0 | 1.0 | 800 | $1,207 | $1.51 | 24d | 6 | 1.32mi |
| 600 E Little York Rd Houston, TX | 1.0–3.0 | 1.0–2.0 | 847 | $1,375 | $1.62 | 16d | 17 | 1.38mi |
| 2006 Tidwell Rd Houston, TX | 2.0 | 2.0 | 1035 | $1,075 | $1.04 | 45d | 1 | 1.38mi |
Listing history 14 events
-
2026-06-21days on market $200,000 Active 11 DOM
-
2026-06-18days on market $200,000 Active 8 DOM
-
2026-06-17days on market $200,000 Active 7 DOM
-
2026-06-16days on market $200,000 Active 6 DOM
-
2026-06-15days on market $200,000 Active 5 DOM
-
2026-06-13pricestatusdays on market $200,000 Active 3 DOM
-
2026-05-31days on market $204,999 Active Under Contract 89 DOM
-
2026-05-08status Pending 452-char remark
-
2026-02-18$204,999 Active 452-char remark
-
2026-02-10historical
-
2025-12-02price $219,976
-
2025-09-19$244,876 Active
-
1992-05-01soldstatus
-
1988-06-01soldstatus $24,000
ⓘ Source: listings_history table (triggers on properties + properties_extension) + one-shot
backfill from property_details.listing_events for pre-trigger history.
Tax reassessment forecast TX · Resets to sale price
- Current annual tax
- $3,904 · $325/mo
- Projected year-2 tax
- $3,904 · $325/mo
- Expected delta
- $0/yr ($0/mo · 0.0%)
ⓘ Screening estimate from a state-policy table — verify with the county assessor before closing.
Climate risk First Street
- Flood 4/10 Moderate FEMA zone X (unshaded) · 21% chance over 30 yrs
- Wildfire 1/10 Low
- Heat 9/10 Extreme 7 d/yr ≥109°F today · 24 d/yr by 30 yrs out
- Wind 9/10 Extreme 99% chance of damaging wind over 30 yrs
- Air quality 3/10 Moderate 3 unhealthy d/yr today · 4 by 30 yrs out
Nearby sold comps map
Loading sold comps map…
Walkable amenities ~0.75 mi
Loading nearby amenities…
Taxation est. · year 1
- Rental income
- $21,406
- − Mortgage interest
- −$11,203
- − Property taxes
- −$3,904
- − Insurance
- −$1,000
- − Repairs & maintenance
- −$1,712
- − Management
- −$1,712
- − Depreciation
- −$5,818
- Taxable loss
- −$3,944
- Est. tax savings @ 24.0%
- +$947
- After-tax cash flow
- $368/yr
For passive investors: Depreciation is non-cash, so a rental often shows a tax loss while cash-flowing — sheltering income. Rental losses are passive: they offset passive income freely, and up to $25,000/yr can offset ordinary (W-2) income if you actively participate and your MAGI is under $100k (phasing out to $0 by $150k); unused losses carry forward. On sale, claimed depreciation is recaptured at up to 25%, and gains may owe capital-gains tax (a 1031 exchange can defer both). Figures are a year-1 estimate at your 24.0% rate — not tax advice; consult a CPA.
Schools (NCES district)
- District
- Houston ISD
- NCES district ID
- 4823640
- Math proficiency
- 27% ▼ -18.00%
- Reading proficiency
- 35% ▼ -6.00%
- Median HH income
- $46,054
- Composite
- 26.63/100
- National rank
- #7173
- State rank
- #593 of 826 in TX
Livability — Houston
- Score
- 74/100
- State rank
- #184
- US rank
- #4771
Category grades
Schools grade is shown separately in the Schools card above.
Census & demographics
- Census place
- Houston, TX
- County
- Harris County · 4,702,590 people
- City population
- 3,226,434
- Metro
- Houston-The Woodlands-Sugar Land, TX
- Population (ZIP)
- 31,222
- Household income
- $42,522
- Rent vs Own
- Severe rent burden
- 1781.0
Population outlook (Harris County) Hauer SSP2
- Today (2025)
- 5,571,493 people
- By 2030
- 6,089,821 · +9.3%
- By 2040
- 7,142,806 · +28.2%
- By 2050
- 8,185,864 · +46.9%
- By 2075
- 10,574,329 · +89.8%
- By 2100
- 12,109,958 · +117.4%
Race, ethnicity, and origin ACS 2023
- Neighborhood character
- Predominantly Hispanic (86%)
- Race & ethnicity
- Hispanic / Latino 86% Two or more races 29% Black 7% White 6%
- Hispanic origin (detail)
- Mexican 61%
- Common ancestry
- Romanian 1%
- Foreign-born
- 35% · Canada
- Languages at home
- 25% English-only · Spanish 74%
Political lean MEDSL · Harris
- 2024 margin
- Lean D (+5.5) · D 52.0% · R 46.4% · Other 1.6%
- 2008→2024 swing
- +3.9pp toward D · 2008: 1.6pp · 2024: 5.5pp
- All cycles
- 2024: D+5.5 2020: D+13.3 2016: D+12.4 2012: D+0.1 2008: D+1.6
Not yet ingested
- Civics
- —
Market trends
- HPI YoY
- ▼ -79.76%
- Current HPI
- 291.7578
- Rent YoY
- —
- Metro
- Houston-The Woodlands-Sugar Land, TX
- State GDP YoY
- ▲ 3.95%
- F500 in state
- 110
Industry mix (Fortune 500 HQ in TX)
| Industry | F500 HQs | Revenue |
|---|---|---|
| Energy | 16 | $1,198B |
|
||
| Technology | 5 | $198B |
|
||
| Engineering / Construction | 4 | $72B |
|
||
| Energy Services | 3 | $60B |
|
||
| Utilities | 3 | $41B |
|
||
| Healthcare | 2 | $330B |
|
||
Price history
+733.3% since first listed11 events — show timeline
- 2026-06-10 Listed $200,000 HARMLS
- 2026-06-01 Relisted — HARMLS
- 2026-05-21 Contingent — HARMLS
- 2026-05-17 Listing Removed — HARMLS
- 2026-05-08 Pending — HARMLS
- 2026-02-18 Listed $204,999 HARMLS
- 2026-02-10 Listing Removed — HARMLS
- 2025-12-02 Price Changed $219,976 HARMLS
- 2025-09-19 Listed $244,876 HARMLS
- 1992-05-01 Sold (Public Records) — Public Records
- 1988-06-01 Sold (Public Records) $24,000 Public Records
Property tax history
+7.9%/yrLatest (2025): $3,904 · +1.6% YoY. Source: county tax records.
Cash-flow waterfall
monthlySold comps — $/sqft
last 12 mo · ≤1 miLoading sold comps…