1043 NW 85th Ave Unit B-4 · Plantation, FL
Flood risk 1/10 · Minimal
- FEMA flood zone
- X (shaded)
- Chance of flooding over 30 yrs
- 0.0%
- Est. flood insurance / yr
- $507 – $1,088
Fire risk 1/10 · Minimal
- Est. fire insurance / yr
- $947 – $1,759
Heat risk 10/10 · Severe
- Hot days now (above 105°F)
- 7 days/yr
- Hot days in 30 yrs
- 26 days/yr
Wind risk 10/10 · Severe
- Chance of severe wind over 30 yrs
- 99.0%
Air-quality risk 3/10 · Minor
- Unhealthy air days now
- 2 days/yr
- Unhealthy air days in 30 yrs
- 3 days/yr
Risk factors via First Street. Map © Google.
Why this score? — see what drove the C- grade
The composite is a weighted blend of 9 inputs, each scored 0–100. Each bar is that input's sub-score; the figure is the points it added to the 100-point composite (weight × sub-score).
- Cash flow +19.2/30.0
- ARV discount +7.5/15.0
- 1% rule +7.3/10.0
- DSCR +6.1/10.0
- Schools +4.1/10.0
- Livability +4.1/5.0
- Rent growth +2.7/5.0
- Condition / age +2.5/5.0
- Appreciation +0.0/10.0
$200,000
🖨 Deal sheet 📄 Offer letter ✓ Due diligence
Listing remarks
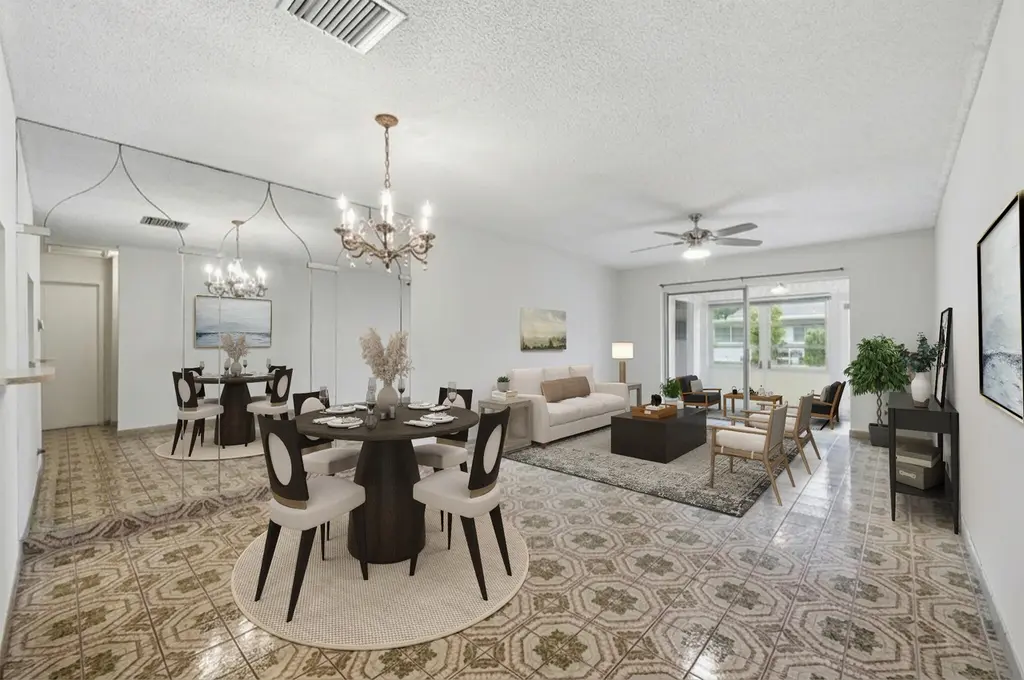
* * BEST PRICED 2 BEDROOM VILLA AT LAUDERDALE WEST * * Recently refreshed with a fresh coat of paint and virtually staged to show the home in it's best light. This cozy Villa offers spacious closets, functional layout, enclosed patio, and an abundance of natural light. Lauderdale West is an active over 55 community with a variety of amenities, including 2 clubhouses, pools, tennis counts, fitness center, card rooms, organized clubs, & bus service. Maintenance includes Internet, Cable TV, roof repairs/replacements, exterior painting & pest control. Don't miss the opportunity to make this beautiful property your own!
Key facts
- Spacious closets
- Clubhouses
- Functional layout
Tags
Property features AI
Finance
- Other: Located in a senior community; Pets not allowed
- HOA & community: Part of Lauderdale West association; Monthly HOA fee of $508; Association amenities include billiard room, clubhouse, pool (heated), and tennis courts; HOA fees cover cable TV, common areas, roof repairs, and pool service
Exterior
- Parking: Assigned parking; Guest parking; 2 open/total parking spaces
- Utilities: Public water; Public sewer; No additional utilities listed
- Home design: Villa; Single-story; First-floor entry; Faces southeast; Resale condition
- Construction: CBS construction; Shingle roof
- Exterior features: Covered patio; Open porch; Patio and porch areas; Not waterfront
Interior
- Kitchen: Dishwasher; Electric range; Refrigerator; Electric water heater
- Bedrooms: 2 bedrooms on the main level
- Flooring: Ceramic tile
- Bathrooms: 2 full bathrooms on the main level
- Heating & cooling: Central heating; Central air conditioning; Ceiling fans
- Interior features: No notable built-in interior features listed
- Laundry & utility: Laundry area (other configuration)
Neighborhood map
What this means for you Summary
Snapshot
- This is a 2-bed/2.0-bath condo listed at $200k.
Deal economics
- At list price, monthly cash flow is $216 ($3k/yr) — positive.
- The deal already cash-flows at list — no discount required.
- Meets the 1% rule at list price ($2k rent vs $200k).
- Recommended offer: $194k (3.0% below list) — sets the bar for market timing.
- Cap rate 7.6% vs local median 3.4% in Plantation — top-decile yield for the area; either an underpriced asset or a hidden risk that comps aren't pricing in. Stress-test before assuming the spread holds.
Location & tenants
- Location reads 82/100 on livability (#70 in FL, #1,174 nationally) — a professional / high-income tenant draw. Strengths: commute A+, housing A+, health & safety A+; Watch: amenities C-, cost of living D-.
- Broward (suburban): math 42% / reading 53% proficiency, ranked #46 of 73 in FL (top 63%) — families likely to look elsewhere, expect single-tenant / working-renter base with shorter leases.
- Market conditions: Rents flat; 559 active listings in the ZIP; 40 comparable units currently listed for rent nearby; rentals at typical pace (median 15d on market — plan ~3-4 weeks tenant-placement turnaround); 2,111 units permitted in Broward County in 2024 (1,265 in 5+ unit buildings).
- This rent runs 41% of the median local income ($72k/yr) — at the standard rent-burdened threshold; future hikes will face affordability resistance.
Forward outlook
- Local home prices are declining (-3.0%/yr); year-one equity from $1k of loan paydown is wiped out by about $6k of value loss. Plan a longer hold.
- Broward County population projected at +34% by 2050 — long-run rental-demand tailwind backs the buy-and-hold thesis.
Negotiation context
- It's been on market 51 days — a 3% lower offer ($194k) is reasonable based on typical stale-listing flexibility.
- 3 sale attempts since 13y ago with the ask held roughly flat each time — persistent listings suggest the price (not the market) is what's stuck; bring a comps-based counter.
- Current owner paid $50k; list at $200k implies a 300% gain — meaningful room to come down on a strong offer.
Risks & watch-outs
- Watch-outs: HOA is 21% of rent.
- Climate carrying-cost: severe wind risk, 99% chance of damaging wind over 30y; extreme-heat days projected 7→26/yr by 2055 (HVAC capex compounding) — expect insurance premiums to compound above CPI over the hold.
Questions for the listing agent
- It's been on market 51 days. Have you received any prior offers? Is the seller open to a 3% concession, seller financing, or rate buy-down credit?
- Built in 1972 — when were the roof, HVAC, electrical panel, plumbing, and water heater last replaced?
- What does the HOA fee cover, when was the last increase, and are there any pending special assessments or reserve-fund shortfalls?
- Any open or pending special assessments — roof, HVAC, plumbing, elevator, façade? What's the per-unit balance and payoff schedule, and is the seller paying it off at close or rolling it to the buyer?
- Is there a deadline driving the sale (1031 exchange, divorce, estate, relocation)? That informs how much negotiation room exists.
- Schools are B-rated — typically a magnet for longer-tenancy family renters. What's the average tenant stay here, and is there a school-zone premium baked into asking?
- What's the average days-on-market for RENTAL listings here right now (not sales)? A rising rental-DOM trend means longer vacancies and softer asking-rent achievability than the comps imply.
- What's the recent tenant-quality profile in this submarket — average credit score on applications, eviction rate, late-payment / NSF rate, and stable-employment percentage? A property-management company in the area should have these aggregated.
- How much new apartment / multifamily construction is in the pipeline within 1–3 miles? Heavy new supply (>2% of stock underway) typically softens rents 12–24 months out; light construction supports rent growth.
Investment metrics
- 1% rule
- 1.23% ✓
- Cap rate
- 7.59%
- Cash-on-cash
- 4.63%
- DSCR
- 1.21
- GRM
- 6.8
CMA / ARV
No comps found within radius.
Projected returns pro-forma
-3.0% appreciation · 0.6% rent growth · sell at horizon
- IRR
- -12.3%
- Equity multiple
- 0.57×
- Total profit
- $-24,213
- Equity at exit
- $29,821
- IRR
- -8.2%
- Equity multiple
- 0.55×
- Total profit
- $-25,068
- Equity at exit
- $17,292
Cash invested: $56,000 (down + closing). Projections, not guarantees.
Landlord ↔ Tenant lean methodology
- Overall (STATE)
- 87 Strongly Landlord-Friendly
- State Florida
- 87 Strongly Landlord-Friendly · R+3
- County
- — inherits STATE
- City
- — inherits STATE
ZIP-level market 33322
- Home prices YoY
- -33.3%
- Rents YoY
- 0.6%
- Active inventory
- 559
- Price-to-rent
- 6.8×
Monthly cashflow live
- Estimated rent
- $2,462 high interval (Pro) →
- Mortgage (P&I)
- −$1,049
- Tax from tax record
- −$89 /mo · $1,070/yr
- Insurance
- −$83
- HOA
- −$508
- Vacancy / Maint / Mgmt
- −$517
- Net cashflow
- $216
Break-even live
UW: 25.0% down · 7.5% · 30yr · 1.5% tax · 5.0% vac · 8.0% maint · 8.0% mgmt
Financing live
Cash to close
- Down payment
- $50,000
- Closing costs
- $6,000
- Reserves months
- —
- Total cash needed
- —
Loan-product check · same deal, 3 products live
Conventional
25% down · 7.5% · 30yr
- Down + closing
- —
- Monthly P&I
- —
- Monthly cashflow
- —
- DSCR
- —
- Eligible?
- —
Personal DTI + credit; lowest rate.
DSCR
20% down · 8.5% · 30yr
- Down + closing
- —
- Monthly P&I
- —
- Monthly cashflow
- —
- DSCR
- —
- Eligible?
- —
No personal income docs; deal must DSCR.
Hard money
10% down · 12.0% · 12mo
- Down + closing
- —
- Monthly P&I
- —
- Monthly cashflow
- —
- DSCR
- —
- Eligible?
- —
Short-term bridge; refi at stabilization.
Rent comps 40 comps
| Address | Beds | Baths | Sqft | Rent | $/sqft | DOM | Units | Dist |
|---|---|---|---|---|---|---|---|---|
| 1140 NW 85th Ave Unit A16 Plantation, FL | 2.0 | 1.5 | 1065 | $1,950 | $1.83 | 24d | 1 | 0.14mi |
| 8423 NW 12th St Unit C67 Plantation, FL | 1.0 | 2.0 | 1046 | $2,050 | $1.96 | 7d | 1 | 0.21mi |
| 8536 NW 12th Ct Plantation, FL | 2.0 | 2.0 | 1138 | $2,625 | $2.31 | 16d | 1 | 0.24mi |
| 8080 NW 10th Ct Plantation, FL | 2.0 | 2.0 | 1111 | $2,300 | $2.07 | 24d | 1 | 0.26mi |
| 8080 NW 10th Ct Plantation, FL | 1.0 | 1.0 | 862 | $1,875 | $2.18 | 20d | 1 | 0.26mi |
| 1171 Lakepointe Lndg Plantation, FL | 2.0 | 1.0–2.0 | 837 | $2,889 | $3.45 | 2d | 21 | 0.33mi |
| 832 NW 86th Ave Plantation, FL | 2.0 | 2.0 | 1144 | $2,913 | $2.55 | 22d | 1 | 0.36mi |
| 832 NW 86th Ave Plantation, FL | 1.0 | 1.0 | 976 | $2,141 | $2.19 | 12d | 1 | 0.36mi |
| 9000 NW 9th St Plantation, FL | 1.0 | 1.0 | 800 | $2,287 | $2.86 | 20d | 1 | 0.42mi |
| 8300 Cleary Blvd Plantation, FL | 1.0 | 1.0 | 760 | $2,483 | $3.27 | 3d | 1 | 0.42mi |
| 8300 Cleary Blvd Plantation, FL | 2.0 | 2.0 | 1099 | $3,032 | $2.76 | 18d | 1 | 0.42mi |
| 8300 Cleary Blvd Plantation, FL | 1.0 | 1.0 | 760 | $2,566 | $3.38 | 20d | 1 | 0.42mi |
| 8101 NW 14th St Plantation, FL | 1.0–2.0 | 1.5–2.0 | 1123 | $2,619 | $2.33 | 1d | 11 | 0.42mi |
| 8500 Cleary Blvd Plantation, FL | 1.0–3.0 | 1.0–2.0 | 1045 | $2,921 | $2.80 | 2d | 18 | 0.44mi |
| 1031 NW 79th Ave #1031 Plantation, FL | 2.0 | 2.0 | 1062 | $2,400 | $2.26 | 18d | 1 | 0.48mi |
| 8000 Cleary Blvd Plantation, FL | 2.0–3.0 | 2.0–3.0 | 1357 | $2,548 | $1.88 | 1d | 21 | 0.48mi |
| 791 N Pine Island Rd Plantation, FL | 2.0–3.0 | 2.0 | 1196 | $2,000 | $1.67 | 5d | 2 | 0.50mi |
| 791 N Pine Island Rd #306 Plantation, FL | 3.0 | 2.0 | 1320 | $2,400 | $1.82 | 12d | 1 | 0.51mi |
| 962 NW 79th Ter Plantation, FL | 2.0 | 2.0 | 1432 | $2,997 | $2.09 | 24d | 1 | 0.54mi |
| 771 N Pine Island Rd #213 Plantation, FL | 2.0 | 2.5 | 1385 | $2,400 | $1.73 | 5d | 1 | 0.56mi |
| 651 NW 82nd Ave Plantation, FL | 1.0 | 1.0 | 919 | $2,684 | $2.92 | 22d | 1 | 0.56mi |
| 1661 NW 81st Way #1661 Plantation, FL | 2.0 | 2.0 | 1034 | $2,400 | $2.32 | 3d | 1 | 0.58mi |
| 1661 NW 81st Way #1661 Plantation, FL | 2.0 | 2.0 | 1034 | $2,500 | $2.42 | 24d | 1 | 0.58mi |
| 711 N Pine Island Rd Plantation, FL | 1.0–2.0 | 1.0–2.0 | 910 | $1,850 | $2.03 | 3d | 5 | 0.59mi |
| 711 N Pine Island Rd Plantation, FL | 1.0–2.0 | 1.0–2.0 | 910 | $1,850 | $2.03 | 7d | 4 | 0.59mi |
| 751 N Pine Island Rd Plantation, FL | 1.0–3.0 | 1.0–2.0 | 1003 | $2,200 | $2.19 | 24d | 2 | 0.60mi |
| 7903 NW 7th Ct Unit 7903 Plantation, FL | 3.0 | 2.5 | 1340 | $2,800 | $2.09 | 22d | 1 | 0.62mi |
| 701 N Pine Island Rd #105 Plantation, FL | 1.0 | 1.5 | 764 | $1,650 | $2.16 | 17d | 1 | 0.62mi |
| 741 N Pine Island Rd #303 Plantation, FL | 3.0 | 2.0 | 1214 | $2,400 | $1.98 | 24d | 1 | 0.62mi |
| 601 NW 82nd Ave Plantation, FL | 1.0–2.0 | 1.0–2.5 | 1073 | $3,473 | $3.24 | 3d | 10 | 0.62mi |
| 7885 NW 7th Ct #406 Plantation, FL | 3.0 | 2.5 | 1340 | $2,800 | $2.09 | 10d | 1 | 0.63mi |
| 721 N Pine Island Rd Plantation, FL | 1.0–2.0 | 1.5–2.0 | 912 | $2,100 | $2.30 | 15d | 3 | 0.64mi |
| 721 N Pine Island Rd Plantation, FL | 1.0–2.0 | 1.5–2.0 | 912 | $2,100 | $2.30 | 7d | 3 | 0.64mi |
| 721 N Pine Island Rd Plantation, FL | 2.0 | 2.0 | 1058 | $1,925 | $1.82 | 17d | 2 | 0.64mi |
| 721 N Pine Island Rd #103 Plantation, FL | 2.0 | 2.0 | 1057 | $2,100 | $1.99 | 24d | 1 | 0.65mi |
| 708 NW 92nd Ave Plantation, FL | 1.0 | 1.0 | 805 | $1,850 | $2.30 | 7d | 1 | 0.67mi |
| 510 NW 84th Ave Plantation, FL | 2.0–3.0 | 2.0 | 1303 | $2,800 | $2.15 | 15d | 5 | 0.67mi |
| 510 NW 84th Ave Plantation, FL | 1.0–3.0 | 1.0–2.0 | 1124 | $2,650 | $2.36 | 16d | 6 | 0.67mi |
| 510 NW 84th Ave Plantation, FL | 1.0–3.0 | 1.0–2.0 | 1124 | $2,700 | $2.40 | 1d | 5 | 0.67mi |
| 510 NW 84th Ave Plantation, FL | 1.0–3.0 | 1.0–2.0 | 1137 | $2,900 | $2.55 | 10d | 7 | 0.67mi |
HOA detail condo
- Monthly dues
- $508 · $6,096/yr
- Likely covers
- internetcableroofpoolgym
- Assessments
- None detected in remarks — confirm with the listing agent.
Listing history 20 events
-
2026-06-18days on market $200,000 Active 51 DOM
-
2026-06-17days on market $200,000 Active 50 DOM
-
2026-06-16days on market $200,000 Active 49 DOM
-
2026-06-15days on market $200,000 Active 48 DOM
-
2026-06-13days on market $200,000 Active 46 DOM
-
2026-06-09days on market $200,000 Active 42 DOM
-
2026-06-08days on market $200,000 Active 41 DOM
-
2026-06-07days on market $200,000 Active 40 DOM
-
2026-06-04days on market $200,000 Active 37 DOM
-
2026-06-03days on market $200,000 Active 36 DOM
-
2026-06-02days on market $200,000 Active 35 DOM
-
2026-06-01days on market $200,000 Active 34 DOM
-
2026-05-31days on market $200,000 Active 33 DOM
-
2026-04-28$210,000 Active
-
2015-09-30historical
-
2015-06-29$89,000 Active
-
2014-09-04historical
-
2013-09-12$65,000
-
1990-07-13soldstatus $50,000
-
1973-10-01soldstatus $27,000
ⓘ Source: listings_history table (triggers on properties + properties_extension) + one-shot
backfill from property_details.listing_events for pre-trigger history.
Tax reassessment forecast FL · Resets to sale price
- Current annual tax
- $1,070 · $89/mo
- Projected year-2 tax
- $1,660 · $138/mo
- Expected delta
- +$590/yr (+$49/mo · 55.2%)
ⓘ Screening estimate from a state-policy table — verify with the county assessor before closing.
Climate risk First Street
- Flood 1/10 Low FEMA zone X (shaded) · 0% chance over 30 yrs
- Wildfire 1/10 Low
- Heat 10/10 Extreme 7 d/yr ≥105°F today · 26 d/yr by 30 yrs out
- Wind 10/10 Extreme 99% chance of damaging wind over 30 yrs
- Air quality 3/10 Moderate 2 unhealthy d/yr today · 3 by 30 yrs out
Nearby sold comps map
Loading sold comps map…
Walkable amenities ~0.75 mi
Loading nearby amenities…
Taxation est. · year 1
- Rental income
- $29,547
- − Mortgage interest
- −$11,203
- − Property taxes
- −$1,070
- − Insurance
- −$1,000
- − Repairs & maintenance
- −$2,364
- − Management
- −$2,364
- − HOA
- −$6,096
- − Depreciation
- −$5,818
- Taxable loss
- −$367
- Est. tax savings @ 24.0%
- +$88
- After-tax cash flow
- $2,679/yr
For passive investors: Depreciation is non-cash, so a rental often shows a tax loss while cash-flowing — sheltering income. Rental losses are passive: they offset passive income freely, and up to $25,000/yr can offset ordinary (W-2) income if you actively participate and your MAGI is under $100k (phasing out to $0 by $150k); unused losses carry forward. On sale, claimed depreciation is recaptured at up to 25%, and gains may owe capital-gains tax (a 1031 exchange can defer both). Figures are a year-1 estimate at your 24.0% rate — not tax advice; consult a CPA.
Schools (NCES district)
- District
- Broward
- NCES district ID
- 1200180
- Math proficiency
- 42% ▼ -18.00%
- Reading proficiency
- 53% ▼ -5.00%
- Median HH income
- $52,139
- Composite
- 40.88/100
- National rank
- #3621
- State rank
- #46 of 73 in FL
Livability — Plantation
- Score
- 82/100
- State rank
- #70
- US rank
- #1174
Category grades
Schools grade is shown separately in the Schools card above.
Census & demographics
- Census place
- Plantation, FL
- County
- Broward County · 1,963,430 people
- City population
- 77,492
- Metro
- Miami-Fort Lauderdale-Pompano Beach, FL
- Population (ZIP)
- 41,128
- Household income
- $71,755
- Rent vs Own
- Severe rent burden
- 931.0
Population outlook (Broward County) Hauer SSP2
- Today (2025)
- 2,207,033 people
- By 2030
- 2,360,704 · +7.0%
- By 2040
- 2,661,208 · +20.6%
- By 2050
- 2,946,698 · +33.5%
- By 2075
- 3,602,273 · +63.2%
- By 2100
- 3,970,984 · +79.9%
Race, ethnicity, and origin ACS 2023
- Neighborhood character
- Highly diverse neighborhood (Simpson 0.72)
- Race & ethnicity
- Hispanic / Latino 35% White 32% Black 24% Two or more races 22% Asian 4%
- Hispanic origin (detail)
- Puerto Rican 5% Cuban 6% Dominican 2% Salvadoran 1%
- Common ancestry
- Hispanic 5% Romanian 2% Scotch-Irish 2%
- Foreign-born
- 41% · Canada, Jamaica, South Korea
- Languages at home
- 58% English-only · Spanish 30% French/Haitian/Cajun 6% Other Indo-European 1%
Political lean MEDSL · Broward
- 2024 margin
- D (+17.0) · D 58.0% · R 41.0%
- 2008→2024 swing
- -17.8pp toward R · 2008: 34.7pp · 2024: 17.0pp
- All cycles
- 2024: D+17.0 2020: D+29.8 2016: D+35.0 2012: D+34.9 2008: D+34.7
Not yet ingested
- Civics
- —
Market trends
- HPI YoY
- ▼ -203.34%
- Current HPI
- 407.5452
- Rent YoY
- ▲ 0.60%
- Metro
- Miami-Fort Lauderdale-Pompano Beach, FL
- State GDP YoY
- ▲ 3.28%
- F500 in state
- 36
Industry mix (Fortune 500 HQ in FL)
| Industry | F500 HQs | Revenue |
|---|---|---|
| Industrial Technology | 2 | $29B |
|
||
| Insurance | 2 | $17B |
|
||
| Retail | 1 | $60B |
|
||
| Technology Distribution | 1 | $58B |
|
||
| Homebuilding | 1 | $35B |
|
||
| Technology Manufacturing | 1 | $35B |
|
||
Price history
+677.8% since first listed7 events — show timeline
- 2026-04-28 Listed $210,000 Beaches MLS
- 2015-09-30 Listing Removed — MARMLS
- 2015-06-29 Listed $89,000 MARMLS
- 2014-09-04 Listing Removed — Beaches MLS
- 2013-09-12 Listed $65,000 Beaches MLS
- 1990-07-13 Sold (Public Records) $50,000 Public Records
- 1973-10-01 Sold (Public Records) $27,000 Public Records
Property tax history
+15.2%/yrLatest (2025): $1,070 · +6.5% YoY. Source: county tax records.
Cash-flow waterfall
monthlySold comps — $/sqft
last 12 mo · ≤1 miLoading sold comps…