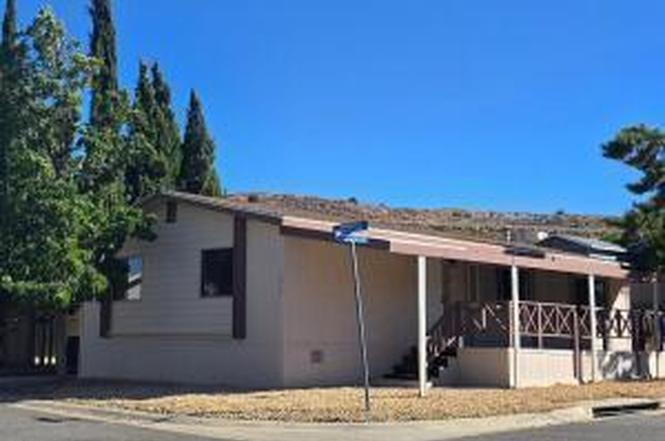
40701 Rancho Vista Blvd Blvd Spc 275 · Palmdale, CA
Flood risk 1/10 · Minimal
- FEMA flood zone
- X (unshaded)
- Chance of flooding over 30 yrs
- 0.0%
- Est. flood insurance / yr
- $507 – $1,088
Fire risk 8/10 · Major
- Est. fire insurance / yr
- $659 – $1,223
Heat risk 6/10 · Moderate
- Hot days now (above 99°F)
- 6 days/yr
- Hot days in 30 yrs
- 14 days/yr
Wind risk 1/10 · Minimal
- Chance of severe wind over 30 yrs
- —
Air-quality risk 10/10 · Severe
- Unhealthy air days now
- 28 days/yr
- Unhealthy air days in 30 yrs
- 33 days/yr
Risk factors via First Street. Map © Google.
Why this score? — see what drove the B- grade
The composite is a weighted blend of 9 inputs, each scored 0–100. Each bar is that input's sub-score; the figure is the points it added to the 100-point composite (weight × sub-score).
- Cash flow +30.0/30.0
- 1% rule +10.0/10.0
- DSCR +10.0/10.0
- ARV discount +7.1/15.0
- Schools +4.1/10.0
- Rent growth +3.1/5.0
- Livability +2.8/5.0
- Condition / age +2.5/5.0
- Appreciation +0.0/10.0
$189,500
🖨 Deal sheet 📄 Offer letter ✓ Due diligence
Listing remarks
SELLER MOTIVATED * ANOTHER PRICE IMPROVEMENT!!. .. * MOVE-IN AT CLOSE OF ESCROW TO This 1984 1056sf 3Bedroom 2 Bathroom Manufactured home was RENOVATED in 2023 Buyer Only lived in for 1 month after renovation. Renovation includes * * NEW ROOF, FLOORING throughout, INTERIOR/EXTERIOR PAINT, TOILETS & FAUCETS (both bathrooms), New Cabinet in guest bath, 10 new support PIERS(sub-area). Home equipped with central heat. New King Cool WINDOW EVAP in living room * * Home located on a large CORNER FENCED LOT, including shed, fenced on 3 sides. 2 Car covered carport. KITCHEN INCLUDES: Stove, NEW DISHWASHER. Guest Bath has new Cabinet. NEW FAUCET IN KITCHEN. Primary bedroom has Ensuite Bath A
Key facts
- New toilets
- New faucets
- New flooring
Tags
Neighborhood map
What this means for you Summary
Snapshot
- This is a 3-bed/2.0-bath manufactured listed at $190k.
Deal economics
- At list price, monthly cash flow is $1k ($18k/yr) — positive.
- The deal already cash-flows at list — no discount required.
- Meets the 1% rule at list price ($3k rent vs $190k).
- Recommended offer: $184k (3.0% below list) — sets the bar for market timing.
- Cap rate 15.6% vs local median 4.5% in Palmdale — top-decile yield for the area; either an underpriced asset or a hidden risk that comps aren't pricing in. Stress-test before assuming the spread holds.
Location & tenants
- Location reads 55/100 on livability (#861 in CA) — a working-class tenant base; expect higher turnover. Strengths: housing A+; Watch: schools F, crime F, amenities F.
- Westside Union Elementary (suburban): math 34% / reading 49% proficiency, ranked #565 of 1,400 in CA (top 40%) — families likely to look elsewhere, expect single-tenant / working-renter base with shorter leases.
- Market conditions: Rents rising (+2.3%/yr); 387 active listings in the ZIP; 5 comparable units currently listed for rent nearby; rentals leasing fast (median 2d on market — plan ~1-2 weeks tenant-placement turnaround); high-income renter base; 19,697 units permitted in Los Angeles County in 2024 (9,426 in 5+ unit buildings).
- This rent runs 34% of the median local income ($120k/yr) — at the standard rent-burdened threshold; future hikes will face affordability resistance.
Forward outlook
- Local home prices are declining (-3.0%/yr); year-one equity from $1k of loan paydown is wiped out by about $6k of value loss. Plan a longer hold.
- Los Angeles County population projected at +9% by 2050 — modest demand growth; plan on rents tracking national, not racing it.
- At projected returns (-3.0% appreciation + 2.3% rent growth), your $53k cash investment doubles in ~4 years — after that, you're playing with house money.
Negotiation context
- It's been on market 42 days — a 3% lower offer ($184k) is reasonable based on typical stale-listing flexibility.
- 5 sale attempts since 3y ago with the ask held roughly flat each time — persistent listings suggest the price (not the market) is what's stuck; bring a comps-based counter.
Risks & watch-outs
- Climate carrying-cost: severe wildfire risk; extreme-heat days projected 6→14/yr by 2055 (HVAC capex compounding) — expect insurance premiums to compound above CPI over the hold.
Questions for the listing agent
- It's been on market 42 days. Have you received any prior offers? Is the seller open to a 3% concession, seller financing, or rate buy-down credit?
- Is there a deadline driving the sale (1031 exchange, divorce, estate, relocation)? That informs how much negotiation room exists.
- Schools are F-rated, which usually means shorter tenancies and higher turnover. Who's the typical renter profile here, and what's been the actual vacancy rate?
- Crime grade is F in this area — have there been break-ins, vandalism, or insurance claims at this property in the last 3 years? What carrier currently insures it and at what premium?
- What's the average days-on-market for RENTAL listings here right now (not sales)? A rising rental-DOM trend means longer vacancies and softer asking-rent achievability than the comps imply.
- What's the recent tenant-quality profile in this submarket — average credit score on applications, eviction rate, late-payment / NSF rate, and stable-employment percentage? A property-management company in the area should have these aggregated.
- How much new for-sale + rental construction is in the pipeline within 1–3 miles? Heavy new supply typically softens prices + rents 12–24 months out; constrained supply supports both.
Investment metrics
- 1% rule
- 1.76% ✓
- Cap rate
- 15.61%
- Cash-on-cash
- 33.28%
- DSCR
- 2.48
- GRM
- 4.7
CMA / ARV
- ARV (on-the-fly)
- $187,968
- Comps found
- 12
Show comp detail 12 sales within ~0.75 mi
| Address | Dist | Beds/Ba | Sqft | Sold | Price | $/sf | Match |
|---|---|---|---|---|---|---|---|
| 40701 Rancho Vista Blvd Blvd Spc 275 | 0.00mi | 3/2.0 | 1,056 (0%) | 1mo | $180,000 | $170 | 99 |
| 40701 Rancho Vista Blvd Spc 358 | 0.00mi | 3/2.0 | 1,080 (+2%) | 1mo | $245,000 | $227 | 96 |
| 40701 Rancho Vis | 0.05mi | 3/2.0 | 1,080 (+2%) | 1mo | $245,000 | $227 | 94 |
| 40701 Rancho Vista Blvd #44 | 0.00mi | 3/2.0 | 1,056 (0%) | 16mo | $210,000 | $199 | 87 |
| 40701 Rancho Vista Blvd Spc 263 | 0.00mi | 3/2.0 | 1,152 (+9%) | 4mo | $189,000 | $164 | 82 |
| 40701 Rancho Vista Blvd #122 | 0.00mi | 3/2.0 | 1,152 (+9%) | 8mo | $239,000 | $207 | 78 |
| 40701 W Rancho Vista Blvd #284 | 0.00mi | 2/2.0 (-1) | 1,120 (+6%) | 10mo | $183,000 | $163 | 76 |
| 40701 Rancho Vista Blvd Spc 178 | 0.00mi | 3/2.0 | 1,200 (+14%) | 10mo | $182,000 | $152 | 69 |
| 40701 Rancho Vista Blvd Spc 85 | 0.00mi | 2/2.0 (-1) | 960 (-9%) | 13mo | $183,000 | $191 | 69 |
| 40701 Rancho Vista Blvd Spc.144 #144 | 0.00mi | 3/2.0 | 1,176 (+11%) | 16mo | $170,500 | $145 | 68 |
| 40701 Racho Vista Blvd #333 | 0.00mi | 2/2.0 (-1) | 960 (-9%) | 18mo | $171,000 | $178 | 65 |
| 5200 Entrar Dr #31 | 0.22mi | 3/2.0 | 1,152 (+9%) | 13mo | $190,000 | $165 | 64 |
Match score weights: distance 35% · size 25% · config 20% · recency 20%. Top-matched comps best support the ARV.
Projected returns pro-forma
-3.0% appreciation · 2.29% rent growth · sell at horizon
- IRR
- 27.7%
- Equity multiple
- 2.14×
- Total profit
- $60,604
- Equity at exit
- $28,255
- IRR
- 34.8%
- Equity multiple
- 4.09×
- Total profit
- $163,712
- Equity at exit
- $16,384
Cash invested: $53,060 (down + closing). Projections, not guarantees.
Landlord ↔ Tenant lean methodology
- Overall (STATE)
- 18 Strongly Tenant-Friendly
- State California
- 18 Strongly Tenant-Friendly · D+13
- County
- — inherits STATE
- City
- — inherits STATE
ZIP-level market 93551
- Home prices YoY
- -30.3%
- Rents YoY
- 2.3%
- Active inventory
- 387
- Price-to-rent
- 4.7×
Monthly cashflow live
- Estimated rent
- $3,344 high interval (Pro) →
- Mortgage (P&I)
- −$994
- Tax from tax record
- −$98 /mo · $1,176/yr
- Insurance
- −$79
- HOA
- −$0
- Vacancy / Maint / Mgmt
- −$702
- Net cashflow
- $1,471
Break-even live
UW: 25.0% down · 7.5% · 30yr · 1.5% tax · 5.0% vac · 8.0% maint · 8.0% mgmt
Financing live
Cash to close
- Down payment
- $47,375
- Closing costs
- $5,685
- Reserves months
- —
- Total cash needed
- —
Loan-product check · same deal, 3 products live
Conventional
25% down · 7.5% · 30yr
- Down + closing
- —
- Monthly P&I
- —
- Monthly cashflow
- —
- DSCR
- —
- Eligible?
- —
Personal DTI + credit; lowest rate.
DSCR
20% down · 8.5% · 30yr
- Down + closing
- —
- Monthly P&I
- —
- Monthly cashflow
- —
- DSCR
- —
- Eligible?
- —
No personal income docs; deal must DSCR.
Hard money
10% down · 12.0% · 12mo
- Down + closing
- —
- Monthly P&I
- —
- Monthly cashflow
- —
- DSCR
- —
- Eligible?
- —
Short-term bridge; refi at stabilization.
Rent comps 5 comps
| Address | Beds | Baths | Sqft | Rent | $/sqft | DOM | Units | Dist |
|---|---|---|---|---|---|---|---|---|
| 4660 Grandview Dr Palmdale, CA | 3.0 | 2.0 | 1494 | $3,040 | $2.03 | 1d | 1 | 0.50mi |
| 5637 Redwood Ave Unit B Palmdale, CA | 2.0 | 1.0 | 760 | $2,445 | $3.22 | 1d | 1 | 1.04mi |
| 40333 Argyle Ln Palmdale, CA | 3.0 | 2.0 | 1374 | $3,200 | $2.33 | 15d | 1 | 1.31mi |
| 3713 West Avenue M 11 Lancaster, CA | 3.0 | 2.0 | 1200 | $3,100 | $2.58 | 1d | 1 | 1.37mi |
| 3809 Cocina Ln Palmdale, CA | 3.0 | 2.0 | 1410 | $2,900 | $2.06 | 1d | 1 | 1.39mi |
Listing history 20 events
-
2026-03-13status Pending Sale
-
2026-03-13status Pending
-
2026-03-12historical
-
2026-01-28$189,500 Active
-
2026-01-24price $189,500
-
2026-01-23price $189,500
-
2025-12-04price $193,600
-
2025-11-25price $193,600
-
2025-09-09price $197,100
-
2025-09-09price $197,100
-
2025-08-22$198,600 Active
-
2023-09-21soldstatus $179,000 Closed
-
2023-08-25status Pending
-
2023-08-15price $180,000
-
2023-08-02price $185,000
-
2023-08-02status Active
-
2023-07-07status Pending
-
2023-06-27status Active
-
2023-05-23status Pending
-
2023-05-15$180,000 Active
ⓘ Source: listings_history table (triggers on properties + properties_extension) + one-shot
backfill from property_details.listing_events for pre-trigger history.
Tax reassessment forecast CA · Resets to sale price
- Current annual tax
- $1,176 · $98/mo
- Projected year-2 tax
- $1,440 · $120/mo
- Expected delta
- +$265/yr (+$22/mo · 22.5%)
ⓘ Screening estimate from a state-policy table — verify with the county assessor before closing.
Climate risk First Street
- Flood 1/10 Low FEMA zone X (unshaded) · 0% chance over 30 yrs
- Wildfire 8/10 Severe
- Heat 6/10 Major 6 d/yr ≥99°F today · 14 d/yr by 30 yrs out
- Wind 1/10 Low
- Air quality 10/10 Extreme 28 unhealthy d/yr today · 33 by 30 yrs out
Nearby sold comps map
Loading sold comps map…
Walkable amenities ~0.75 mi
Loading nearby amenities…
Taxation est. · year 1
- Rental income
- $40,134
- − Mortgage interest
- −$10,615
- − Property taxes
- −$1,176
- − Insurance
- −$948
- − Repairs & maintenance
- −$3,211
- − Management
- −$3,211
- − Depreciation
- −$5,513
- Taxable income
- $15,462
- Est. tax owed @ 24.0%
- −$3,711
- After-tax cash flow
- $13,947/yr
For passive investors: Depreciation is non-cash, so a rental often shows a tax loss while cash-flowing — sheltering income. Rental losses are passive: they offset passive income freely, and up to $25,000/yr can offset ordinary (W-2) income if you actively participate and your MAGI is under $100k (phasing out to $0 by $150k); unused losses carry forward. On sale, claimed depreciation is recaptured at up to 25%, and gains may owe capital-gains tax (a 1031 exchange can defer both). Figures are a year-1 estimate at your 24.0% rate — not tax advice; consult a CPA.
Schools (NCES district)
- District
- Westside Union Elementary
- NCES district ID
- 0642120
- Math proficiency
- 34% ▲ 1.00%
- Reading proficiency
- 49% ▲ 1.00%
- Median HH income
- $80,763
- Composite
- 41.01/100
- National rank
- #7473
- State rank
- #565 of 1400 in CA
Livability — Palmdale
- Score
- 55/100
- State rank
- #861
- US rank
- #23501
Category grades
Schools grade is shown separately in the Schools card above.
Census & demographics
- Census place
- Palmdale, CA
- County
- Los Angeles County · 9,444,647 people
- City population
- 177,644
- Metro
- Los Angeles-Long Beach-Anaheim, CA
- Population (ZIP)
- 54,360
- Household income
- $119,801
- Rent vs Own
- Severe rent burden
- 1168.0
Population outlook (Los Angeles County) Hauer SSP2
- Today (2025)
- 10,940,515 people
- By 2030
- 11,256,481 · +2.9%
- By 2040
- 11,729,929 · +7.2%
- By 2050
- 11,948,407 · +9.2%
- By 2075
- 11,818,114 · +8.0%
- By 2100
- 10,842,928 · -0.9%
Race, ethnicity, and origin ACS 2023
- Neighborhood character
- Diverse neighborhood (Simpson 0.68)
- Race & ethnicity
- Hispanic / Latino 43% White 33% Two or more races 17% Black 10% Asian 9%
- Hispanic origin (detail)
- Mexican 31%
- Common ancestry
- Russian 1% Lithuanian 1% Slovak 1%
- Foreign-born
- 22% · Canada, Vietnam, China
- Languages at home
- 61% English-only · Spanish 29% Other Indo-European 3% Tagalog/Filipino 3%
Political lean MEDSL · Los Angeles
- 2024 margin
- Solid D (+32.9) · D 64.8% · R 31.9% · Other 3.3%
- 2008→2024 swing
- -7.4pp toward R · 2008: 40.4pp · 2024: 32.9pp
- All cycles
- 2024: D+32.9 2020: D+44.2 2016: D+48.0 2012: D+40.0 2008: D+40.4
Not yet ingested
- Civics
- —
Market trends
- HPI YoY
- ▼ -142.22%
- Current HPI
- 327.1791
- Rent YoY
- ▲ 2.29%
- Metro
- Los Angeles-Long Beach-Anaheim, CA
- State GDP YoY
- ▲ 3.21%
- F500 in state
- 116
Industry mix (Fortune 500 HQ in CA)
| Industry | F500 HQs | Revenue |
|---|---|---|
| Technology | 27 | $1,492B |
|
||
| Financial Services | 3 | $174B |
|
||
| Retail | 3 | $44B |
|
||
| Insurance | 3 | $26B |
|
||
| Media / Entertainment | 2 | $115B |
|
||
| Pharmaceuticals / Biotech | 2 | $62B |
|
||
Price history
+5.3% since first listed20 events — show timeline
- 2026-03-13 Pending — CRMLS
- 2026-03-13 Pending — AVMLS
- 2026-03-12 Listing Removed — CRMLS
- 2026-01-28 Listed $189,500 AVMLS
- 2026-01-24 Price Changed $189,500 CRMLS
- 2026-01-23 Price Changed $189,500 AVMLS
- 2025-12-04 Price Changed $193,600 CRMLS
- 2025-11-25 Price Changed $193,600 AVMLS
- 2025-09-09 Price Changed $197,100 CRMLS
- 2025-09-09 Price Changed $197,100 AVMLS
- 2025-08-22 Listed $198,600 CRMLS
- 2023-09-21 Sold (MLS) $179,000 AVMLS
- 2023-08-25 Pending — AVMLS
- 2023-08-15 Price Changed $180,000 AVMLS
- 2023-08-02 Price Changed $185,000 AVMLS
- 2023-08-02 Relisted — AVMLS
- 2023-07-07 Pending — AVMLS
- 2023-06-27 Relisted — AVMLS
- 2023-05-23 Pending — AVMLS
- 2023-05-15 Listed $180,000 AVMLS
Property tax history
+1.6%/yrLatest (2025): $1,176 · +1.6% YoY. Source: county tax records.
Cash-flow waterfall
monthlySold comps — $/sqft
last 12 mo · ≤1 miLoading sold comps…