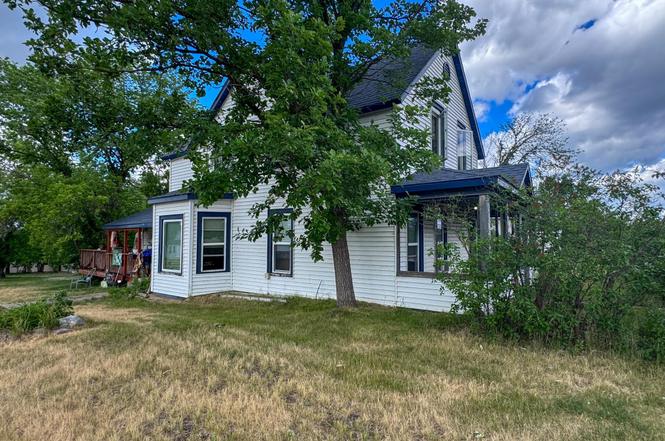
601 Irvine Ave NW · Bemidji, MN
Flood risk 1/10 · Minimal
- FEMA flood zone
- —
- Chance of flooding over 30 yrs
- 0.0%
- Est. flood insurance / yr
- —
Fire risk 6/10 · Moderate
- Est. fire insurance / yr
- $888 – $1,650
Heat risk 1/10 · Minimal
- Hot days now (above 93°F)
- 7 days/yr
- Hot days in 30 yrs
- 12 days/yr
Wind risk 1/10 · Minimal
- Chance of severe wind over 30 yrs
- —
Air-quality risk 3/10 · Minor
- Unhealthy air days now
- 3 days/yr
- Unhealthy air days in 30 yrs
- 3 days/yr
Risk factors via First Street. Map © Google.
Why this score? — see what drove the B- grade
The composite is a weighted blend of 9 inputs, each scored 0–100. Each bar is that input's sub-score; the figure is the points it added to the 100-point composite (weight × sub-score).
- Cash flow +28.5/30.0
- DSCR +10.0/10.0
- 1% rule +7.7/10.0
- ARV discount +7.5/15.0
- Schools +3.9/10.0
- Livability +3.7/5.0
- Rent growth +3.5/5.0
- Condition / age +2.5/5.0
- Appreciation +0.0/10.0
$145,000
🖨 Deal sheet 📄 Offer letter ✓ Due diligence
Listing remarks
Spacious 3 bedroom 2 bath home is conveniently located close to shopping, restaurants, and entertainment. Enjoy the front porch or large deck for entertaining on those summer nights!! currently operated as a rental, but would make a great private residence as well!!
Key facts
- Large deck
- Front porch
- Conveniently located
Tags
Property features AI
Finance
- Other: Living area approximately 1,662 square feet (above grade); total building area about 1,762
- Financial info: Standard rental license in place
Exterior
- Parking: Gravel parking
- Utilities: City water connected; City sewer connected; Natural gas service
- Home design: Residential two-story home; Entry level includes main level and upper level; Facing direction not specified
- Construction: Shingle roof (age 8 years or less); Foundation of poured concrete, brick/mortar and stone; Foundation dimensions approximately 50 x 21; Built on a foundation area of about 1,012
- Exterior features: Vinyl exterior; Front porch and deck; Partial fencing; Corner lot; Located on a state road with public maintenance
Interior
- Bedrooms: Three bedrooms
- Bathrooms: One full bathroom; One three-quarter bathroom
- Heating & cooling: Forced air heating; No central air
- Interior features: Partial unfinished basement; Main-level 3/4 bath and upper-level full bath; Main-level laundry
- Laundry & utility: Laundry located on the main level
Neighborhood map
What this means for you Summary
Snapshot
- This is a 4-bed/2.0-bath single-family listed at $145k.
Deal economics
- At list price, monthly cash flow is $475 ($6k/yr) — positive.
- The deal already cash-flows at list — no discount required.
- Meets the 1% rule at list price ($2k rent vs $145k).
- Cap rate 10.2% vs local median 3.6% in Bemidji — top-decile yield for the area; either an underpriced asset or a hidden risk that comps aren't pricing in. Stress-test before assuming the spread holds.
Location & tenants
- Location reads 73/100 on livability (#252 in MN) — a middle-class / working-renter tenant base. Strengths: amenities A+, cost of living A+, health & safety A+; Watch: crime F, commute F, employment F.
- Bemidji Public School District (rural): math 42% / reading 50% proficiency, ranked #173 of 301 in MN (top 58%) — families likely to look elsewhere, expect single-tenant / working-renter base with shorter leases.
- Market conditions: Rents rising fast (+4.0%/yr); 345 active listings in the ZIP; 165 units permitted in Beltrami County in 2024 (81 in 5+ unit buildings).
- This rent runs 30% of the median local income ($72k/yr) — at the standard rent-burdened threshold; future hikes will face affordability resistance.
Forward outlook
- Local home prices are declining (-3.0%/yr); year-one equity from $1k of loan paydown is wiped out by about $4k of value loss. Plan a longer hold.
- At projected returns (-3.0% appreciation + 4.0% rent growth), your $41k cash investment doubles in ~8 years — after that, you're playing with house money.
Negotiation context
- Only 4 days on market — expect competitive offers; lowballing is unlikely to land.
- Current owner paid $25k; list at $145k implies a 480% gain — meaningful room to come down on a strong offer.
Risks & watch-outs
- Watch-outs: built in 1896 — expect roof / HVAC / electrical / plumbing capex.
- Climate carrying-cost: major wildfire risk — expect insurance premiums to compound above CPI over the hold.
Questions for the listing agent
- Built in 1896 — when were the roof, HVAC, electrical panel, plumbing, and water heater last replaced?
- Is there a deadline driving the sale (1031 exchange, divorce, estate, relocation)? That informs how much negotiation room exists.
- Schools are B-rated — typically a magnet for longer-tenancy family renters. What's the average tenant stay here, and is there a school-zone premium baked into asking?
- Crime grade is F in this area — have there been break-ins, vandalism, or insurance claims at this property in the last 3 years? What carrier currently insures it and at what premium?
- What's the average days-on-market for RENTAL listings here right now (not sales)? A rising rental-DOM trend means longer vacancies and softer asking-rent achievability than the comps imply.
- What's the recent tenant-quality profile in this submarket — average credit score on applications, eviction rate, late-payment / NSF rate, and stable-employment percentage? A property-management company in the area should have these aggregated.
- How much new for-sale + rental construction is in the pipeline within 1–3 miles? Heavy new supply typically softens prices + rents 12–24 months out; constrained supply supports both.
Investment metrics
- 1% rule
- 1.27% ✓
- Cap rate
- 10.22%
- Cash-on-cash
- 14.04%
- DSCR
- 1.62
- GRM
- 6.6
CMA / ARV
No comps found within radius.
Projected returns pro-forma
-3.0% appreciation · 4.02% rent growth · sell at horizon
- IRR
- 5.4%
- Equity multiple
- 1.21×
- Total profit
- $8,666
- Equity at exit
- $21,620
- IRR
- 15.8%
- Equity multiple
- 2.34×
- Total profit
- $54,512
- Equity at exit
- $12,537
Cash invested: $40,600 (down + closing). Projections, not guarantees.
Landlord ↔ Tenant lean methodology
- Overall (STATE)
- 46 Balanced
- State Minnesota
- 46 Balanced · D+2
- County
- — inherits STATE
- City
- — inherits STATE
ZIP-level market 56601
- Home prices YoY
- -26.4%
- Rents YoY
- 4.0%
- Active inventory
- 345
- Price-to-rent
- 6.6×
Monthly cashflow live
- Estimated rent
- $1,835 medium interval (Pro) →
- Mortgage (P&I)
- −$760
- Tax from tax record
- −$154 /mo · $1,848/yr
- Insurance
- −$60
- HOA
- −$0
- Vacancy / Maint / Mgmt
- −$385
- Net cashflow
- $475
Break-even live
UW: 25.0% down · 7.5% · 30yr · 1.5% tax · 5.0% vac · 8.0% maint · 8.0% mgmt
Financing live
Cash to close
- Down payment
- $36,250
- Closing costs
- $4,350
- Reserves months
- —
- Total cash needed
- —
Loan-product check · same deal, 3 products live
Conventional
25% down · 7.5% · 30yr
- Down + closing
- —
- Monthly P&I
- —
- Monthly cashflow
- —
- DSCR
- —
- Eligible?
- —
Personal DTI + credit; lowest rate.
DSCR
20% down · 8.5% · 30yr
- Down + closing
- —
- Monthly P&I
- —
- Monthly cashflow
- —
- DSCR
- —
- Eligible?
- —
No personal income docs; deal must DSCR.
Hard money
10% down · 12.0% · 12mo
- Down + closing
- —
- Monthly P&I
- —
- Monthly cashflow
- —
- DSCR
- —
- Eligible?
- —
Short-term bridge; refi at stabilization.
Listing history 5 events
-
2026-06-19days on market $145,000 Active 4 DOM
-
2026-06-18days on market $145,000 Active 3 DOM
-
2026-06-17days on market $145,000 Active 2 DOM
-
2026-06-16remarks 267-char remark
-
2026-06-16$145,000 Active 1 DOM
ⓘ Source: listings_history table (triggers on properties + properties_extension) + one-shot
backfill from property_details.listing_events for pre-trigger history.
Tax reassessment forecast MN · Partial reset (capped growth)
- Current annual tax
- $1,848 · $154/mo
- Projected year-2 tax
- $1,848 · $154/mo
- Expected delta
- $0/yr ($0/mo · 0.0%)
ⓘ Screening estimate from a state-policy table — verify with the county assessor before closing.
Climate risk First Street
- Flood 1/10 Low 0% chance over 30 yrs
- Wildfire 6/10 Major
- Heat 1/10 Low 7 d/yr ≥93°F today · 12 d/yr by 30 yrs out
- Wind 1/10 Low
- Air quality 3/10 Moderate 3 unhealthy d/yr today · 3 by 30 yrs out
Nearby sold comps map
Loading sold comps map…
Walkable amenities ~0.75 mi
Loading nearby amenities…
Taxation est. · year 1
- Rental income
- $22,022
- − Mortgage interest
- −$8,122
- − Property taxes
- −$1,848
- − Insurance
- −$725
- − Repairs & maintenance
- −$1,762
- − Management
- −$1,762
- − Depreciation
- −$4,218
- Taxable income
- $3,585
- Est. tax owed @ 24.0%
- −$860
- After-tax cash flow
- $4,839/yr
For passive investors: Depreciation is non-cash, so a rental often shows a tax loss while cash-flowing — sheltering income. Rental losses are passive: they offset passive income freely, and up to $25,000/yr can offset ordinary (W-2) income if you actively participate and your MAGI is under $100k (phasing out to $0 by $150k); unused losses carry forward. On sale, claimed depreciation is recaptured at up to 25%, and gains may owe capital-gains tax (a 1031 exchange can defer both). Figures are a year-1 estimate at your 24.0% rate — not tax advice; consult a CPA.
Schools (NCES district)
- District
- Bemidji Public School District
- NCES district ID
- 2704440
- Math proficiency
- 42% ▼ -9.00%
- Reading proficiency
- 50% ▼ -5.00%
- Median HH income
- $47,735
- Composite
- 39.22/100
- National rank
- #4013
- State rank
- #173 of 301 in MN
Livability — Bemidji
- Score
- 73/100
- State rank
- #252
- US rank
- #5416
Category grades
Schools grade is shown separately in the Schools card above.
Census & demographics
- Census place
- Bemidji, MN
- County
- Beltrami County · 34,784 people
- City population
- 34,784
- Metro
- Bemidji, MN
- Population (ZIP)
- 34,784
- Household income
- $72,262
- Rent vs Own
- Severe rent burden
- 940.0
Population outlook (Beltrami County) Hauer SSP2
- Today (2025)
- 46,437 people
- By 2030
- 46,736 · +0.6%
- By 2040
- 46,804 · +0.8%
- By 2050
- 46,299 · -0.3%
- By 2075
- 44,037 · -5.2%
- By 2100
- 38,567 · -16.9%
Race, ethnicity, and origin ACS 2023
- Neighborhood character
- Predominantly White (80%)
- Race & ethnicity
- White 80% Native American 8% Two or more races 7% Hispanic / Latino 3% Black 1%
- Common ancestry
- Portuguese 19% Lithuanian 3% Romanian 2%
- Foreign-born
- 2% · Canada
- Languages at home
- 97% English-only · Spanish 1%
Political lean MEDSL · Beltrami
- 2024 margin
- Lean R (+5.7) · D 46.3% · R 52.0% · Other 1.7%
- 2008→2024 swing
- -15.8pp toward R · 2008: 10.2pp · 2024: -5.7pp
- All cycles
- 2024: R+5.7 2020: R+3.1 2016: R+9.8 2012: D+9.9 2008: D+10.2
Not yet ingested
- Civics
- —
Market trends
- HPI YoY
- ▼ -93.95%
- Current HPI
- 261.5734
- Rent YoY
- ▲ 4.02%
- Metro
- Bemidji, MN
- State GDP YoY
- ▲ 2.41%
- F500 in state
- 34
Industry mix (Fortune 500 HQ in MN)
| Industry | F500 HQs | Revenue |
|---|---|---|
| Healthcare | 2 | $407B |
|
||
| Retail | 2 | $150B |
|
||
| Consumer Goods | 2 | $32B |
|
||
| Industrial Machinery | 2 | $6B |
|
||
| Agriculture | 1 | $40B |
|
||
| Healthcare / Medical Devices | 1 | $32B |
|
||
Price history
+480.0% since first listed2 events — show timeline
- 2026-06-15 Listed $145,000 NORTHSTARMLS as Distributed by MLS Grid
- 2008-08-13 Sold (Public Records) $25,000 Public Records
Property tax history
+8.8%/yrLatest (2025): $1,848 · +13.0% YoY. Source: county tax records.
Cash-flow waterfall
monthlySold comps — $/sqft
last 12 mo · ≤1 miLoading sold comps…