 12-Plex
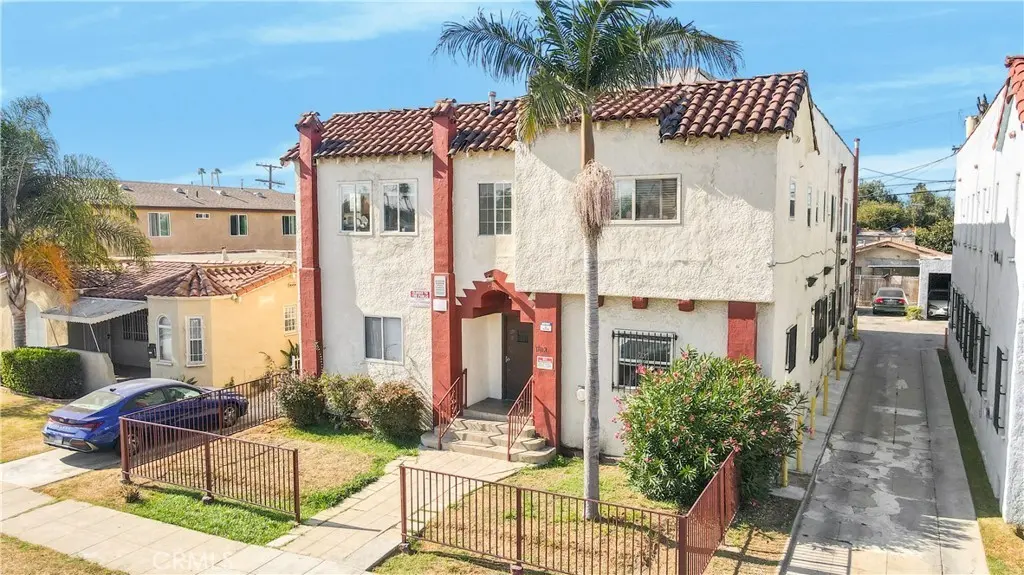
1103 W 64th St · Los Angeles, CA
Flood risk 1/10 · Minimal
- FEMA flood zone
- X (unshaded)
- Chance of flooding over 30 yrs
- 0.0%
- Est. flood insurance / yr
- $507 – $1,088
Fire risk 1/10 · Minimal
- Est. fire insurance / yr
- $659 – $1,223
Heat risk 5/10 · Moderate
- Hot days now (above 88°F)
- 7 days/yr
- Hot days in 30 yrs
- 21 days/yr
Wind risk 1/10 · Minimal
- Chance of severe wind over 30 yrs
- —
Air-quality risk 5/10 · Moderate
- Unhealthy air days now
- 7 days/yr
- Unhealthy air days in 30 yrs
- 7 days/yr
Risk factors via First Street. Map © Google.
Why this score? — see what drove the C- grade
The composite is a weighted blend of 9 inputs, each scored 0–100. Each bar is that input's sub-score; the figure is the points it added to the 100-point composite (weight × sub-score).
- Cash flow +26.1/30.0
- DSCR +8.8/10.0
- 1% rule +6.2/10.0
- Schools +3.6/10.0
- Livability +3.4/5.0
- Condition / age +2.5/5.0
- Rent growth +1.9/5.0
- ARV discount +0.7/15.0
- Appreciation +0.0/10.0
$1,725,000
🖨 Deal sheet (PDF) 📄 Offer letter ✓ Due diligence
Multi-family units
County records classify this as Multi-Family (5+ Unit). Listing-text estimate: 12 units. confirmed
5+ unit building — per-unit beds/baths from public records are typically unavailable; the breakdown below (if shown) is an estimate from the listing text.
Listing remarks
1103 W 64th St presents an excellent opportunity to acquire a well-located 12-unit multifamily property in South Los Angeles. The property features a desirable unit mix consisting of (7) Studios, (4) 1 bedroom/1 bath units, and (1) 2 bedroom/1 bath unit, currently generating $18,684 in monthly rental income. The asset is currently operating at an 8.14% cap rate and 7.69 GRM, providing investors with strong in place cash flow and stable income. Priced at just $143,750 per unit and $301 per square foot, the offering presents an attractive basis relative to comparable multifamily properties in the area. The property is conveniently located in South Los Angeles, offering easy access to Downto
Key facts
- Desirable unit mix
- 6,709 sq ft lot
- 6 parking spots
Tags
Property features AI
Finance
- Financial info: Total building area 5,716; Total of 12 units; Unit breakdown: seven units of one type (actual rents around $1,491), four units of another type (actual rents around $1,552), and one 2-bedroom unit (actual rent around $2,036); Gross scheduled income approximately $224,208; Gross income approximately $224,208; Net operating income approximately $143,876; Operating expenses approximately $73,606; Gross multiplier about 7.69; Rent controlled
Exterior
- Parking: Six uncovered parking spaces (total 6 parking spaces)
- Utilities: Public sewer; District/Public water; One separate water meter; Twelve separate gas meters; Twelve separate electric meters
- Home design: Community apartment property; Two-story building; Single building
- Construction: Year built per assessor; No ADU
- Exterior features: No pool
Interior
- Bedrooms: Unit mix includes 1-bedroom and 2-bedroom units (various unit counts)
- Bathrooms: Mostly one-bath units
- Interior features: Front entry
- Laundry & utility: No laundry facilities listed
Neighborhood map
What this means for you Summary
Snapshot
- This is a 12 × 1-bed/?-bath units multifamily listed at $1.73M.
Deal economics
- At list price, monthly cash flow is $4k ($52k/yr) — positive. Per door: $363/mo.
- The deal already cash-flows at list — no discount required.
- Meets the 1% rule at list price ($19k rent vs $1.73M).
- Recommended offer: $1.70M (1.5% below list) — sets the bar for market timing.
- Cap rate 9.3% vs local median 2.1% in Los Angeles — top-decile yield for the area; either an underpriced asset or a hidden risk that comps aren't pricing in. Stress-test before assuming the spread holds.
Location & tenants
- Location reads 68/100 on livability (#273 in CA) — a middle-class / working-renter tenant base. Strengths: amenities A+, commute A+, employment B; Watch: health & safety C-, crime F, cost of living F.
- Los Angeles Unified (urban): math 29% / reading 54% proficiency, ranked #223 of 517 in CA (top 43%) — families likely to look elsewhere, expect single-tenant / working-renter base with shorter leases; 67% free/reduced lunch — lower-income household profile, screen leases tightly.
- Zoned schools: Budlong Avenue Elementary (659 students, 96% FRL); John Muir Middle (693 students, 99% FRL); Augustus Hawkins High (math 17% / reading 27%, grade F, #950 of 1,170 statewide, top 82%, 1,179 students, 98% FRL) — zoned schools average 98% FRL vs 67% district-wide (30 pts higher); higher-poverty schools than district average — tighter screening recommended.
- Zoned-school proficiency averages 22% at this address vs 42% district-wide (-20 pts) — the specific schools serving this property underperform the Los Angeles Unified average; the district grade overstates school quality for this exact location.
- Market conditions: Rents soft (-2.5%/yr); 168 active listings in the ZIP; 1 comparable units currently listed for rent nearby; 19,697 units permitted in Los Angeles County in 2024 (9,426 in 5+ unit buildings).
Forward outlook
- Local home prices are declining (-3.0%/yr); year-one equity from $12k of loan paydown is wiped out by about $52k of value loss. Plan a longer hold.
- Los Angeles County population projected at +9% by 2050 — modest demand growth; plan on rents tracking national, not racing it.
Negotiation context
- It's been on market 19 days — a 2% lower offer ($1.70M) is reasonable based on typical stale-listing flexibility.
- 7 sale attempts since 24y ago with the ask held roughly flat each time — persistent listings suggest the price (not the market) is what's stuck; bring a comps-based counter.
- Current owner paid $915k; list at $1.73M implies a 89% gain — meaningful room to come down on a strong offer.
Risks & watch-outs
- Watch-outs: built in 1930 — expect roof / HVAC / electrical / plumbing capex.
- Climate carrying-cost: extreme-heat days projected 7→21/yr by 2055 (HVAC capex compounding) — expect insurance premiums to compound above CPI over the hold.
Questions for the listing agent
- Can we see the unit-by-unit rent roll, current vacancy, and any below-market leases? What's the average tenancy length?
- What capital expenditures (roof, boiler, parking lot, exteriors) have been made in the last 5 years, and what's planned in the next 2?
- Built in 1930 — when were the roof, HVAC, electrical panel, plumbing, and water heater last replaced?
- Is there a deadline driving the sale (1031 exchange, divorce, estate, relocation)? That informs how much negotiation room exists.
- Schools are D-rated, which usually means shorter tenancies and higher turnover. Who's the typical renter profile here, and what's been the actual vacancy rate?
- Crime grade is F in this area — have there been break-ins, vandalism, or insurance claims at this property in the last 3 years? What carrier currently insures it and at what premium?
- What's the average days-on-market for RENTAL listings here right now (not sales)? A rising rental-DOM trend means longer vacancies and softer asking-rent achievability than the comps imply.
- What's the recent tenant-quality profile in this submarket — average credit score on applications, eviction rate, late-payment / NSF rate, and stable-employment percentage? A property-management company in the area should have these aggregated.
- How much new apartment / multifamily construction is in the pipeline within 1–3 miles? Heavy new supply (>2% of stock underway) typically softens rents 12–24 months out; light construction supports rent growth.
Investment metrics
- 1% rule
- 1.12% ✓
- Cap rate
- 9.32%
- Cash-on-cash
- 10.81%
- DSCR
- 1.48
- GRM
- 7.4
CMA / ARV
- ARV (median comp)
- $1,498,147
- List price
- $1,725,000
- Delta
- 19.81%
- Verdict
- OVERPRICED
- Comps
- 9 within 1.0 mi
Projected returns pro-forma
-3.0% appreciation · 0.0% rent growth · sell at horizon
- IRR
- -3.4%
- Equity multiple
- 0.88×
- Total profit
- $-59,438
- Equity at exit
- $257,203
- IRR
- 2.8%
- Equity multiple
- 1.17×
- Total profit
- $84,474
- Equity at exit
- $149,146
Cash invested: $483,000 (down + closing). Projections, not guarantees.
Landlord ↔ Tenant lean methodology
- Overall (CITY)
- 0 Strongly Tenant-Friendly
- State California
- 18 Strongly Tenant-Friendly · D+13
- County
- — inherits STATE
- City Los Angeles
- 0 Strongly Tenant-Friendly · D+22
ZIP-level market 90044
- Rents YoY
- -2.5%
- Active inventory
- 168
- Price-to-rent
- 89.0×
Monthly cashflow live
- Estimated rent
- $19,376 high interval (Pro) →
- Mortgage (P&I)
- −$9,046
- Tax from tax record
- −$1,190 /mo · $14,284/yr
- Insurance
- −$719
- HOA
- −$0
- Vacancy / Maint / Mgmt
- −$4,069
- Net cashflow
- $4,352
Break-even live
Sensitivity live
| Price | -10% $5,328 | -5% $4,840 | +0% $4,352 | +5% $3,864 | +10% $3,375 |
|---|---|---|---|---|---|
| Rent | -10% $2,821 | -5% $3,586 | +0% $4,352 | +5% $5,117 | +10% $5,883 |
| Rate | -1.0pp $5,221 | -0.5pp $4,791 | base $4,352 | +0.5pp $3,905 | +1.0pp $3,450 |
12-unit breakdown (identical units grouped — click to expand)
| Units | Beds | Baths | Est. rent |
|---|---|---|---|
| 12× units | 1 | — | $19,380 |
| #1 | 1 | — | $1,615 |
| #2 | 1 | — | $1,615 |
| #3 | 1 | — | $1,615 |
| #4 | 1 | — | $1,615 |
| #5 | 1 | — | $1,615 |
| #6 | 1 | — | $1,615 |
| #7 | 1 | — | $1,615 |
| #8 | 1 | — | $1,615 |
| #9 | 1 | — | $1,615 |
| #10 | 1 | — | $1,615 |
| #11 | 1 | — | $1,615 |
| #12 | 1 | — | $1,615 |
| Total (12 units) | $19,376 | ||
UW: 25.0% down · 7.5% · 30yr · 1.5% tax · 5.0% vac · 8.0% maint · 8.0% mgmt
Financing live
Cash to close
- Down payment
- $431,250
- Closing costs
- $51,750
- Reserves months
- —
- Total cash needed
- —
Loan-product check · same deal, 3 products live
Conventional
25% down · 7.5% · 30yr
- Down + closing
- —
- Monthly P&I
- —
- Monthly cashflow
- —
- DSCR
- —
- Eligible?
- —
Personal DTI + credit; lowest rate.
DSCR
20% down · 8.5% · 30yr
- Down + closing
- —
- Monthly P&I
- —
- Monthly cashflow
- —
- DSCR
- —
- Eligible?
- —
No personal income docs; deal must DSCR.
Hard money
10% down · 12.0% · 12mo
- Down + closing
- —
- Monthly P&I
- —
- Monthly cashflow
- —
- DSCR
- —
- Eligible?
- —
Short-term bridge; refi at stabilization.
Rent comps 1 comps
| Address | Beds | Baths | Sqft | Rent | $/sqft | DOM | Units | Dist |
|---|---|---|---|---|---|---|---|---|
| 631 W 83rd St Los Angeles, CA | 3.0 | 2.0 | 4079 | $2,995 | $0.73 | 45d | 1 | 1.38mi |
Listing history 27 events
-
2026-06-21days on market $1,725,000 Active 19 DOM
-
2026-06-18days on market $1,725,000 Active 16 DOM
-
2026-06-17days on market $1,725,000 Active 15 DOM
-
2026-06-16days on market $1,725,000 Active 14 DOM
-
2026-06-15days on market $1,725,000 Active 13 DOM
-
2026-06-13days on market $1,725,000 Active 11 DOM
-
2026-06-09days on market $1,725,000 Active 7 DOM
-
2026-06-08days on market $1,725,000 Active 6 DOM
-
2026-06-07days on market $1,725,000 Active 5 DOM
-
2026-06-04days on market $1,725,000 Active 2 DOM
-
2026-06-02pricestatusdays on market $1,725,000 Active 1 DOM
-
2026-05-18historical
-
2026-03-16$1,795,000 Active
-
2025-12-09price
-
2025-09-01Active
-
2015-10-30soldstatus $915,000 Closed
-
2015-10-30soldstatus $915,000
-
2015-10-30soldstatus $925,100
-
2015-09-11status Pending
-
2015-08-22$925,000 Active
-
2015-08-19$925,000
-
2006-08-09historical
-
2006-02-08
-
2004-01-23soldstatus $500,000
-
2002-06-05historical
-
2002-04-05
-
1982-09-08soldstatus $175,000
ⓘ Source: listings_history table (triggers on properties + properties_extension) + one-shot
backfill from property_details.listing_events for pre-trigger history.
Tax reassessment forecast CA · Resets to sale price
- Current annual tax
- $14,284 · $1,190/mo
- Projected year-2 tax
- $14,284 · $1,190/mo
- Expected delta
- $0/yr ($0/mo · 0.0%)
ⓘ Screening estimate from a state-policy table — verify with the county assessor before closing.
Climate risk First Street
- Flood 1/10 Low FEMA zone X (unshaded) · 0% chance over 30 yrs
- Wildfire 1/10 Low
- Heat 5/10 Major 7 d/yr ≥88°F today · 21 d/yr by 30 yrs out
- Wind 1/10 Low
- Air quality 5/10 Major 7 unhealthy d/yr today · 7 by 30 yrs out
Nearby sold comps map
Loading sold comps map…
Walkable amenities ~0.75 mi
Loading nearby amenities…
Taxation est. · year 1
- Rental income
- $232,512
- − Mortgage interest
- −$96,627
- − Property taxes
- −$14,284
- − Insurance
- −$8,625
- − Repairs & maintenance
- −$18,601
- − Management
- −$18,601
- − Depreciation
- −$50,182
- Taxable income
- $25,592
- Est. tax owed @ 24.0%
- −$6,142
- After-tax cash flow
- $46,080/yr
For passive investors: Depreciation is non-cash, so a rental often shows a tax loss while cash-flowing — sheltering income. Rental losses are passive: they offset passive income freely, and up to $25,000/yr can offset ordinary (W-2) income if you actively participate and your MAGI is under $100k (phasing out to $0 by $150k); unused losses carry forward. On sale, claimed depreciation is recaptured at up to 25%, and gains may owe capital-gains tax (a 1031 exchange can defer both). Figures are a year-1 estimate at your 24.0% rate — not tax advice; consult a CPA.
Schools (NCES district)
- District
- Los Angeles Unified
- NCES district ID
- 0622710
- Math proficiency
- 29% ▼ -4.00%
- Reading proficiency
- 54% ▲ 10.00%
- Median HH income
- $50,403
- Composite
- 35.67/100
- National rank
- #4875
- State rank
- #223 of 517 in CA
Livability — Los Angeles
- Score
- 68/100
- State rank
- #273
- US rank
- #9237
Category grades
Schools grade is shown separately in the Schools card above.
Census & demographics
- Census place
- Los Angeles, CA
- County
- Los Angeles County · 9,444,647 people
- City population
- 3,838,149
- Metro
- Los Angeles-Long Beach-Anaheim, CA
- Population (ZIP)
- 94,830
- Household income
- $53,302
- Rent vs Own
- Severe rent burden
- 7490.0
Population outlook (Los Angeles County) Hauer SSP2
- Today (2025)
- 10,940,515 people
- By 2030
- 11,256,481 · +2.9%
- By 2040
- 11,729,929 · +7.2%
- By 2050
- 11,948,407 · +9.2%
- By 2075
- 11,818,114 · +8.0%
- By 2100
- 10,842,928 · -0.9%
Race, ethnicity, and origin ACS 2023
- Neighborhood character
- Predominantly Hispanic (67%)
- Race & ethnicity
- Hispanic / Latino 67% Black 29% Two or more races 23% White 1% Native American 1%
- Hispanic origin (detail)
- Mexican 39%
- Foreign-born
- 34% · Canada
- Languages at home
- 37% English-only · Spanish 62%
Political lean MEDSL · Los Angeles
- 2024 margin
- Solid D (+32.9) · D 64.8% · R 31.9% · Other 3.3%
- 2008→2024 swing
- -7.4pp toward R · 2008: 40.4pp · 2024: 32.9pp
- All cycles
- 2024: D+32.9 2020: D+44.2 2016: D+48.0 2012: D+40.0 2008: D+40.4
Not yet ingested
- Civics
- —
Market trends
- HPI YoY
- ▼ -691.99%
- Current HPI
- 467.9845
- Rent YoY
- ▼ -2.50%
- Metro
- Los Angeles-Long Beach-Anaheim, CA
- State GDP YoY
- ▲ 3.21%
- F500 in state
- 116
Industry mix (Fortune 500 HQ in CA)
| Industry | F500 HQs | Revenue |
|---|---|---|
| Technology | 27 | $1,492B |
|
||
| Financial Services | 3 | $174B |
|
||
| Retail | 3 | $44B |
|
||
| Insurance | 3 | $26B |
|
||
| Media / Entertainment | 2 | $115B |
|
||
| Pharmaceuticals / Biotech | 2 | $62B |
|
||
Price history
+885.7% since first listed17 events — show timeline
- 2026-06-02 Listed $1,725,000 CRMLS
- 2026-05-18 Listing Removed — CRMLS
- 2026-03-16 Listed $1,795,000 CRMLS
- 2025-12-09 Price Changed — TheMLS
- 2025-09-01 Listed — TheMLS
- 2015-10-30 Sold (Public Records) $925,100 Public Records
- 2015-10-30 Sold (MLS) $915,000 SDMLS
- 2015-10-30 Sold (MLS) $915,000 TheMLS
- 2015-09-11 Pending — TheMLS
- 2015-08-22 Listed $925,000 TheMLS
- 2015-08-19 Listed $925,000 SDMLS
- 2006-08-09 Delisted — TheMLS
- 2006-02-08 Listed — TheMLS
- 2004-01-23 Sold (Public Records) $500,000 Public Records
- 2002-06-05 Delisted — TheMLS
- 2002-04-05 Listed — TheMLS
- 1982-09-08 Sold (Public Records) $175,000 Public Records
Property tax history
+3.9%/yrLatest (2025): $14,284 · +1.5% YoY. Source: county tax records.
Cash-flow waterfall
monthlySold comps — $/sqft
last 12 mo · ≤1 miLoading sold comps…