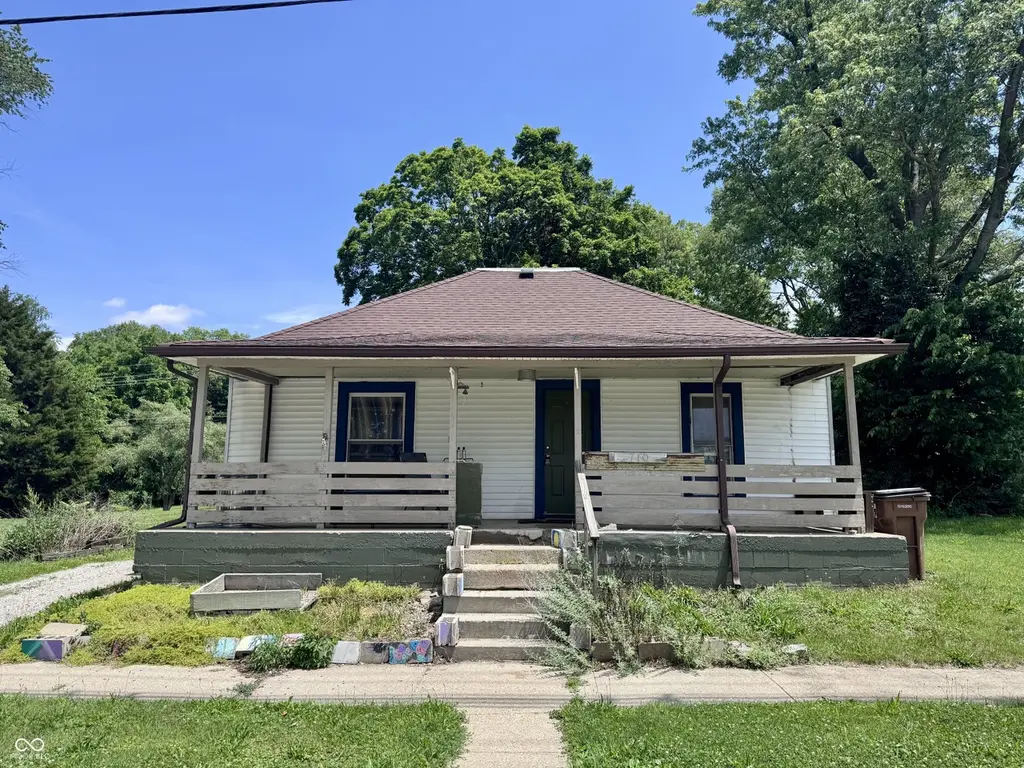
710 Kentucky St · Crawfordsville, IN
Flood risk 1/10 · Minimal
- FEMA flood zone
- X (unshaded)
- Chance of flooding over 30 yrs
- 0.0%
- Est. flood insurance / yr
- $473 – $860
Fire risk 1/10 · Minimal
- Est. fire insurance / yr
- $717 – $1,331
Heat risk 3/10 · Minor
- Hot days now (above 101°F)
- 7 days/yr
- Hot days in 30 yrs
- 18 days/yr
Wind risk 2/10 · Minimal
- Chance of severe wind over 30 yrs
- 0.0%
Air-quality risk 2/10 · Minimal
- Unhealthy air days now
- 1 days/yr
- Unhealthy air days in 30 yrs
- 2 days/yr
Risk factors via First Street. Map © Google.
Why this score? — see what drove the D grade
The composite is a weighted blend of 9 inputs, each scored 0–100. Each bar is that input's sub-score; the figure is the points it added to the 100-point composite (weight × sub-score).
- ARV discount +14.6/15.0
- Cash flow +11.4/30.0
- Livability +3.6/5.0
- DSCR +3.3/10.0
- Rent growth +3.3/5.0
- 1% rule +2.9/10.0
- Schools +2.5/10.0
- Condition / age +2.5/5.0
- Appreciation +0.0/10.0
$159,900
🖨 Deal sheet (PDF) 📄 Offer letter ✓ Due diligence
Listing remarks
Check out this 3 bed 1 bath home on 2 city lots. Right away you will notice all rooms are generously sized. The eat in kitchen sits between the living and bonus rooms, making it the heart of the home. Jack and Jill bathroom off of master with a linen closet. Roof is 11 years old, HVAC is 7 years old, appliances are 3 years old. The property also features a detached 3 car garage with a work bench. Large basement houses the mechanicals and provides a lot of extra storage space. Starting up, slowing down, and everything in between- this would be a great home for any buyer. Though the home does need a couple of cosmetic touch ups, the bones are great, and an affordable home is hard to come by i
Key facts
- Eat in kitchen
- Large basement
- 0.39 acre lot
Tags
Property features AI
Exterior
- Parking: Detached 3-car garage
- Utilities: Public water; Municipal sewer connected; Natural gas connected; Cable available
- Home design: Single-family residence; One level
- Construction: Vinyl siding; Block foundation
- Exterior features: Covered patio; Storage building; Small barn
Interior
- Kitchen: Electric oven; Dishwasher; Refrigerator; Gas water heater
- Bedrooms: Three bedrooms on the main level
- Bathrooms: One full bathroom on the main level
- Heating & cooling: Forced-air heating (natural gas); Central air conditioning
- Interior features: Eat-in kitchen; Formal living room; Unfinished basement
- Laundry & utility: Laundry closet
Neighborhood map
What this means for you Summary
Snapshot
- This is a 3-bed/1.0-bath single-family listed at $160k.
Deal economics
- At list price, monthly cash flow is $-57 ($-679/yr) — negative.
- To cash-flow at today's rent, offer at most $150k (6.3% below list).
- To meet the 1% rule (rent ≥ 1% of price), the offer needs to be $127k (20.5% below list).
- Recommended offer: $127k (20.5% below list) — sets the bar for 1% rule.
- Cap rate 5.9% vs local median 3.5% in Crawfordsville — top-decile yield for the area; either an underpriced asset or a hidden risk that comps aren't pricing in. Stress-test before assuming the spread holds.
Location & tenants
- Location reads 72/100 on livability (#118 in IN) — a middle-class / working-renter tenant base. Strengths: cost of living A+, housing A+, crime A; Watch: commute D+, amenities F, employment D-.
- Crawfordsville Community Schools (town): math 27% / reading 32% proficiency, ranked #247 of 301 in IN (top 82%) — low school quality limits family demand, transient renter base, plan for 1-2y turnover.
- Zoned schools: Laura Hose Elementary School (384 students, 68% FRL); Crawfordsville Middle School (math 17% / reading 30%, grade F, #257 of 330 statewide, top 79%, 580 students, 60% FRL); Crawfordsville Sr High School (math 32% / reading 62%, grade D-, #143 of 369 statewide, top 44%, 692 students, 58% FRL).
- Market conditions: Rents rising (+3.3%/yr); 210 active listings in the ZIP; 5 comparable units currently listed for rent nearby; rentals at typical pace (median 15d on market — plan ~3-4 weeks tenant-placement turnaround); 52 units permitted in Montgomery County in 2024 (0 in 5+ unit buildings).
Forward outlook
- Local home prices are declining (-3.0%/yr); year-one equity from $1k of loan paydown is wiped out by about $5k of value loss. Plan a longer hold.
- Montgomery County population projected to shrink 9% by 2050 — rents likely to lag national; underwrite the cash flow, not the appreciation.
Negotiation context
- Only 10 days on market — expect competitive offers; lowballing is unlikely to land.
- 7 sale attempts since 15y ago with the ask held roughly flat each time — persistent listings suggest the price (not the market) is what's stuck; bring a comps-based counter.
- Current owner paid $30k; list at $160k implies a 433% gain — meaningful room to come down on a strong offer.
Risks & watch-outs
- Watch-outs: built in 1920 — expect roof / HVAC / electrical / plumbing capex.
Questions for the listing agent
- What do current leases actually rent for vs. the listed asking? Can we see a recent rent roll and the last 12 months of T-12 income?
- Built in 1920 — when were the roof, HVAC, electrical panel, plumbing, and water heater last replaced?
- Is there a deadline driving the sale (1031 exchange, divorce, estate, relocation)? That informs how much negotiation room exists.
- Schools are D-rated, which usually means shorter tenancies and higher turnover. Who's the typical renter profile here, and what's been the actual vacancy rate?
- The area grade is low — what's the realistic commute time and amenity access for the typical tenant pool here? Any planned neighborhood developments (good or bad) we should know about?
- What's the average days-on-market for RENTAL listings here right now (not sales)? A rising rental-DOM trend means longer vacancies and softer asking-rent achievability than the comps imply.
- What's the recent tenant-quality profile in this submarket — average credit score on applications, eviction rate, late-payment / NSF rate, and stable-employment percentage? A property-management company in the area should have these aggregated.
- How much new for-sale + rental construction is in the pipeline within 1–3 miles? Heavy new supply typically softens prices + rents 12–24 months out; constrained supply supports both.
Investment metrics
- 1% rule
- 0.79% ✗
- Cap rate
- 5.87%
- Cash-on-cash
- -1.52%
- DSCR
- 0.93
- GRM
- 10.5
CMA / ARV
- ARV (on-the-fly)
- $190,017
- Comps found
- 12
Show comp detail 12 sales within ~0.75 mi
| Address | Dist | Beds/Ba | Sqft | Sold | Price | $/sf | Match |
|---|---|---|---|---|---|---|---|
| 509 Whitlock Ave | 0.18mi | 3/2.0 | 1,404 (-5%) | 1mo | $196,000 | $140 | 79 |
| 702 Pleasant Dr | 0.33mi | 3/2.0 | 1,600 (+9%) | 5mo | $250,000 | $156 | 62 |
| 308 N Grant Ave | 0.51mi | 2/1.0 (-1) | 1,380 (-6%) | 1mo | $149,900 | $109 | 60 |
| 508 Whitlock Ave | 0.20mi | 3/1.0 | 1,670 (+13%) | 14mo | $210,000 | $126 | 57 |
| 604 8th St | 0.21mi | 2/1.0 (-1) | 1,320 (-10%) | 14mo | $180,000 | $136 | 57 |
| 710 Binford St | 0.49mi | 3/2.0 | 1,555 (+6%) | 11mo | $195,000 | $125 | 55 |
| 611 Valley Dr | 0.31mi | 3/2.0 | 1,359 (-8%) | 18mo | $175,000 | $129 | 53 |
| 315 W North St | 0.54mi | 3/2.5 | 1,405 (-5%) | 10mo | $204,900 | $146 | 52 |
| 313 Binford St | 0.41mi | 2/1.0 (-1) | 1,344 (-9%) | 13mo | $124,900 | $93 | 51 |
| 904 Cottage Ave | 0.54mi | 2/1.0 (-1) | 1,344 (-9%) | 6mo | $150,000 | $112 | 50 |
| 304 N Oak St | 0.62mi | 3/1.0 | 1,680 (+14%) | 6mo | $170,000 | $101 | 43 |
| 913 Valley Dr | 0.49mi | 3/2.0 | 1,693 (+15%) | 14mo | $285,000 | $168 | 36 |
Match score weights: distance 35% · size 25% · config 20% · recency 20%. Top-matched comps best support the ARV.
Projected returns pro-forma
-3.0% appreciation · 3.28% rent growth · sell at horizon
- IRR
- -18.5%
- Equity multiple
- 0.35×
- Total profit
- $-29,164
- Equity at exit
- $23,842
- IRR
- -10.4%
- Equity multiple
- 0.36×
- Total profit
- $-28,586
- Equity at exit
- $13,825
Cash invested: $44,772 (down + closing). Projections, not guarantees.
Landlord ↔ Tenant lean methodology
- Overall (STATE)
- 90 Strongly Landlord-Friendly
- State Indiana
- 90 Strongly Landlord-Friendly · R+11
- County
- — inherits STATE
- City
- — inherits STATE
ZIP-level market 47933
- Home prices YoY
- -27.1%
- Rents YoY
- 3.3%
- Active inventory
- 210
- Price-to-rent
- 10.5×
Monthly cashflow live
- Estimated rent
- $1,271 high interval (Pro) →
- Mortgage (P&I)
- −$839
- Tax from tax record
- −$156 /mo · $1,867/yr
- Insurance
- −$67
- HOA
- −$0
- Vacancy / Maint / Mgmt
- −$267
- Net cashflow
- $-57
Break-even live
Sensitivity live
| Price | -10% $34 | -5% $-11 | +0% $-57 | +5% $-102 | +10% $-147 |
|---|---|---|---|---|---|
| Rent | -10% $-157 | -5% $-107 | +0% $-57 | +5% $-6 | +10% $44 |
| Rate | -1.0pp $24 | -0.5pp $-16 | base $-57 | +0.5pp $-98 | +1.0pp $-140 |
UW: 25.0% down · 7.5% · 30yr · 1.5% tax · 5.0% vac · 8.0% maint · 8.0% mgmt
Financing live
Cash to close
- Down payment
- $39,975
- Closing costs
- $4,797
- Reserves months
- —
- Total cash needed
- —
Loan-product check · same deal, 3 products live
Conventional
25% down · 7.5% · 30yr
- Down + closing
- —
- Monthly P&I
- —
- Monthly cashflow
- —
- DSCR
- —
- Eligible?
- —
Personal DTI + credit; lowest rate.
DSCR
20% down · 8.5% · 30yr
- Down + closing
- —
- Monthly P&I
- —
- Monthly cashflow
- —
- DSCR
- —
- Eligible?
- —
No personal income docs; deal must DSCR.
Hard money
10% down · 12.0% · 12mo
- Down + closing
- —
- Monthly P&I
- —
- Monthly cashflow
- —
- DSCR
- —
- Eligible?
- —
Short-term bridge; refi at stabilization.
Rent comps 5 comps
| Address | Beds | Baths | Sqft | Rent | $/sqft | DOM | Units | Dist |
|---|---|---|---|---|---|---|---|---|
| 923 Indian Springs Rd Crawfordsville, IN | 2.0 | 1.5 | 1000 | $1,089 | $1.09 | 15d | 3 | 0.65mi |
| 100 Aspen Dr Crawfordsville, IN | 1.0–3.0 | 1.0–2.0 | 1012 | $1,525 | $1.51 | 15d | 5 | 1.46mi |
| 103 Aspen Dr Crawfordsville, IN | 3.0 | 2.0 | 1213 | $1,525 | $1.26 | 23d | 1 | 1.46mi |
| 102 Aspen Dr Crawfordsville, IN | 2.0 | 2.0 | 1023 | $1,225 | $1.20 | 23d | 1 | 1.47mi |
| 200 Knoll Cir Crawfordsville, IN | 1.0–2.0 | 1.0–2.0 | 821 | $1,250 | $1.52 | 15d | 9 | 1.49mi |
Listing history 9 events
-
2026-06-21days on market $159,900 Active 10 DOM
-
2026-06-19days on market $159,900 Active 8 DOM
-
2026-06-18days on market $159,900 Active 7 DOM
-
2026-06-17days on market $159,900 Active 6 DOM
-
2026-06-16days on market $159,900 Active 5 DOM
-
2026-06-15days on market $159,900 Active 4 DOM
-
2026-06-14days on market $159,900 Active 2 DOM
-
2026-06-12remarks 699-char remark
-
2026-06-12$159,900 Active 1 DOM
ⓘ Source: listings_history table (triggers on properties + properties_extension) + one-shot
backfill from property_details.listing_events for pre-trigger history.
Tax reassessment forecast IN · Partial reset (capped growth)
- Current annual tax
- $1,867 · $156/mo
- Projected year-2 tax
- $1,867 · $156/mo
- Expected delta
- $0/yr ($0/mo · 0.0%)
ⓘ Screening estimate from a state-policy table — verify with the county assessor before closing.
Climate risk First Street
- Flood 1/10 Low FEMA zone X (unshaded) · 0% chance over 30 yrs
- Wildfire 1/10 Low
- Heat 3/10 Moderate 7 d/yr ≥101°F today · 18 d/yr by 30 yrs out
- Wind 2/10 Low 0% chance of damaging wind over 30 yrs
- Air quality 2/10 Low 1 unhealthy d/yr today · 2 by 30 yrs out
Nearby sold comps map
Loading sold comps map…
Walkable amenities ~0.75 mi
Loading nearby amenities…
Taxation est. · year 1
- Rental income
- $15,253
- − Mortgage interest
- −$8,957
- − Property taxes
- −$1,867
- − Insurance
- −$800
- − Repairs & maintenance
- −$1,220
- − Management
- −$1,220
- − Depreciation
- −$4,652
- Taxable loss
- −$3,462
- Est. tax savings @ 24.0%
- +$831
- After-tax cash flow
- $152/yr
For passive investors: Depreciation is non-cash, so a rental often shows a tax loss while cash-flowing — sheltering income. Rental losses are passive: they offset passive income freely, and up to $25,000/yr can offset ordinary (W-2) income if you actively participate and your MAGI is under $100k (phasing out to $0 by $150k); unused losses carry forward. On sale, claimed depreciation is recaptured at up to 25%, and gains may owe capital-gains tax (a 1031 exchange can defer both). Figures are a year-1 estimate at your 24.0% rate — not tax advice; consult a CPA.
Schools (NCES district)
- District
- Crawfordsville Community Schools
- NCES district ID
- 1802460
- Math proficiency
- 27% ▼ -8.00%
- Reading proficiency
- 32% ▼ -6.00%
- Median HH income
- $39,087
- Composite
- 24.73/100
- National rank
- #7606
- State rank
- #247 of 301 in IN
Livability — Crawfordsville
- Score
- 72/100
- State rank
- #118
- US rank
- #6376
Category grades
Schools grade is shown separately in the Schools card above.
Census & demographics
- Census place
- Crawfordsville, IN
- County
- Montgomery County · 28,357 people
- City population
- 28,357
- Metro
- Crawfordsville, IN
- Population (ZIP)
- 28,357
- Household income
- $68,130
- Rent vs Own
- Severe rent burden
- 464.0
Population outlook (Montgomery County) Hauer SSP2
- Today (2025)
- 37,893 people
- By 2030
- 37,539 · -0.9%
- By 2040
- 36,536 · -3.6%
- By 2050
- 34,454 · -9.1%
- By 2075
- 28,852 · -23.9%
- By 2100
- 21,145 · -44.2%
Race, ethnicity, and origin ACS 2023
- Neighborhood character
- Predominantly White (88%)
- Race & ethnicity
- White 88% Hispanic / Latino 7% Two or more races 7%
- Hispanic origin (detail)
- Mexican 5% Puerto Rican 2%
- Common ancestry
- Slovak 2% Lithuanian 2% Romanian 2%
- Foreign-born
- 4% · Canada
- Languages at home
- 93% English-only · Spanish 6%
Political lean MEDSL · Montgomery
- 2024 margin
- Solid R (+48.2) · D 24.9% · R 73.2% · Other 1.9%
- 2008→2024 swing
- -28.3pp toward R · 2008: -19.9pp · 2024: -48.2pp
- All cycles
- 2024: R+48.2 2020: R+49.1 2016: R+50.9 2012: R+38.5 2008: R+19.9
Not yet ingested
- Civics
- —
Market trends
- HPI YoY
- ▼ -78.91%
- Current HPI
- 211.6864
- Rent YoY
- ▲ 3.28%
- Metro
- Crawfordsville, IN
- State GDP YoY
- ▲ 2.90%
- F500 in state
- 18
Industry mix (Fortune 500 HQ in IN)
| Industry | F500 HQs | Revenue |
|---|---|---|
| Industrial Machinery | 2 | $37B |
|
||
| Healthcare | 1 | $177B |
|
||
| Pharmaceuticals | 1 | $45B |
|
||
| Metals / Steel | 1 | $18B |
|
||
| Agriculture | 1 | $17B |
|
||
| Packaging | 1 | $12B |
|
||
Price history
+539.6% since first listed13 events — show timeline
- 2026-06-11 Listed $159,900 MIBOR as Distributed by MLS Grid
- 2015-08-07 Listing Removed — MIBOR as Distributed by MLS Grid
- 2015-06-05 Listed $64,900 MIBOR as Distributed by MLS Grid
- 2015-06-05 Listed $64,900 IRMLS
- 2014-03-20 Listing Removed — MIBOR as Distributed by MLS Grid
- 2013-04-24 Listing Removed — MIBOR as Distributed by MLS Grid
- 2013-04-23 Listed $59,900 MIBOR as Distributed by MLS Grid
- 2012-06-12 Listed $69,900 MIBOR as Distributed by MLS Grid
- 2011-11-17 Listing Removed — MIBOR as Distributed by MLS Grid
- 2011-09-19 Listed $65,000 MIBOR as Distributed by MLS Grid
- 2011-03-10 Listing Removed — MIBOR as Distributed by MLS Grid
- 2011-03-10 Sold (MLS) $30,000 MIBOR as Distributed by MLS Grid
- 2011-02-03 Listed $25,000 MIBOR as Distributed by MLS Grid
Property tax history
+16.1%/yrLatest (2025): $1,867 · -0.2% YoY. Source: county tax records.
Cash-flow waterfall
monthlySold comps — $/sqft
last 12 mo · ≤1 miLoading sold comps…