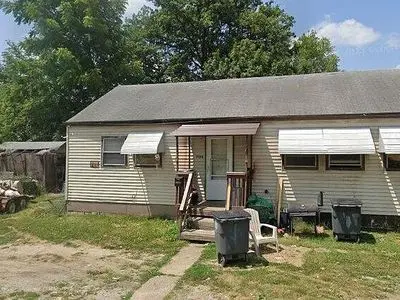
1104 Negley Ave · Evansville, IN
Flood risk 1/10 · Minimal
- FEMA flood zone
- X (unshaded)
- Chance of flooding over 30 yrs
- 0.0%
- Est. flood insurance / yr
- $507 – $1,088
Fire risk 1/10 · Minimal
- Est. fire insurance / yr
- $717 – $1,331
Heat risk 5/10 · Moderate
- Hot days now (above 106°F)
- 7 days/yr
- Hot days in 30 yrs
- 19 days/yr
Wind risk 2/10 · Minimal
- Chance of severe wind over 30 yrs
- 3.0%
Air-quality risk 3/10 · Minor
- Unhealthy air days now
- 3 days/yr
- Unhealthy air days in 30 yrs
- 4 days/yr
Risk factors via First Street. Map © Google.
Why this score? — see what drove the B- grade
The composite is a weighted blend of 9 inputs, each scored 0–100. Each bar is that input's sub-score; the figure is the points it added to the 100-point composite (weight × sub-score).
- Cash flow +30.0/30.0
- 1% rule +10.0/10.0
- DSCR +10.0/10.0
- ARV discount +7.5/15.0
- Rent growth +4.2/5.0
- Schools +3.3/10.0
- Livability +3.2/5.0
- Condition / age +1.0/5.0
- Appreciation +0.0/10.0
$75,000
🖨 Deal sheet (PDF) 📄 Offer letter ✓ Due diligence
Listing remarks
Rent Estimate: $2000-$2100/Month House is close to Downtown attractions and business including Ford Center, Vitroy Theater, Old National Evant Plaza, Ohio-River, Vally& apos; s Casino, Evansville Meseum, University Golf Course, and Airport. House is also blocks from many resturants, churches, parks, and night-life. About Evansville: Six NYSE companies (Accuride, Berry Global, Escalade, Old National Bank, Shoe Carnival, and OneMain Financial) are headquartered in Evansville, along with the global operations center for NYSE company Mead Johnson. The city is home to public and private enterprises in many areas, as Evansville serves as the region& apos; s economic hub. Evansville is ho
Key facts
- Blocks from parks
- New exterior doors
- New roof
Tags
Property features AI
Finance
- Other: Approximate living area 825
Exterior
- Home design: Built in 1944
- Construction: Original construction from 1944
- Exterior features: Located in the Business 41 subdivision
Neighborhood map
What this means for you Summary
Snapshot
- This is a 4-bed/2.0-bath other listed at $75k. Condition is rated poor.
Deal economics
- At list price, monthly cash flow is $501 ($6k/yr) — positive.
- The deal already cash-flows at list — no discount required.
- Meets the 1% rule at list price ($1k rent vs $75k).
- Recommended offer: $74k (1.5% below list) — sets the bar for market timing.
- Cap rate 14.3% vs local median 4.6% in Evansville — top-decile yield for the area; either an underpriced asset or a hidden risk that comps aren't pricing in. Stress-test before assuming the spread holds.
Location & tenants
- Location reads 63/100 on livability (#416 in IN) — a middle-class / working-renter tenant base. Strengths: cost of living A+, housing A+, health & safety A+; Watch: crime F, commute F, employment D-.
- Evansville Vanderburgh School Corporation (urban): math 36% / reading 43% proficiency, ranked #153 of 301 in IN (top 51%) — families likely to look elsewhere, expect single-tenant / working-renter base with shorter leases.
- Zoned schools: Evans School (math 9% / reading 7%, grade F, #945 of 994 statewide, top 95%, 499 students, 85% FRL); North Junior High School (math 44% / reading 57%, grade C, #43 of 330 statewide, top 14%, 929 students, 42% FRL); North High School (math 57% / reading 74%, grade B, #29 of 369 statewide, top 8%, 1,674 students, 35% FRL) — zoned schools at 54% FRL track the district average.
- Market conditions: Rents rising fast (+6.7%/yr); 234 active listings in the ZIP; 1 comparable units currently listed for rent nearby; 508 units permitted in Vanderburgh County in 2024 (32 in 5+ unit buildings).
Forward outlook
- Local home prices are declining (-3.0%/yr); year-one equity from $519 of loan paydown is wiped out by about $2k of value loss. Plan a longer hold.
- At projected returns (-3.0% appreciation + 6.7% rent growth), your $21k cash investment doubles in ~4 years — after that, you're playing with house money.
Negotiation context
- It's been on market 27 days — a 2% lower offer ($74k) is reasonable based on typical stale-listing flexibility.
Risks & watch-outs
- Watch-outs: built in 1944 — expect roof / HVAC / electrical / plumbing capex.
- Climate carrying-cost: extreme-heat days projected 7→19/yr by 2055 (HVAC capex compounding) — expect insurance premiums to compound above CPI over the hold.
Questions for the listing agent
- Have any recent inspections been done? Can we get a copy of the seller's disclosures and any deferred-maintenance estimates?
- Built in 1944 — when were the roof, HVAC, electrical panel, plumbing, and water heater last replaced?
- Is there a deadline driving the sale (1031 exchange, divorce, estate, relocation)? That informs how much negotiation room exists.
- Schools are D-rated, which usually means shorter tenancies and higher turnover. Who's the typical renter profile here, and what's been the actual vacancy rate?
- Crime grade is F in this area — have there been break-ins, vandalism, or insurance claims at this property in the last 3 years? What carrier currently insures it and at what premium?
- What's the average days-on-market for RENTAL listings here right now (not sales)? A rising rental-DOM trend means longer vacancies and softer asking-rent achievability than the comps imply.
- What's the recent tenant-quality profile in this submarket — average credit score on applications, eviction rate, late-payment / NSF rate, and stable-employment percentage? A property-management company in the area should have these aggregated.
- How much new for-sale + rental construction is in the pipeline within 1–3 miles? Heavy new supply typically softens prices + rents 12–24 months out; constrained supply supports both.
Investment metrics
- 1% rule
- 1.72% ✓
- Cap rate
- 14.31%
- Cash-on-cash
- 28.64%
- DSCR
- 2.27
- GRM
- 4.8
CMA / ARV
No comps found within radius.
Projected returns pro-forma
-3.0% appreciation · 6.72% rent growth · sell at horizon
- IRR
- 27.1%
- Equity multiple
- 2.18×
- Total profit
- $24,797
- Equity at exit
- $11,183
- IRR
- 36.8%
- Equity multiple
- 5.05×
- Total profit
- $84,973
- Equity at exit
- $6,485
Cash invested: $21,000 (down + closing). Projections, not guarantees.
Landlord ↔ Tenant lean methodology
- Overall (STATE)
- 90 Strongly Landlord-Friendly
- State Indiana
- 90 Strongly Landlord-Friendly · R+11
- County
- — inherits STATE
- City
- — inherits STATE
ZIP-level market 47711
- Home prices YoY
- -32.3%
- Rents YoY
- 6.7%
- Active inventory
- 234
- Price-to-rent
- 4.8×
Monthly cashflow live
- Estimated rent
- $1,290 medium interval (Pro) →
- Mortgage (P&I)
- −$393
- Tax est. 1.5%
- −$94 /mo · $1,125/yr
- Insurance
- −$31
- HOA
- −$0
- Vacancy / Maint / Mgmt
- −$271
- Net cashflow
- $501
Break-even live
Sensitivity live
| Price | -10% $553 | -5% $527 | +0% $501 | +5% $475 | +10% $449 |
|---|---|---|---|---|---|
| Rent | -10% $399 | -5% $450 | +0% $501 | +5% $552 | +10% $603 |
| Rate | -1.0pp $539 | -0.5pp $520 | base $501 | +0.5pp $482 | +1.0pp $462 |
UW: 25.0% down · 7.5% · 30yr · 1.5% tax · 5.0% vac · 8.0% maint · 8.0% mgmt
Financing live
Cash to close
- Down payment
- $18,750
- Closing costs
- $2,250
- Reserves months
- —
- Total cash needed
- —
Loan-product check · same deal, 3 products live
Conventional
25% down · 7.5% · 30yr
- Down + closing
- —
- Monthly P&I
- —
- Monthly cashflow
- —
- DSCR
- —
- Eligible?
- —
Personal DTI + credit; lowest rate.
DSCR
20% down · 8.5% · 30yr
- Down + closing
- —
- Monthly P&I
- —
- Monthly cashflow
- —
- DSCR
- —
- Eligible?
- —
No personal income docs; deal must DSCR.
Hard money
10% down · 12.0% · 12mo
- Down + closing
- —
- Monthly P&I
- —
- Monthly cashflow
- —
- DSCR
- —
- Eligible?
- —
Short-term bridge; refi at stabilization.
Rent comps 1 comps
| Address | Beds | Baths | Sqft | Rent | $/sqft | DOM | Units | Dist |
|---|---|---|---|---|---|---|---|---|
| 905 Vanderburgh Ave Evansville, IN | 3.0 | 1.0 | 988 | $1,200 | $1.21 | 15d | 1 | 0.80mi |
Listing history 16 events
-
2026-06-22days on market $75,000 Active 27 DOM
-
2026-06-18days on market $75,000 Active 24 DOM
-
2026-06-17days on market $75,000 Active 23 DOM
-
2026-06-16days on market $75,000 Active 22 DOM
-
2026-06-15days on market $75,000 Active 21 DOM
-
2026-06-14days on market $75,000 Active 19 DOM
-
2026-06-13days on market $75,000 Active 18 DOM
-
2026-06-10days on market $75,000 Active 16 DOM
-
2026-06-09days on market $75,000 Active 15 DOM
-
2026-06-08days on market $75,000 Active 14 DOM
-
2026-06-07days on market $75,000 Active 13 DOM
-
2026-06-02days on market $75,000 Active 8 DOM
-
2026-06-01days on market $75,000 Active 7 DOM
-
2026-05-31days on market $75,000 Active 6 DOM
-
2026-05-30days on market $75,000 Active 5 DOM
-
2026-05-25$75,000 Active
ⓘ Source: listings_history table (triggers on properties + properties_extension) + one-shot
backfill from property_details.listing_events for pre-trigger history.
Climate risk First Street
- Flood 1/10 Low FEMA zone X (unshaded) · 0% chance over 30 yrs
- Wildfire 1/10 Low
- Heat 5/10 Major 7 d/yr ≥106°F today · 19 d/yr by 30 yrs out
- Wind 2/10 Low 3% chance of damaging wind over 30 yrs
- Air quality 3/10 Moderate 3 unhealthy d/yr today · 4 by 30 yrs out
Nearby sold comps map
Loading sold comps map…
Walkable amenities ~0.75 mi
Loading nearby amenities…
Taxation est. · year 1
- Rental income
- $15,486
- − Mortgage interest
- −$4,201
- − Property taxes
- −$1,125
- − Insurance
- −$375
- − Repairs & maintenance
- −$1,239
- − Management
- −$1,239
- − Depreciation
- −$2,182
- Taxable income
- $5,125
- Est. tax owed @ 24.0%
- −$1,230
- After-tax cash flow
- $4,784/yr
For passive investors: Depreciation is non-cash, so a rental often shows a tax loss while cash-flowing — sheltering income. Rental losses are passive: they offset passive income freely, and up to $25,000/yr can offset ordinary (W-2) income if you actively participate and your MAGI is under $100k (phasing out to $0 by $150k); unused losses carry forward. On sale, claimed depreciation is recaptured at up to 25%, and gains may owe capital-gains tax (a 1031 exchange can defer both). Figures are a year-1 estimate at your 24.0% rate — not tax advice; consult a CPA.
Condition & rehab AI · 1 photo
This property requires extensive repairs and updates to bring it up to a livable condition. Significant work is needed on the exterior, interior, and systems to improve its value and appeal.
Repairs flagged
- Major siding — Significant wear and tear
- Major roof — No visible damage, but overall condition is unknown
- Major flooring — No visible flooring, but likely in poor condition
- Major interior walls/paint — No visible interior, but likely in poor condition
- Major bathrooms — No visible bathrooms, but likely in poor condition
- Major kitchen — No visible kitchen, but likely in poor condition
- Major systems — No visible systems, but likely in poor condition
Value-add opportunities
- Both landscaping and curb appeal — Improves aesthetics and first impressions
- Both exterior repairs and painting — Enhances curb appeal and value
- Both interior repairs and painting — Improves living space and value
- Both roof repair or replacement — Ensures structural integrity and value
- Both kitchen and bathroom updates — Modernizes spaces and increases value
Renovation cost estimate screening
| Repair item | Severity | Est. cost |
|---|---|---|
| siding · Significant wear and tear | Major | $15,000–50,000 |
| roof · No visible damage, but overall condition is unknown | Major | $15,000–50,000 |
| flooring · No visible flooring, but likely in poor condition | Major | $15,000–50,000 |
| interior walls/paint · No visible interior, but likely in poor condition | Major | $15,000–50,000 |
| bathrooms · No visible bathrooms, but likely in poor condition | Major | $15,000–50,000 |
| kitchen · No visible kitchen, but likely in poor condition | Major | $15,000–50,000 |
| systems · No visible systems, but likely in poor condition | Major | $15,000–50,000 |
| Total estimated repair cost · 7 items | $105,000–350,000 |
Value-add ROI direction
- Both landscaping and curb appeal — Improves aesthetics and first impressions ↑
- Both exterior repairs and painting — Enhances curb appeal and value ↑
- Both interior repairs and painting — Improves living space and value ↑
- Both roof repair or replacement — Ensures structural integrity and value ↑
- Both kitchen and bathroom updates — Modernizes spaces and increases value ↑
ⓘ Cost ranges are severity-bucket heuristics (US national rule-of-thumb). Get contractor quotes + a written scope before underwriting a rehab budget.
Schools (NCES district)
- District
- Evansville Vanderburgh School Corporation
- NCES district ID
- 1803450
- Math proficiency
- 36% ▼ -7.00%
- Reading proficiency
- 43% ▼ -3.00%
- Median HH income
- $43,270
- Composite
- 33.41/100
- National rank
- #5471
- State rank
- #153 of 301 in IN
Livability — Evansville
- Score
- 63/100
- State rank
- #416
- US rank
- #15047
Category grades
Schools grade is shown separately in the Schools card above.
Census & demographics
- Census place
- Evansville, IN
- County
- Vanderburgh County · 146,793 people
- City population
- 146,793
- Metro
- Evansville, IN-KY
- Population (ZIP)
- 30,944
- Household income
- $66,320
- Rent vs Own
- Severe rent burden
- 659.0
Population outlook (Vanderburgh County) Hauer SSP2
- Today (2025)
- 187,038 people
- By 2030
- 188,907 · +1.0%
- By 2040
- 190,272 · +1.7%
- By 2050
- 188,871 · +1.0%
- By 2075
- 180,751 · -3.4%
- By 2100
- 163,015 · -12.8%
Race, ethnicity, and origin ACS 2023
- Neighborhood character
- Predominantly White (85%)
- Race & ethnicity
- White 85% Black 8% Two or more races 5% Hispanic / Latino 2%
- Common ancestry
- Lithuanian 2% Romanian 2% Slovak 1%
- Foreign-born
- 2% · Canada
- Languages at home
- 97% English-only · Spanish 2%
Political lean MEDSL · Vanderburgh
- 2024 margin
- R (+12.7) · D 43.0% · R 55.6% · Other 1.4%
- 2008→2024 swing
- -15.1pp toward R · 2008: 2.5pp · 2024: -12.7pp
- All cycles
- 2024: R+12.7 2020: R+9.6 2016: R+16.9 2012: R+10.8 2008: D+2.5
Not yet ingested
- Civics
- —
Market trends
- HPI YoY
- ▼ -97.98%
- Current HPI
- 205.62
- Rent YoY
- ▲ 6.72%
- Metro
- Evansville, IN-KY
- State GDP YoY
- ▲ 2.90%
- F500 in state
- 18
Industry mix (Fortune 500 HQ in IN)
| Industry | F500 HQs | Revenue |
|---|---|---|
| Industrial Machinery | 2 | $37B |
|
||
| Healthcare | 1 | $177B |
|
||
| Pharmaceuticals | 1 | $45B |
|
||
| Metals / Steel | 1 | $18B |
|
||
| Agriculture | 1 | $17B |
|
||
| Packaging | 1 | $12B |
|
||
Price history
1 event — show timeline
- 2026-05-25 Listed $75,000 FSBO.com
Cash-flow waterfall
monthlySold comps — $/sqft
last 12 mo · ≤1 miLoading sold comps…