 🏗️ New Construction
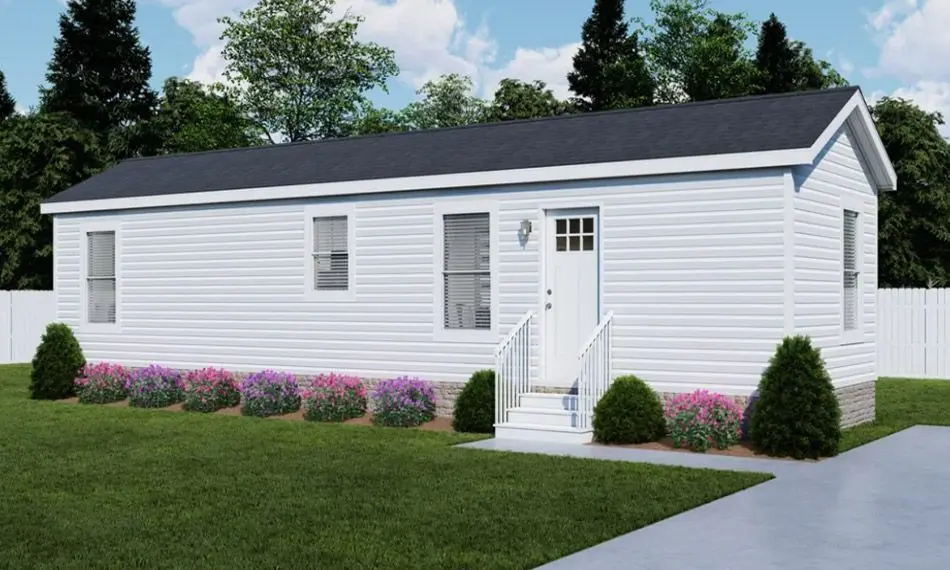
Bayridge Plan · Cleveland, OH
Flood risk No data
- FEMA flood zone
- —
- Chance of flooding over 30 yrs
- —
- Est. flood insurance / yr
- —
Fire risk No data
- Est. fire insurance / yr
- —
Heat risk No data
- Hot days now (above threshold)
- —
- Hot days in 30 yrs
- —
Wind risk No data
- Chance of severe wind over 30 yrs
- —
Air-quality risk No data
- Unhealthy air days now
- —
- Unhealthy air days in 30 yrs
- —
Risk factors via First Street. Map © Google.
Why this score? — see what drove the B grade
The composite is a weighted blend of 9 inputs, each scored 0–100. Each bar is that input's sub-score; the figure is the points it added to the 100-point composite (weight × sub-score).
- Cash flow +30.0/30.0
- 1% rule +10.0/10.0
- DSCR +10.0/10.0
- ARV discount +7.5/15.0
- Schools +5.0/10.0
- Livability +3.6/5.0
- Rent growth +3.2/5.0
- Condition / age +2.2/5.0
- Appreciation +0.0/10.0
$67,900
🖨 Deal sheet 📄 Offer letter ✓ Due diligence
Key facts
- Listed 874 days
Neighborhood map
What this means for you Summary
Snapshot
- This is a 2-bed/1.0-bath manufactured listed at $68k. Condition is rated fair.
Deal economics
- At list price, monthly cash flow is $528 ($6k/yr) — positive.
- The deal already cash-flows at list — no discount required.
- Meets the 1% rule at list price ($1k rent vs $68k).
- Recommended offer: $60k (12.0% below list) — sets the bar for market timing.
- Cap rate 15.6% vs local median 3.6% in Cleveland — top-decile yield for the area; either an underpriced asset or a hidden risk that comps aren't pricing in. Stress-test before assuming the spread holds.
Location & tenants
- Location reads 71/100 on livability (#403 in OH) — a middle-class / working-renter tenant base. Strengths: amenities A+, cost of living A+, housing A+; Watch: schools D-, crime F, employment F.
- Market conditions: Rents rising (+2.7%/yr); 151 active listings in the ZIP; 8 comparable units currently listed for rent nearby; rentals leasing fast (median 4d on market — plan ~1-2 weeks tenant-placement turnaround); 1,441 units permitted in Cuyahoga County in 2024 (700 in 5+ unit buildings).
Forward outlook
- Local home prices are declining (-3.0%/yr); year-one equity from $469 of loan paydown is wiped out by about $2k of value loss. Plan a longer hold.
- Cuyahoga County population projected to shrink 8% by 2050 — rents likely to lag national; underwrite the cash flow, not the appreciation.
- At projected returns (-3.0% appreciation + 2.7% rent growth), your $19k cash investment doubles in ~4 years — after that, you're playing with house money.
Negotiation context
- It's been on market 874 days — a 12% lower offer ($60k) is reasonable based on typical stale-listing flexibility.
Questions for the listing agent
- It's been on market 874 days. Have you received any prior offers? Is the seller open to a 12% concession, seller financing, or rate buy-down credit?
- Have any recent inspections been done? Can we get a copy of the seller's disclosures and any deferred-maintenance estimates?
- Why hasn't it sold? Are there any deal-killer items the seller is aware of (foundation, flood, title, zoning, code violations)?
- Is there a deadline driving the sale (1031 exchange, divorce, estate, relocation)? That informs how much negotiation room exists.
- Schools are D-rated, which usually means shorter tenancies and higher turnover. Who's the typical renter profile here, and what's been the actual vacancy rate?
- Crime grade is F in this area — have there been break-ins, vandalism, or insurance claims at this property in the last 3 years? What carrier currently insures it and at what premium?
- What's the average days-on-market for RENTAL listings here right now (not sales)? A rising rental-DOM trend means longer vacancies and softer asking-rent achievability than the comps imply.
- What's the recent tenant-quality profile in this submarket — average credit score on applications, eviction rate, late-payment / NSF rate, and stable-employment percentage? A property-management company in the area should have these aggregated.
- How much new for-sale + rental construction is in the pipeline within 1–3 miles? Heavy new supply typically softens prices + rents 12–24 months out; constrained supply supports both.
Investment metrics
- 1% rule
- 1.86% ✓
- Cap rate
- 15.62%
- Cash-on-cash
- 33.32%
- DSCR
- 2.48
- GRM
- 4.5
CMA / ARV
No comps found within radius.
Projected returns pro-forma
-3.0% appreciation · 2.69% rent growth · sell at horizon
- IRR
- 28.2%
- Equity multiple
- 2.17×
- Total profit
- $22,248
- Equity at exit
- $10,124
- IRR
- 35.5%
- Equity multiple
- 4.22×
- Total profit
- $61,147
- Equity at exit
- $5,871
Cash invested: $19,012 (down + closing). Projections, not guarantees.
Landlord ↔ Tenant lean methodology
- Overall (STATE)
- 73 Landlord-Friendly
- State Ohio
- 73 Landlord-Friendly · R+6
- County
- — inherits STATE
- City
- — inherits STATE
ZIP-level market 44130
- Rents YoY
- 2.7%
- Active inventory
- 151
- Price-to-rent
- 4.5×
Monthly cashflow live
- Estimated rent
- $1,262 high interval (Pro) →
- Mortgage (P&I)
- −$356
- Tax est. 1.5%
- −$85 /mo · $1,018/yr
- Insurance
- −$28
- HOA
- −$0
- Vacancy / Maint / Mgmt
- −$265
- Net cashflow
- $528
Break-even live
UW: 25.0% down · 7.5% · 30yr · 1.5% tax · 5.0% vac · 8.0% maint · 8.0% mgmt
Financing live
Cash to close
- Down payment
- $16,975
- Closing costs
- $2,037
- Reserves months
- —
- Total cash needed
- —
Loan-product check · same deal, 3 products live
Conventional
25% down · 7.5% · 30yr
- Down + closing
- —
- Monthly P&I
- —
- Monthly cashflow
- —
- DSCR
- —
- Eligible?
- —
Personal DTI + credit; lowest rate.
DSCR
20% down · 8.5% · 30yr
- Down + closing
- —
- Monthly P&I
- —
- Monthly cashflow
- —
- DSCR
- —
- Eligible?
- —
No personal income docs; deal must DSCR.
Hard money
10% down · 12.0% · 12mo
- Down + closing
- —
- Monthly P&I
- —
- Monthly cashflow
- —
- DSCR
- —
- Eligible?
- —
Short-term bridge; refi at stabilization.
Rent comps 8 comps
| Address | Beds | Baths | Sqft | Rent | $/sqft | DOM | Units | Dist |
|---|---|---|---|---|---|---|---|---|
| 5253 Hauserman Rd Parma, OH | 1.0–2.0 | 1.0 | 755 | $1,150 | $1.52 | 4d | 3 | 0.67mi |
| 5691 Chevrolet Blvd Parma, OH | 1.0–2.0 | 1.0 | 700 | $995 | $1.42 | 43d | 1 | 0.73mi |
| 9755 Westview Dr Parma, OH | 2.0 | 1.0 | 625 | $985 | $1.58 | 21d | 1 | 0.94mi |
| 5930 Stumph Rd Cleveland, OH | 1.0–2.0 | 1.0–2.0 | 905 | $1,470 | $1.62 | 1d | 9 | 1.13mi |
| 9703 Snow Rd Cleveland, OH | 3.0 | 1.0 | 1103 | $1,675 | $1.52 | 2d | 1 | 1.28mi |
| 11540 Apache Dr Parma Heights, OH | 2.0–3.0 | 1.0–2.0 | 1232 | $1,545 | $1.25 | 1d | 23 | 1.29mi |
| 6040 Stumph Rd Cleveland, OH | 2.0–3.0 | 1.0–1.5 | 981 | $895 | $0.91 | 43d | 1 | 1.36mi |
| 6128 Stumph Rd Cleveland, OH | 2.0 | 2.0 | 1075 | $1,832 | $1.70 | 1d | 8 | 1.44mi |
Listing history 14 events
-
2026-06-18days on market $67,900 Active 874 DOM
-
2026-06-17days on market $67,900 Active 873 DOM
-
2026-06-16days on market $67,900 Active 872 DOM
-
2026-06-15days on market $67,900 Active 871 DOM
-
2026-06-13days on market $67,900 Active 869 DOM
-
2026-06-13days on market $67,900 Active 868 DOM
-
2026-06-09days on market $67,900 Active 865 DOM
-
2026-06-08days on market $67,900 Active 864 DOM
-
2026-06-07days on market $67,900 Active 863 DOM
-
2026-06-03days on market $67,900 Active 859 DOM
-
2026-06-02days on market $67,900 Active 858 DOM
-
2026-06-01days on market $67,900 Active 857 DOM
-
2026-05-31days on market $67,900 Active 856 DOM
-
2024-01-26$67,900 Active
ⓘ Source: listings_history table (triggers on properties + properties_extension) + one-shot
backfill from property_details.listing_events for pre-trigger history.
Nearby sold comps map
Loading sold comps map…
Walkable amenities ~0.75 mi
Loading nearby amenities…
Taxation est. · year 1
- Rental income
- $15,147
- − Mortgage interest
- −$3,803
- − Property taxes
- −$1,018
- − Insurance
- −$340
- − Repairs & maintenance
- −$1,212
- − Management
- −$1,212
- − Depreciation
- −$1,975
- Taxable income
- $5,587
- Est. tax owed @ 24.0%
- −$1,341
- After-tax cash flow
- $4,994/yr
For passive investors: Depreciation is non-cash, so a rental often shows a tax loss while cash-flowing — sheltering income. Rental losses are passive: they offset passive income freely, and up to $25,000/yr can offset ordinary (W-2) income if you actively participate and your MAGI is under $100k (phasing out to $0 by $150k); unused losses carry forward. On sale, claimed depreciation is recaptured at up to 25%, and gains may owe capital-gains tax (a 1031 exchange can defer both). Figures are a year-1 estimate at your 24.0% rate — not tax advice; consult a CPA.
Condition & rehab AI · 3 photos
The home requires cosmetic repairs to its exterior, including repainting and siding repair, to improve its curb appeal and value.
Repairs flagged
- Major exterior siding — Significant wear and tear
- Major exterior paint — Weathered and faded
Value-add opportunities
- Both paint exterior — Enhances curb appeal and value
- Both repair siding — Improves structural integrity and appearance
Renovation cost estimate screening
| Repair item | Severity | Est. cost |
|---|---|---|
| exterior siding · Significant wear and tear | Major | $15,000–50,000 |
| exterior paint · Weathered and faded | Major | $15,000–50,000 |
| Total estimated repair cost · 2 items | $30,000–100,000 |
Value-add ROI direction
- Both paint exterior — Enhances curb appeal and value ↑
- Both repair siding — Improves structural integrity and appearance ↑
ⓘ Cost ranges are severity-bucket heuristics (US national rule-of-thumb). Get contractor quotes + a written scope before underwriting a rehab budget.
Schools (NCES district)
No district data.
Livability — Cleveland
- Score
- 71/100
- State rank
- #403
- US rank
- #6673
Category grades
Schools grade is shown separately in the Schools card above.
Census & demographics
- Census place
- Cleveland, OH
- County
- Cuyahoga County · 1,090,369 people
- City population
- 326,883
- Metro
- Cleveland-Elyria, OH
- Population (ZIP)
- 49,679
- Household income
- $69,655
- Rent vs Own
- Severe rent burden
- 1758.0
Population outlook (Cuyahoga County) Hauer SSP2
- Today (2025)
- 1,244,621 people
- By 2030
- 1,230,093 · -1.2%
- By 2040
- 1,189,108 · -4.5%
- By 2050
- 1,145,706 · -7.9%
- By 2075
- 1,076,557 · -13.5%
- By 2100
- 978,987 · -21.3%
Race, ethnicity, and origin ACS 2023
- Neighborhood character
- Predominantly White (78%)
- Race & ethnicity
- White 78% Black 8% Hispanic / Latino 6% Two or more races 6% Asian 4%
- Hispanic origin (detail)
- Mexican 2% Puerto Rican 3%
- Common ancestry
- Romanian 13% Lithuanian 2% Subsaharan African 2%
- Foreign-born
- 10% · Canada, India
- Languages at home
- 85% English-only · Other Indo-European 5% Spanish 3% Russian/Polish/Slavic 2%
Political lean MEDSL · Cuyahoga
- 2024 margin
- Solid D (+31.5) · D 65.4% · R 33.9%
- 2008→2024 swing
- -7.4pp toward R · 2008: 38.9pp · 2024: 31.5pp
- All cycles
- 2024: D+31.5 2020: D+34.1 2016: D+35.0 2012: D+38.7 2008: D+38.9
Not yet ingested
- Civics
- —
Market trends
- HPI YoY
- ▼ -231.10%
- Current HPI
- 188.8415
- Rent YoY
- ▲ 2.69%
- Metro
- Cleveland-Elyria, OH
- State GDP YoY
- ▲ 1.98%
- F500 in state
- 48
Industry mix (Fortune 500 HQ in OH)
| Industry | F500 HQs | Revenue |
|---|---|---|
| Insurance | 3 | $145B |
|
||
| Industrial Machinery | 3 | $49B |
|
||
| Financial Services | 3 | $24B |
|
||
| Consumer Goods | 2 | $93B |
|
||
| Aerospace / Defense | 2 | $47B |
|
||
| Utilities | 2 | $33B |
|
||
Price history
1 event — show timeline
- 2024-01-26 Listed $67,900 Zillow
Cash-flow waterfall
monthlySold comps — $/sqft
last 12 mo · ≤1 miLoading sold comps…