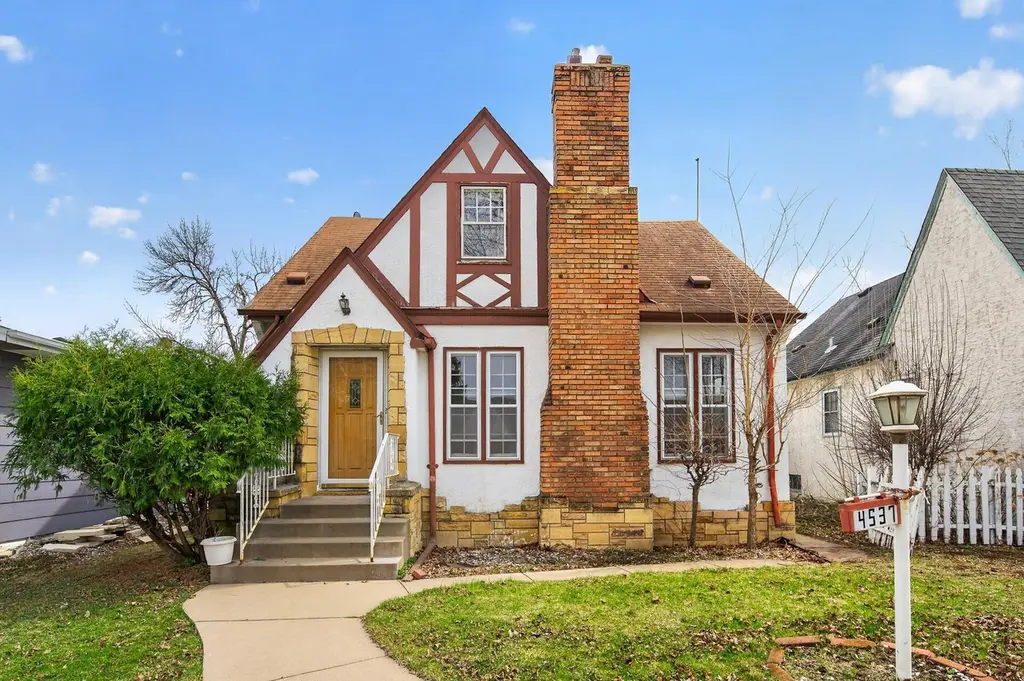
4537 Columbus Ave · Minneapolis, MN
Flood risk 1/10 · Minimal
- FEMA flood zone
- X (unshaded)
- Chance of flooding over 30 yrs
- 0.0%
- Est. flood insurance / yr
- $473 – $860
Fire risk 1/10 · Minimal
- Est. fire insurance / yr
- $888 – $1,650
Heat risk 2/10 · Minimal
- Hot days now (above 100°F)
- 7 days/yr
- Hot days in 30 yrs
- 14 days/yr
Wind risk 2/10 · Minimal
- Chance of severe wind over 30 yrs
- —
Air-quality risk 2/10 · Minimal
- Unhealthy air days now
- 1 days/yr
- Unhealthy air days in 30 yrs
- 1 days/yr
Risk factors via First Street. Map © Google.
Why this score? — see what drove the B- grade
The composite is a weighted blend of 9 inputs, each scored 0–100. Each bar is that input's sub-score; the figure is the points it added to the 100-point composite (weight × sub-score).
- Cash flow +24.0/30.0
- ARV discount +15.0/15.0
- DSCR +7.7/10.0
- 1% rule +7.0/10.0
- Livability +3.9/5.0
- Rent growth +3.6/5.0
- Schools +3.5/10.0
- Condition / age +2.5/5.0
- Appreciation +0.0/10.0
$225,000
🖨 Deal sheet (PDF) 📄 Offer letter ✓ Due diligence
Listing remarks
Welcome to 4537 Columbus Ave! Brimming with classic South Minneapolis character, this charming 4-bedroom, 2-bathroom Tudor-style home is an incredibly rare find. Whether you are a first-time homebuyer looking to bring your vision to life or an investor seeking a profitable project, this property offers a phenomenal opportunity to build instant equity at an unbeatable price point. Inside, you'll find great bones and fantastic potential—including original hardwood floors just waiting to be revealed beneath the main level carpet! With four bedrooms and two baths, there is plenty of space to grow, redesign, and make it your own. The location is truly second to none. Perfectly sandwiched b
Key facts
- 4,791 sq ft lot
- Garage
- Built 1937
Property features AI
Exterior
- Parking: Attached garage (1 car)
- Utilities: City water connected; City sewer connected; Natural gas fuel; Circuit breaker electrical system
- Home design: Residential property; One and one-half levels; Main level finished area present
- Construction: Block foundation; Foundation area 1,010; Above-grade finished area 1,675
- Exterior features: Stucco exterior; Wood fencing; Lot approximately 0.11 acres (123 x 40)
Interior
- Kitchen: Range; Refrigerator; Exhaust fan
- Bedrooms: 5 bedrooms total; Main floor bedroom
- Bathrooms: One full bathroom on the main floor; One three-quarter bathroom in the basement
- Heating & cooling: Forced air heating; No central air
- Interior features: Ceiling fan(s); Kitchen window; Main floor primary bedroom; Has fireplace in the living room; Daylight/lookout windows in basement; Egress window(s) in basement; Full basement; Block foundation in basement
- Laundry & utility: Washer; Dryer; Laundry room on lower level; Utility room on lower level
Neighborhood map
What this means for you Summary
Snapshot
- This is a 5-bed/2.0-bath single-family listed at $225k.
Deal economics
- At list price, monthly cash flow is $439 ($5k/yr) — positive.
- The deal already cash-flows at list — no discount required.
- Meets the 1% rule at list price ($3k rent vs $225k).
- Cap rate 8.6% vs local median 3.1% in Minneapolis — top-decile yield for the area; either an underpriced asset or a hidden risk that comps aren't pricing in. Stress-test before assuming the spread holds.
Location & tenants
- Location reads 78/100 on livability (#110 in MN, #2,525 nationally) — a middle-class / working-renter tenant base. Strengths: amenities A+, commute A+, housing A+; Watch: cost of living C-, crime F.
- Minneapolis Public School District (urban): math 35% / reading 46% proficiency, ranked #217 of 301 in MN (top 72%) — families likely to look elsewhere, expect single-tenant / working-renter base with shorter leases.
- Zoned schools: Hale Elementary (math 87% / reading 77%, grade A+, #8 of 857 statewide, top 1%, 316 students, 15% FRL); Washburn High (math 52% / reading 67%, grade C+, #46 of 471 statewide, top 11%, 1,582 students, 37% FRL) — zoned schools average 26% FRL vs 58% district-wide (32 pts lower); this property's tenant base skews higher-income than the district average.
- Zoned-school proficiency averages 71% at this address vs 40% district-wide (+30 pts) — the actual schools serving this property are materially stronger than the Minneapolis Public School District average implies; a family-tenant draw the district grade alone would hide.
- Market conditions: Rents rising fast (+4.3%/yr); 146 active listings in the ZIP; 2 comparable units currently listed for rent nearby; solid renter incomes; 4,651 units permitted in Hennepin County in 2024 (2,443 in 5+ unit buildings).
- This rent runs 41% of the median local income ($78k/yr) — at the standard rent-burdened threshold; future hikes will face affordability resistance.
Forward outlook
- Local home prices are declining (-3.0%/yr); year-one equity from $2k of loan paydown is wiped out by about $7k of value loss. Plan a longer hold.
- Hennepin County population projected at +30% by 2050 — long-run rental-demand tailwind backs the buy-and-hold thesis.
- At projected returns (-3.0% appreciation + 4.3% rent growth), your $63k cash investment doubles in ~10 years — after that, you're playing with house money.
Negotiation context
- Only 4 days on market — expect competitive offers; lowballing is unlikely to land.
Risks & watch-outs
- Watch-outs: built in 1937 — expect roof / HVAC / electrical / plumbing capex.
Questions for the listing agent
- Built in 1937 — when were the roof, HVAC, electrical panel, plumbing, and water heater last replaced?
- Is there a deadline driving the sale (1031 exchange, divorce, estate, relocation)? That informs how much negotiation room exists.
- Crime grade is F in this area — have there been break-ins, vandalism, or insurance claims at this property in the last 3 years? What carrier currently insures it and at what premium?
- What's the average days-on-market for RENTAL listings here right now (not sales)? A rising rental-DOM trend means longer vacancies and softer asking-rent achievability than the comps imply.
- What's the recent tenant-quality profile in this submarket — average credit score on applications, eviction rate, late-payment / NSF rate, and stable-employment percentage? A property-management company in the area should have these aggregated.
- How much new for-sale + rental construction is in the pipeline within 1–3 miles? Heavy new supply typically softens prices + rents 12–24 months out; constrained supply supports both.
Investment metrics
- 1% rule
- 1.20% ✓
- Cap rate
- 8.64%
- Cash-on-cash
- 8.37%
- DSCR
- 1.37
- GRM
- 6.9
CMA / ARV
- ARV (on-the-fly)
- $379,852
- Comps found
- 1
Show comp detail 1 sale within ~0.75 mi
| Address | Dist | Beds/Ba | Sqft | Sold | Price | $/sf | Match |
|---|---|---|---|---|---|---|---|
| 4136 Portland Ave | 0.54mi | 5/2.0 | 2,193 (+12%) | 14mo | $425,000 | $194 | 43 |
Match score weights: distance 35% · size 25% · config 20% · recency 20%. Top-matched comps best support the ARV.
Projected returns pro-forma
-3.0% appreciation · 4.3% rent growth · sell at horizon
- IRR
- -2.0%
- Equity multiple
- 0.92×
- Total profit
- $-4,757
- Equity at exit
- $33,548
- IRR
- 9.2%
- Equity multiple
- 1.75×
- Total profit
- $47,530
- Equity at exit
- $19,454
Cash invested: $63,000 (down + closing). Projections, not guarantees.
Landlord ↔ Tenant lean methodology
- Overall (CITY)
- 34 Tenant-Leaning
- State Minnesota
- 46 Balanced · D+2
- County
- — inherits STATE
- City Minneapolis
- 34 Tenant-Leaning · D+50
ZIP-level market 55407
- Rents YoY
- 4.3%
- Active inventory
- 146
- Price-to-rent
- 6.9×
Monthly cashflow live
- Estimated rent
- $2,706 medium interval (Pro) →
- Mortgage (P&I)
- −$1,180
- Tax from tax record
- −$425 /mo · $5,099/yr
- Insurance
- −$94
- HOA
- −$0
- Vacancy / Maint / Mgmt
- −$568
- Net cashflow
- $439
Break-even live
Sensitivity live
| Price | -10% $567 | -5% $503 | +0% $439 | +5% $376 | +10% $312 |
|---|---|---|---|---|---|
| Rent | -10% $226 | -5% $333 | +0% $439 | +5% $546 | +10% $653 |
| Rate | -1.0pp $553 | -0.5pp $497 | base $439 | +0.5pp $381 | +1.0pp $322 |
UW: 25.0% down · 7.5% · 30yr · 1.5% tax · 5.0% vac · 8.0% maint · 8.0% mgmt
Financing live
Cash to close
- Down payment
- $56,250
- Closing costs
- $6,750
- Reserves months
- —
- Total cash needed
- —
Loan-product check · same deal, 3 products live
Conventional
25% down · 7.5% · 30yr
- Down + closing
- —
- Monthly P&I
- —
- Monthly cashflow
- —
- DSCR
- —
- Eligible?
- —
Personal DTI + credit; lowest rate.
DSCR
20% down · 8.5% · 30yr
- Down + closing
- —
- Monthly P&I
- —
- Monthly cashflow
- —
- DSCR
- —
- Eligible?
- —
No personal income docs; deal must DSCR.
Hard money
10% down · 12.0% · 12mo
- Down + closing
- —
- Monthly P&I
- —
- Monthly cashflow
- —
- DSCR
- —
- Eligible?
- —
Short-term bridge; refi at stabilization.
Rent comps 2 comps
| Address | Beds | Baths | Sqft | Rent | $/sqft | DOM | Units | Dist |
|---|---|---|---|---|---|---|---|---|
| 4739 1st Ave S Minneapolis, MN | 4.0 | 2.5 | 2500 | $3,250 | $1.30 | 26d | 1 | 0.65mi |
| 3729 2nd Ave S Minneapolis, MN | 5.0 | 2.0 | 1700 | $2,100 | $1.24 | 16d | 1 | 1.14mi |
Listing history 5 events
-
2026-05-22status Pending
-
2026-05-21historical Contingent - Inspection
-
2026-04-20status Pending
-
2026-04-17$225,000 Active
-
2026-04-16historical $225,000
ⓘ Source: listings_history table (triggers on properties + properties_extension) + one-shot
backfill from property_details.listing_events for pre-trigger history.
Tax reassessment forecast MN · Partial reset (capped growth)
- Current annual tax
- $5,099 · $425/mo
- Projected year-2 tax
- $5,099 · $425/mo
- Expected delta
- $0/yr ($0/mo · 0.0%)
ⓘ Screening estimate from a state-policy table — verify with the county assessor before closing.
Climate risk First Street
- Flood 1/10 Low FEMA zone X (unshaded) · 0% chance over 30 yrs
- Wildfire 1/10 Low
- Heat 2/10 Low 7 d/yr ≥100°F today · 14 d/yr by 30 yrs out
- Wind 2/10 Low
- Air quality 2/10 Low 1 unhealthy d/yr today · 1 by 30 yrs out
Nearby sold comps map
Loading sold comps map…
Walkable amenities ~0.75 mi
Loading nearby amenities…
Taxation est. · year 1
- Rental income
- $32,477
- − Mortgage interest
- −$12,603
- − Property taxes
- −$5,099
- − Insurance
- −$1,125
- − Repairs & maintenance
- −$2,598
- − Management
- −$2,598
- − Depreciation
- −$6,545
- Taxable income
- $1,907
- Est. tax owed @ 24.0%
- −$458
- After-tax cash flow
- $4,815/yr
For passive investors: Depreciation is non-cash, so a rental often shows a tax loss while cash-flowing — sheltering income. Rental losses are passive: they offset passive income freely, and up to $25,000/yr can offset ordinary (W-2) income if you actively participate and your MAGI is under $100k (phasing out to $0 by $150k); unused losses carry forward. On sale, claimed depreciation is recaptured at up to 25%, and gains may owe capital-gains tax (a 1031 exchange can defer both). Figures are a year-1 estimate at your 24.0% rate — not tax advice; consult a CPA.
Schools (NCES district)
- District
- Minneapolis Public School District
- NCES district ID
- 2721240
- Math proficiency
- 35% ▼ -7.00%
- Reading proficiency
- 46% ▼ -1.00%
- Median HH income
- $50,521
- Composite
- 34.92/100
- National rank
- #5067
- State rank
- #217 of 301 in MN
Livability — Minneapolis
- Score
- 78/100
- State rank
- #110
- US rank
- #2525
Category grades
Schools grade is shown separately in the Schools card above.
Census & demographics
- Census place
- Minneapolis, MN
- County
- Hennepin County · 1,150,272 people
- City population
- 417,555
- Metro
- Minneapolis-St. Paul-Bloomington, MN-WI
- Population (ZIP)
- 37,667
- Household income
- $78,464
- Rent vs Own
- Severe rent burden
- 1583.0
Population outlook (Hennepin County) Hauer SSP2
- Today (2025)
- 1,405,227 people
- By 2030
- 1,492,650 · +6.2%
- By 2040
- 1,660,157 · +18.1%
- By 2050
- 1,823,498 · +29.8%
- By 2075
- 2,221,283 · +58.1%
- By 2100
- 2,509,976 · +78.6%
Race, ethnicity, and origin ACS 2023
- Neighborhood character
- Diverse neighborhood (Simpson 0.66)
- Race & ethnicity
- White 50% Hispanic / Latino 23% Black 18% Two or more races 10% Asian 2% Native American 2%
- Hispanic origin (detail)
- Mexican 15%
- Common ancestry
- Portuguese 8% Romanian 3% Lithuanian 2%
- Foreign-born
- 18% · Canada, Jamaica
- Languages at home
- 68% English-only · Spanish 20% Other Asian/Pacific 1%
Political lean MEDSL · Hennepin
- 2024 margin
- Solid D (+42.6) · D 70.2% · R 27.5% · Other 2.3%
- 2008→2024 swing
- +14.0pp toward D · 2008: 28.6pp · 2024: 42.6pp
- All cycles
- 2024: D+42.6 2020: D+43.2 2016: D+35.3 2012: D+27.1 2008: D+28.6
Not yet ingested
- Civics
- —
Market trends
- HPI YoY
- ▼ -211.97%
- Current HPI
- 292.0322
- Rent YoY
- ▲ 4.30%
- Metro
- Minneapolis-St. Paul-Bloomington, MN-WI
- State GDP YoY
- ▲ 2.41%
- F500 in state
- 34
Industry mix (Fortune 500 HQ in MN)
| Industry | F500 HQs | Revenue |
|---|---|---|
| Healthcare | 2 | $407B |
|
||
| Retail | 2 | $150B |
|
||
| Consumer Goods | 2 | $32B |
|
||
| Industrial Machinery | 2 | $6B |
|
||
| Agriculture | 1 | $40B |
|
||
| Healthcare / Medical Devices | 1 | $32B |
|
||
Price history
+0.0% since first listed5 events — show timeline
- 2026-05-22 Pending — NORTHSTARMLS as Distributed by MLS Grid
- 2026-05-21 Contingent — NORTHSTARMLS as Distributed by MLS Grid
- 2026-04-20 Pending — NORTHSTARMLS as Distributed by MLS Grid
- 2026-04-17 Listed $225,000 NORTHSTARMLS as Distributed by MLS Grid
- 2026-04-16 Coming Soon $225,000 NORTHSTARMLS as Distributed by MLS Grid
Property tax history
+2.5%/yrLatest (2025): $5,099 · +7.1% YoY. Source: county tax records.
Cash-flow waterfall
monthlySold comps — $/sqft
last 12 mo · ≤1 miLoading sold comps…