463 San Miguel Creek Dr · Katy, TX
Flood risk No data
- FEMA flood zone
- —
- Chance of flooding over 30 yrs
- —
- Est. flood insurance / yr
- —
Fire risk No data
- Est. fire insurance / yr
- —
Heat risk No data
- Hot days now (above threshold)
- —
- Hot days in 30 yrs
- —
Wind risk No data
- Chance of severe wind over 30 yrs
- —
Air-quality risk No data
- Unhealthy air days now
- —
- Unhealthy air days in 30 yrs
- —
Risk factors via First Street. Map © Google.
Why this score? — see what drove the F grade
The composite is a weighted blend of 9 inputs, each scored 0–100. Each bar is that input's sub-score; the figure is the points it added to the 100-point composite (weight × sub-score).
- Cash flow +8.8/30.0
- ARV discount +7.5/15.0
- Livability +3.8/5.0
- 1% rule +2.8/10.0
- Condition / age +2.5/5.0
- DSCR +2.4/10.0
- Rent growth +2.3/5.0
- Schools +2.0/10.0
- Appreciation +0.0/10.0
$311,990
🖨 Deal sheet 📄 Offer letter ✓ Due diligence
Listing remarks MLS
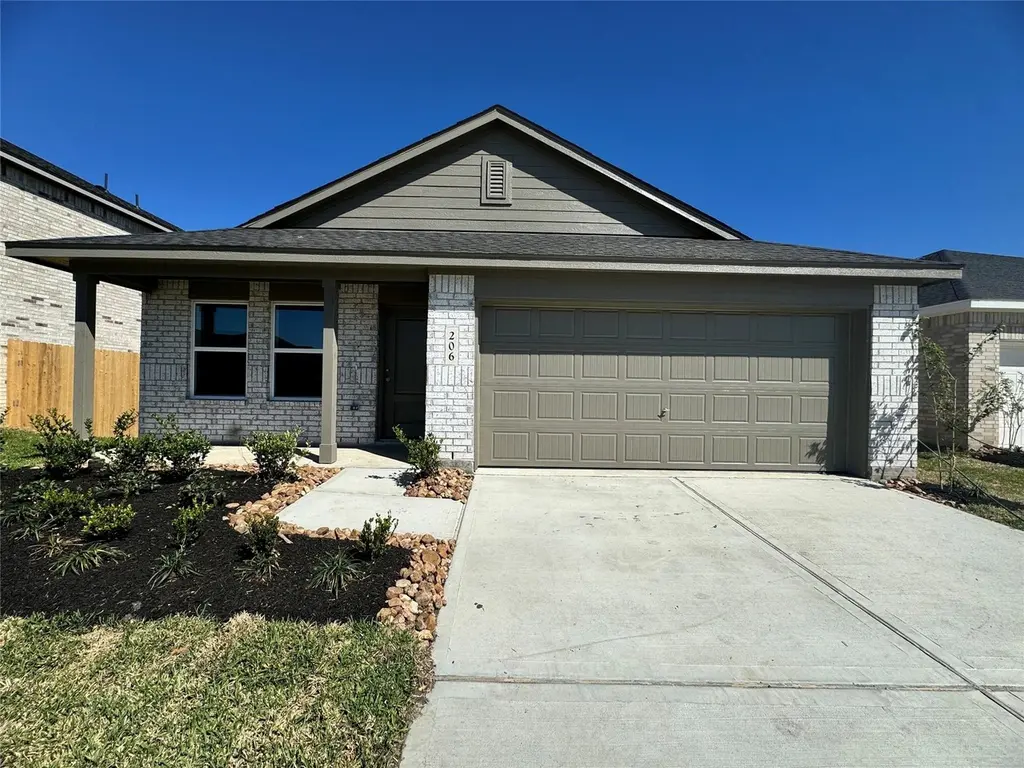
NEW! Lennar Core Watermill Collection "Oxford" Plan with Brick Elevation "J3" in Freeman Ranch! This single-level home showcases a spacious open floorplan shared between the kitchen, dining area and family room for easy entertaining. An owner’s suite enjoys a private location in a rear corner of the home, complemented by an en-suite bathroom and walk-in closet. There are three secondary bedrooms at the front of the home, which are comfortable spaces for household members and overnight guests.
Key facts
- Walk-in closet
- Open floorplan
- Secondary bedrooms
Tags
Neighborhood map
What this means for you Summary
Snapshot
- This is a 4-bed/2.0-bath land listed at $312k.
Deal economics
- At list price, monthly cash flow is $-256 ($-3k/yr) — negative.
- To cash-flow at today's rent, offer at most $275k (11.9% below list).
- To meet the 1% rule (rent ≥ 1% of price), the offer needs to be $245k (21.6% below list).
- Recommended offer: $245k (21.6% below list) — sets the bar for 1% rule.
- Cap rate 5.3% vs local median 3.0% in Katy — top-decile yield for the area; either an underpriced asset or a hidden risk that comps aren't pricing in. Stress-test before assuming the spread holds.
Location & tenants
- Location reads 76/100 on livability (#111 in TX, #3,613 nationally) — a middle-class / working-renter tenant base. Strengths: employment A+, cost of living A+, housing A+; Watch: crime C-, amenities D, commute F.
- Royal ISD (rural): math 23% / reading 23% proficiency, ranked #744 of 826 in TX (top 90%) — low school quality limits family demand, transient renter base, plan for 1-2y turnover; 77% free/reduced lunch — lower-income household profile, screen leases tightly.
- Market conditions: Rents soft (-0.8%/yr); 2696 active listings in the ZIP; 26 comparable units currently listed for rent nearby; rentals at typical pace (median 24d on market — plan ~3-4 weeks tenant-placement turnaround); high-income renter base; 483 units permitted in Waller County in 2024 (89 in 5+ unit buildings).
Forward outlook
- Local home prices are declining (-3.0%/yr); year-one equity from $2k of loan paydown is wiped out by about $9k of value loss. Plan a longer hold.
- Waller County population projected at +62% by 2050 — long-run rental-demand tailwind backs the buy-and-hold thesis.
Negotiation context
- It's been on market 20 days — a 2% lower offer ($307k) is reasonable based on typical stale-listing flexibility.
Questions for the listing agent
- What do current leases actually rent for vs. the listed asking? Can we see a recent rent roll and the last 12 months of T-12 income?
- What does the HOA fee cover, when was the last increase, and are there any pending special assessments or reserve-fund shortfalls?
- Is there a deadline driving the sale (1031 exchange, divorce, estate, relocation)? That informs how much negotiation room exists.
- Schools are B-rated — typically a magnet for longer-tenancy family renters. What's the average tenant stay here, and is there a school-zone premium baked into asking?
- The area grade is low — what's the realistic commute time and amenity access for the typical tenant pool here? Any planned neighborhood developments (good or bad) we should know about?
- What's the average days-on-market for RENTAL listings here right now (not sales)? A rising rental-DOM trend means longer vacancies and softer asking-rent achievability than the comps imply.
- What's the recent tenant-quality profile in this submarket — average credit score on applications, eviction rate, late-payment / NSF rate, and stable-employment percentage? A property-management company in the area should have these aggregated.
- How much new for-sale + rental construction is in the pipeline within 1–3 miles? Heavy new supply typically softens prices + rents 12–24 months out; constrained supply supports both.
Investment metrics
- 1% rule
- 0.78% ✗
- Cap rate
- 5.31%
- Cash-on-cash
- -3.51%
- DSCR
- 0.84
- GRM
- 10.6
CMA / ARV
No comps found within radius.
Projected returns pro-forma
-3.0% appreciation · 0.0% rent growth · sell at horizon
- IRR
- -25.6%
- Equity multiple
- 0.15×
- Total profit
- $-73,954
- Equity at exit
- $46,519
- IRR
- -35.8%
- Equity multiple
- -0.29×
- Total profit
- $-112,851
- Equity at exit
- $26,975
Cash invested: $87,357 (down + closing). Projections, not guarantees.
Landlord ↔ Tenant lean methodology
- Overall (STATE)
- 87 Strongly Landlord-Friendly
- State Texas
- 87 Strongly Landlord-Friendly · R+5
- County
- — inherits STATE
- City
- — inherits STATE
ZIP-level market 77493
- Rents YoY
- -0.8%
- Active inventory
- 2696
- Price-to-rent
- 10.6×
Monthly cashflow live
- Estimated rent
- $2,447 high interval (Pro) →
- Mortgage (P&I)
- −$1,636
- Tax est. 1.5%
- −$390 /mo · $4,680/yr
- Insurance
- −$130
- HOA
- −$33
- Vacancy / Maint / Mgmt
- −$514
- Net cashflow
- $-256
Break-even live
UW: 25.0% down · 7.5% · 30yr · 1.5% tax · 5.0% vac · 8.0% maint · 8.0% mgmt
Financing live
Cash to close
- Down payment
- $77,998
- Closing costs
- $9,360
- Reserves months
- —
- Total cash needed
- —
Loan-product check · same deal, 3 products live
Conventional
25% down · 7.5% · 30yr
- Down + closing
- —
- Monthly P&I
- —
- Monthly cashflow
- —
- DSCR
- —
- Eligible?
- —
Personal DTI + credit; lowest rate.
DSCR
20% down · 8.5% · 30yr
- Down + closing
- —
- Monthly P&I
- —
- Monthly cashflow
- —
- DSCR
- —
- Eligible?
- —
No personal income docs; deal must DSCR.
Hard money
10% down · 12.0% · 12mo
- Down + closing
- —
- Monthly P&I
- —
- Monthly cashflow
- —
- DSCR
- —
- Eligible?
- —
Short-term bridge; refi at stabilization.
Rent comps 26 comps
| Address | Beds | Baths | Sqft | Rent | $/sqft | DOM | Units | Dist |
|---|---|---|---|---|---|---|---|---|
| 401 San Miguel Creek Dr Katy, TX | 3.0 | 2.0 | 1579 | $1,945 | $1.23 | 3d | 1 | 0.16mi |
| 435 Lone Rider Dr Katy, TX | 3.0 | 2.0 | 1350 | $1,895 | $1.40 | 43d | 1 | 0.16mi |
| 452 Texas Pecan Dr Katy, TX | 3.0 | 2.0 | 1522 | $1,995 | $1.31 | 24d | 1 | 0.26mi |
| 116 Thorton Vine Dr Katy, TX | 3.0 | 2.0 | 1621 | $1,929 | $1.19 | 2d | 1 | 0.85mi |
| 3004 Majestic Sunrise Dr Katy, TX | 3.0 | 2.0 | 1474 | $1,942 | $1.32 | 43d | 1 | 1.00mi |
| 3037 Wild Dunes Dr Katy, TX | 3.0 | 2.0 | 1538 | $2,164 | $1.41 | 24d | 1 | 1.05mi |
| 3048 Majestic Sunrise Dr Katy, TX | 4.0 | 2.0 | 1670 | $2,275 | $1.36 | 24d | 1 | 1.06mi |
| 3020 Wild Dunes Dr Katy, TX | 4.0 | 2.0 | 1776 | $2,355 | $1.33 | 12d | 1 | 1.07mi |
| 3057 Majestic Sunrise Dr Katy, TX | 4.0 | 2.0 | 1644 | $2,252 | $1.37 | 24d | 1 | 1.08mi |
| 3112 Wild Dunes Dr Katy, TX | 4.0 | 2.0 | 1776 | $2,330 | $1.31 | 24d | 1 | 1.10mi |
| 3124 Wild Dunes Dr Katy, TX | 4.0 | 2.0 | 1776 | $2,330 | $1.31 | 24d | 1 | 1.12mi |
| 3136 Wild Dunes Dr Katy, TX | 4.0 | 2.0 | 1776 | $2,355 | $1.33 | 12d | 1 | 1.13mi |
| 3071 Wild Dunes Dr Katy, TX | 3.0 | 2.0 | 1538 | $2,164 | $1.41 | 24d | 1 | 1.13mi |
| 3041 Colusa Ridge Dr Katy, TX | 4.0 | 2.5 | 2263 | $2,500 | $1.10 | 12d | 1 | 1.14mi |
| 3083 Wild Dunes Dr Katy, TX | 3.0 | 2.0 | 1538 | $2,185 | $1.42 | 12d | 1 | 1.15mi |
| 3004 Fall Gold Ln Katy, TX | 5.0 | 3.0 | 2156 | $3,850 | $1.79 | 43d | 1 | 1.22mi |
| 3004 Fall Gold Ln Katy, TX | 5.0 | 3.0 | 2156 | $2,762 | $1.28 | 10d | 1 | 1.22mi |
| 3104 Nori Shores Dr Katy, TX | 5.0 | 2.5 | 1947 | $3,695 | $1.90 | 3d | 1 | 1.30mi |
| 3056 Sea Turtle Dr Katy, TX | 4.0 | 2.0 | 1500 | $2,200 | $1.47 | 43d | 1 | 1.33mi |
| 3064 Dawn Sound Dr Katy, TX | 3.0 | 2.0 | 1464 | $1,950 | $1.33 | 43d | 1 | 1.35mi |
| 3053 Fantasy Terrace Dr Katy, TX | 4.0 | 2.0 | 2085 | $2,440 | $1.17 | 15d | 1 | 1.38mi |
| 3076 Dylan Skyland Dr Katy, TX | 4.0 | 2.5 | 2240 | $3,395 | $1.52 | 24d | 1 | 1.40mi |
| 3072 Fantasy Terrace Dr Katy, TX | 4.0 | 2.0 | 2279 | $2,550 | $1.12 | 22d | 1 | 1.42mi |
| 3081 Fantasy Terrace Dr Katy, TX | 4.0 | 2.0 | 1670 | $2,275 | $1.36 | 24d | 1 | 1.43mi |
| 3084 Fantasy Terrace Dr Katy, TX | 4.0 | 2.0 | 2085 | $2,325 | $1.12 | 12d | 1 | 1.44mi |
| 3020 Nori Shores Dr Katy, TX | 5.0 | 2.5 | 2408 | $3,995 | $1.66 | 24d | 1 | 1.46mi |
HOA detail
- Monthly dues
- $33 · $396/yr
- Likely covers
- water
Listing history 6 events
-
2026-05-11status Pending 524-char remark
Show marketing remark (524 chars)
NEW! Lennar Core Watermill Collection "Oxford" Plan with Brick Elevation "J3" in Freeman Ranch! This single-level home showcases a spacious open floorplan shared between the kitchen, dining area and family room for easy entertaining. An owner’s suite enjoys a private location in a rear corner of the home, complemented by an en-suite bathroom and walk-in closet. There are three secondary bedrooms at the front of the home, which are comfortable spaces for household members and overnight guests.
-
2026-05-11price $311,990 524-char remark
Show marketing remark (524 chars)
NEW! Lennar Core Watermill Collection "Oxford" Plan with Brick Elevation "J3" in Freeman Ranch! This single-level home showcases a spacious open floorplan shared between the kitchen, dining area and family room for easy entertaining. An owner’s suite enjoys a private location in a rear corner of the home, complemented by an en-suite bathroom and walk-in closet. There are three secondary bedrooms at the front of the home, which are comfortable spaces for household members and overnight guests.
-
2026-05-07price $252,290 524-char remark
Show marketing remark (524 chars)
NEW! Lennar Core Watermill Collection "Oxford" Plan with Brick Elevation "J3" in Freeman Ranch! This single-level home showcases a spacious open floorplan shared between the kitchen, dining area and family room for easy entertaining. An owner’s suite enjoys a private location in a rear corner of the home, complemented by an en-suite bathroom and walk-in closet. There are three secondary bedrooms at the front of the home, which are comfortable spaces for household members and overnight guests.
-
2026-05-04price $256,690 524-char remark
Show marketing remark (524 chars)
NEW! Lennar Core Watermill Collection "Oxford" Plan with Brick Elevation "J3" in Freeman Ranch! This single-level home showcases a spacious open floorplan shared between the kitchen, dining area and family room for easy entertaining. An owner’s suite enjoys a private location in a rear corner of the home, complemented by an en-suite bathroom and walk-in closet. There are three secondary bedrooms at the front of the home, which are comfortable spaces for household members and overnight guests.
-
2026-04-27price $265,390 524-char remark
Show marketing remark (524 chars)
NEW! Lennar Core Watermill Collection "Oxford" Plan with Brick Elevation "J3" in Freeman Ranch! This single-level home showcases a spacious open floorplan shared between the kitchen, dining area and family room for easy entertaining. An owner’s suite enjoys a private location in a rear corner of the home, complemented by an en-suite bathroom and walk-in closet. There are three secondary bedrooms at the front of the home, which are comfortable spaces for household members and overnight guests.
-
2026-04-21$273,990 Active 524-char remark
Show marketing remark (524 chars)
NEW! Lennar Core Watermill Collection "Oxford" Plan with Brick Elevation "J3" in Freeman Ranch! This single-level home showcases a spacious open floorplan shared between the kitchen, dining area and family room for easy entertaining. An owner’s suite enjoys a private location in a rear corner of the home, complemented by an en-suite bathroom and walk-in closet. There are three secondary bedrooms at the front of the home, which are comfortable spaces for household members and overnight guests.
ⓘ Source: listings_history table (triggers on properties + properties_extension) + one-shot
backfill from property_details.listing_events for pre-trigger history.
Nearby sold comps map
Loading sold comps map…
Walkable amenities ~0.75 mi
Loading nearby amenities…
Taxation est. · year 1
- Rental income
- $29,369
- − Mortgage interest
- −$17,476
- − Property taxes
- −$4,680
- − Insurance
- −$1,560
- − Repairs & maintenance
- −$2,349
- − Management
- −$2,349
- − HOA
- −$396
- − Depreciation
- −$9,076
- Taxable loss
- −$8,519
- Est. tax savings @ 24.0%
- +$2,044
- After-tax cash flow
- $-1,023/yr
For passive investors: Depreciation is non-cash, so a rental often shows a tax loss while cash-flowing — sheltering income. Rental losses are passive: they offset passive income freely, and up to $25,000/yr can offset ordinary (W-2) income if you actively participate and your MAGI is under $100k (phasing out to $0 by $150k); unused losses carry forward. On sale, claimed depreciation is recaptured at up to 25%, and gains may owe capital-gains tax (a 1031 exchange can defer both). Figures are a year-1 estimate at your 24.0% rate — not tax advice; consult a CPA.
Schools (NCES district)
- District
- Royal ISD
- NCES district ID
- 4838190
- Math proficiency
- 23% ▼ -11.00%
- Reading proficiency
- 23% ▼ -6.00%
- Median HH income
- $41,059
- Composite
- 19.55/100
- National rank
- #8760
- State rank
- #744 of 826 in TX
Livability — Katy
- Score
- 76/100
- State rank
- #111
- US rank
- #3613
Category grades
Schools grade is shown separately in the Schools card above.
Census & demographics
- County
- Harris County · 4,702,590 people
- City population
- 413,575
- Metro
- Houston-The Woodlands-Sugar Land, TX
- Population (ZIP)
- 71,484
- Household income
- $118,464
- Rent vs Own
- Severe rent burden
- 913.0
Population outlook (Waller County) Hauer SSP2
- Today (2025)
- 60,772 people
- By 2030
- 67,616 · +11.3%
- By 2040
- 82,283 · +35.4%
- By 2050
- 98,276 · +61.7%
- By 2075
- 142,860 · +135.1%
- By 2100
- 175,596 · +188.9%
Race, ethnicity, and origin ACS 2023
- Neighborhood character
- Highly diverse neighborhood (Simpson 0.73)
- Race & ethnicity
- White 36% Hispanic / Latino 33% Two or more races 16% Black 15% Asian 12%
- Hispanic origin (detail)
- Mexican 20%
- Common ancestry
- Lithuanian 2% Slovak 1% Italian 1%
- Foreign-born
- 21% · Canada, Vietnam, Jamaica
- Languages at home
- 64% English-only · Spanish 22% Vietnamese 5% French/Haitian/Cajun 4%
Political lean MEDSL · Waller
- 2024 margin
- Strong R (+25.0) · D 37.0% · R 62.0% · Other 1.0%
- 2008→2024 swing
- -17.9pp toward R · 2008: -7.2pp · 2024: -25.0pp
- All cycles
- 2024: R+25.0 2020: R+26.7 2016: R+28.6 2012: R+17.6 2008: R+7.2
Not yet ingested
- Civics
- —
Market trends
- HPI YoY
- ▼ -140.65%
- Current HPI
- 233.1683
- Rent YoY
- ▼ -0.80%
- Metro
- Houston-The Woodlands-Sugar Land, TX
- State GDP YoY
- ▲ 3.95%
- F500 in state
- 110
Industry mix (Fortune 500 HQ in TX)
| Industry | F500 HQs | Revenue |
|---|---|---|
| Energy | 16 | $1,198B |
|
||
| Technology | 5 | $198B |
|
||
| Engineering / Construction | 4 | $72B |
|
||
| Energy Services | 3 | $60B |
|
||
| Utilities | 3 | $41B |
|
||
| Healthcare | 2 | $330B |
|
||
Price history
+13.9% since first listed6 events — show timeline
- 2026-05-11 Pending — HARMLS
- 2026-05-11 Price Changed $311,990 HARMLS
- 2026-05-07 Price Changed $252,290 HARMLS
- 2026-05-04 Price Changed $256,690 HARMLS
- 2026-04-27 Price Changed $265,390 HARMLS
- 2026-04-21 Listed $273,990 HARMLS
Property tax history
+20.9%/yrLatest (2025): $588 · +20.9% YoY. Source: county tax records.
Cash-flow waterfall
monthlySold comps — $/sqft
last 12 mo · ≤1 miLoading sold comps…