 Multi-family
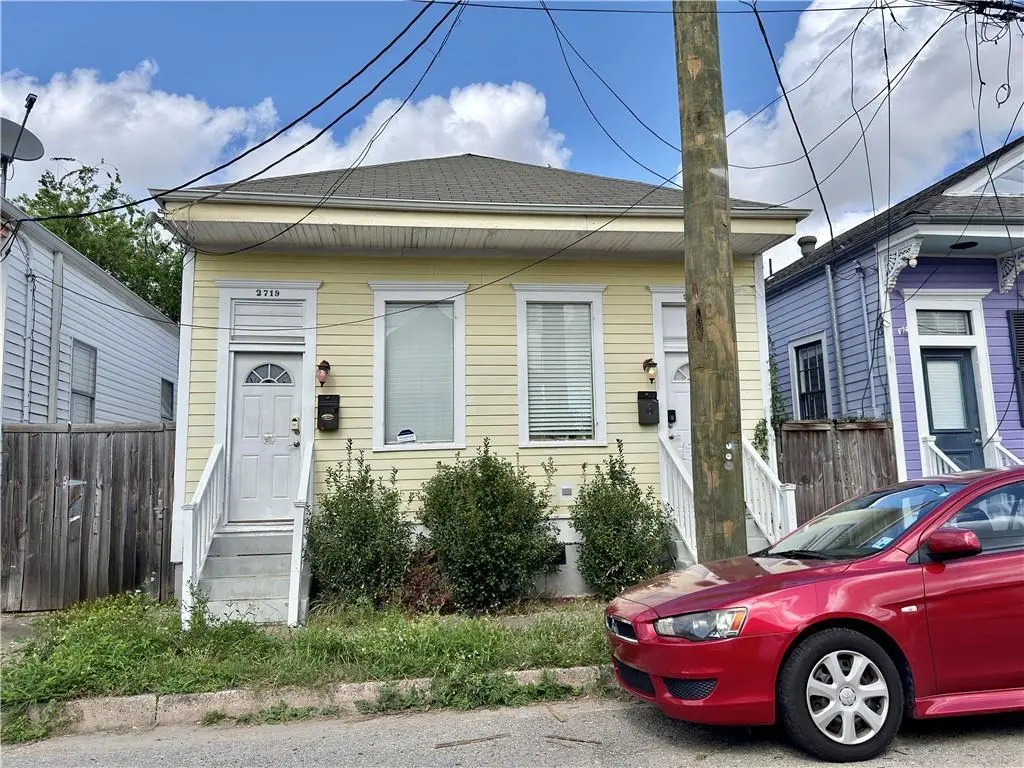
2717 21 2nd St · New Orleans, LA
Flood risk 8/10 · Major
- FEMA flood zone
- X (shaded)
- Chance of flooding over 30 yrs
- 0.6%
- Est. flood insurance / yr
- $507 – $1,088
Fire risk 1/10 · Minimal
- Est. fire insurance / yr
- $1,269 – $2,357
Heat risk 10/10 · Severe
- Hot days now (above 108°F)
- 7 days/yr
- Hot days in 30 yrs
- 21 days/yr
Wind risk 10/10 · Severe
- Chance of severe wind over 30 yrs
- 99.0%
Air-quality risk 3/10 · Minor
- Unhealthy air days now
- 3 days/yr
- Unhealthy air days in 30 yrs
- 4 days/yr
Risk factors via First Street. Map © Google.
Why this score? — see what drove the A grade
The composite is a weighted blend of 9 inputs, each scored 0–100. Each bar is that input's sub-score; the figure is the points it added to the 100-point composite (weight × sub-score).
- Cash flow +30.0/30.0
- ARV discount +15.0/15.0
- DSCR +10.0/10.0
- Appreciation +10.0/10.0
- 1% rule +8.3/10.0
- Rent growth +4.0/5.0
- Livability +4.0/5.0
- Condition / age +2.5/5.0
- Schools +1.6/10.0
$189,000
🖨 Deal sheet 📄 Offer letter ✓ Due diligence
Multi-family units
County records classify this as Multi-Family (2-4 Unit). Listing-text estimate: 1 unit. estimate disagrees with records
Listing remarks
Income-Producing Double with rents of total of $1800.00 or $900.00 on each side. in the Heart of Central City! Looking for a smart investment or a home that helps pay for itself? This well-maintained double in Central City is your answer! Live on one side and let the other unit generate rental income to help cover your monthly payment. Each unit is in great condition, offering comfortable living spaces, separate entrances, and strong income potential. Whether you're a first-time buyer or seasoned investor, this property is a win-win opportunity. Located just minutes from Downtown, public transportation, and local amenities—this is an ideal location for convenience and value. Don't mis
Key facts
- Local amenities
- Separate entrances
- 1,890 sq ft lot
Tags
Property features AI
Finance
- Other: Raised foundation noted; Total of 2 units
- Financial info: Unit 17 currently rents for $900; Unit 19 currently rents for $900
- HOA & community: No HOA information provided
Exterior
- Parking: No parking details provided
- Security: No security details provided
- Utilities: Public water; Public sewer
- Home design: Single-story building; Raised foundation; Multifamily property with 2 total units
- Construction: No year-built or construction material provided
- Exterior features: City lot; Rectangular lot; Lot dimensions approximately 30 x 90
Interior
- Kitchen: No kitchen appliance details provided
- Bedrooms: Two 1-bedroom units (Units 17 and 19)
- Flooring: No flooring details provided
- Bathrooms: Two full bathrooms (one in each unit)
- Heating & cooling: Window-unit cooling; Window-unit heating
- Interior features: Average condition
- Laundry & utility: No laundry details provided
Neighborhood map
What this means for you Summary
Snapshot
- This is a 4-bed/2.0-bath multifamily listed at $189k.
Deal economics
- At list price, monthly cash flow is $725 ($9k/yr) — positive.
- The deal already cash-flows at list — no discount required.
- Meets the 1% rule at list price ($3k rent vs $189k).
- Recommended offer: $183k (3.0% below list) — sets the bar for market timing.
- Cap rate 11.3% vs local median 4.4% in New Orleans — top-decile yield for the area; either an underpriced asset or a hidden risk that comps aren't pricing in. Stress-test before assuming the spread holds.
Location & tenants
- Location reads 81/100 on livability (#3 in LA, #1,383 nationally) — a professional / high-income tenant draw. Strengths: amenities A+, commute A+, health & safety A+; Watch: crime C-, employment D.
- Orleans Parish (urban): math 11% / reading 27% proficiency, ranked #69 of 98 in LA (top 70%) — low school quality limits family demand, transient renter base, plan for 1-2y turnover; 68% free/reduced lunch — lower-income household profile, screen leases tightly.
- Market conditions: Rents rising fast (+6.0%/yr); 137 active listings in the ZIP; 40 comparable units currently listed for rent nearby; rentals at typical pace (median 24d on market — plan ~3-4 weeks tenant-placement turnaround); lower-income renter base — watch delinquency; 710 units permitted in Orleans Parish in 2024 (244 in 5+ unit buildings).
Forward outlook
- In year one you build about $20k of equity ($1k loan paydown + $19k appreciation (10.0% local appreciation)).
- Orleans County population projected at +61% by 2050 — long-run rental-demand tailwind backs the buy-and-hold thesis.
- At projected returns (10.0% appreciation + 6.0% rent growth), your $53k cash investment doubles in ~2 years — after that, you're playing with house money.
- By year 2, paydown + projected appreciation supports a ~$32k cash-out refi (75% LTV) — recoverable capital for the next deal without selling this one.
Negotiation context
- It's been on market 55 days — a 3% lower offer ($183k) is reasonable based on typical stale-listing flexibility.
- 12 sale attempts since 25y ago; this cycle's ask is 5% above the opening price — seller raised mid-cycle; expect resistance to lowballs.
- Current owner paid $100k; list at $189k implies a 89% gain — meaningful room to come down on a strong offer.
Risks & watch-outs
- Watch-outs: flood insurance adds $66/mo.
- Climate carrying-cost: severe flood risk; severe wind risk, 99% chance of damaging wind over 30y; extreme-heat days projected 7→21/yr by 2055 (HVAC capex compounding) — expect insurance premiums to compound above CPI over the hold.
Questions for the listing agent
- It's been on market 55 days. Have you received any prior offers? Is the seller open to a 3% concession, seller financing, or rate buy-down credit?
- What's the actual annual flood-insurance premium (NFIP or private), and is the property in a SFHA with mandatory coverage?
- Is there a deadline driving the sale (1031 exchange, divorce, estate, relocation)? That informs how much negotiation room exists.
- What's the average days-on-market for RENTAL listings here right now (not sales)? A rising rental-DOM trend means longer vacancies and softer asking-rent achievability than the comps imply.
- What's the recent tenant-quality profile in this submarket — average credit score on applications, eviction rate, late-payment / NSF rate, and stable-employment percentage? A property-management company in the area should have these aggregated.
- How much new apartment / multifamily construction is in the pipeline within 1–3 miles? Heavy new supply (>2% of stock underway) typically softens rents 12–24 months out; light construction supports rent growth.
Investment metrics
- 1% rule
- 1.33% ✓
- Cap rate
- 11.32%
- Cash-on-cash
- 17.96%
- DSCR
- 1.80
- GRM
- 6.3
CMA / ARV
- ARV (median comp)
- $239,162
- List price
- $189,000
- Delta
- -20.97%
- Verdict
- UNDERPRICED
- Comps
- 20 within 1.0 mi
Projected returns pro-forma
10.0% appreciation · 5.98% rent growth · sell at horizon
- IRR
- 37.9%
- Equity multiple
- 3.96×
- Total profit
- $156,886
- Equity at exit
- $170,266
- IRR
- 33.8%
- Equity multiple
- 9.38×
- Total profit
- $443,409
- Equity at exit
- $367,185
Cash invested: $52,920 (down + closing). Projections, not guarantees.
Landlord ↔ Tenant lean methodology
- Overall (STATE)
- 90 Strongly Landlord-Friendly
- State Louisiana
- 90 Strongly Landlord-Friendly · R+12
- County
- — inherits STATE
- City
- — inherits STATE
ZIP-level market 70113
- Rents YoY
- 6.0%
- Active inventory
- 137
- Price-to-rent
- 12.6×
Monthly cashflow live
- Estimated rent
- $2,508 high interval (Pro) →
- Mortgage (P&I)
- −$991
- Tax from tax record
- −$120 /mo · $1,435/yr
- Insurance
- −$79
- Flood insurance flood zone
- −$66 /mo · $798/yr
- HOA
- −$0
- Vacancy / Maint / Mgmt
- −$527
- Net cashflow
- $725
Break-even live
2-unit breakdown (identical units grouped — click to expand)
| Units | Beds | Baths | Est. rent |
|---|---|---|---|
| 2× units | 2 | 1 | $2,508 |
| #1 | 2 | 1 | $1,254 |
| #2 | 2 | 1 | $1,254 |
| Total (2 units) | $2,508 | ||
UW: 25.0% down · 7.5% · 30yr · 1.5% tax · 5.0% vac · 8.0% maint · 8.0% mgmt
Financing live
Cash to close
- Down payment
- $47,250
- Closing costs
- $5,670
- Reserves months
- —
- Total cash needed
- —
Loan-product check · same deal, 3 products live
Conventional
25% down · 7.5% · 30yr
- Down + closing
- —
- Monthly P&I
- —
- Monthly cashflow
- —
- DSCR
- —
- Eligible?
- —
Personal DTI + credit; lowest rate.
DSCR
20% down · 8.5% · 30yr
- Down + closing
- —
- Monthly P&I
- —
- Monthly cashflow
- —
- DSCR
- —
- Eligible?
- —
No personal income docs; deal must DSCR.
Hard money
10% down · 12.0% · 12mo
- Down + closing
- —
- Monthly P&I
- —
- Monthly cashflow
- —
- DSCR
- —
- Eligible?
- —
Short-term bridge; refi at stabilization.
Rent comps 40 comps
| Address | Beds | Baths | Sqft | Rent | $/sqft | DOM | Units | Dist |
|---|---|---|---|---|---|---|---|---|
| 3108 Second St New Orleans, LA | 3.0 | 3.0 | 1216 | $2,100 | $1.73 | 3d | 1 | 0.28mi |
| 2628 S Derbigny St New Orleans, LA | 3.0 | 1.0 | 900 | $1,500 | $1.67 | 3d | 1 | 0.28mi |
| 2722 Martin L King Bl New Orleans, LA | 3.0 | 2.5 | 1350 | $1,800 | $1.33 | 23d | 1 | 0.29mi |
| 3120 Second St New Orleans, LA | 3.0 | 3.0 | 1256 | $2,050 | $1.63 | 23d | 1 | 0.29mi |
| 3122 2nd St New Orleans, LA | 3.0 | 3.0 | 1206 | $2,075 | $1.72 | 23d | 1 | 0.30mi |
| 2123 S Liberty St Unit 2125 New Orleans, LA | 3.0 | 2.0 | 1500 | $2,100 | $1.40 | 3d | 1 | 0.30mi |
| 2225 2nd St New Orleans, LA | 3.0 | 2.0 | 1100 | $1,800 | $1.64 | 23d | 1 | 0.32mi |
| 2526 Martin Luther King Junior Blvd New Orleans, LA | 3.0 | 2.0 | 1200 | $2,200 | $1.83 | 3d | 1 | 0.33mi |
| 2341 S Roman St Unit U New Orleans, LA | 3.0 | 2.0 | 1000 | $1,850 | $1.85 | 23d | 1 | 0.33mi |
| 3204 2nd St New Orleans, LA | 3.0 | 2.0 | 850 | $1,295 | $1.52 | 23d | 1 | 0.33mi |
| 1614 Rev John Raphael Jr Way New Orleans, LA | 3.0 | 2.0 | 1000 | $1,500 | $1.50 | 23d | 1 | 0.35mi |
| 2833 S Derbigny St New Orleans, LA | 3.0 | 2.0 | 1500 | $1,795 | $1.20 | 23d | 1 | 0.38mi |
| 2717 Loyola Ave New Orleans, LA | 3.0 | 2.0 | 1250 | $2,300 | $1.84 | 2d | 1 | 0.40mi |
| 2717 Loyola Ave New Orleans, LA | 3.0 | 2.0 | 1232 | $2,300 | $1.87 | 23d | 1 | 0.40mi |
| 2318 Martin Luther King Junior Blvd New Orleans, LA | 3.0 | 2.0 | 1400 | $1,700 | $1.21 | 23d | 1 | 0.42mi |
| 3218 Jackson Ave New Orleans, LA | 3.0 | 2.0 | 1267 | $1,750 | $1.38 | 23d | 1 | 0.42mi |
| 3322 Third St New Orleans, LA | 3.0 | 2.0 | 950 | $1,450 | $1.53 | 23d | 1 | 0.43mi |
| 2119 Josephine St New Orleans, LA | 3.0 | 1.0 | 1017 | $950 | $0.93 | 21d | 1 | 0.43mi |
| 2107 Fourth St New Orleans, LA | 3.0 | 1.0 | 1292 | $1,775 | $1.37 | 17d | 1 | 0.44mi |
| 2102 Josephine St New Orleans, LA | 4.0 | 2.0 | 1286 | $2,100 | $1.63 | 23d | 1 | 0.45mi |
| 2032 Saint Andrew St New Orleans, LA | 3.0 | 2.0 | 1035 | $1,830 | $1.77 | 17d | 1 | 0.49mi |
| 2620 S Galvez St Apt 2B New Orleans, LA | 3.0 | 1.0 | 1000 | $1,100 | $1.10 | 17d | 1 | 0.50mi |
| 1915 Philip St New Orleans, LA | 3.0 | 1.5 | 1300 | $2,450 | $1.88 | 23d | 1 | 0.51mi |
| 3435 Magnolia St New Orleans, LA | 3.0 | 1.0 | 1050 | $1,500 | $1.43 | 23d | 1 | 0.52mi |
| 2733 Danneel St New Orleans, LA | 4.0 | 2.0 | 1350 | $1,775 | $1.31 | 23d | 1 | 0.53mi |
| 3230 Toledano St New Orleans, LA | 3.0 | 2.0 | 950 | $1,750 | $1.84 | 23d | 1 | 0.53mi |
| 3208 Louisiana Avenue Pkwy New Orleans, LA | 3.0 | 2.0 | 1391 | $1,900 | $1.37 | 17d | 1 | 0.53mi |
| 2606 S Miro St New Orleans, LA | 3.0 | 2.0 | 1450 | $2,016 | $1.39 | 23d | 1 | 0.56mi |
| 2539 Amelia St New Orleans, LA | 3.0 | 2.0 | 1296 | $2,200 | $1.70 | 23d | 1 | 0.57mi |
| 3632 First St Unit B New Orleans, LA | 3.0 | 2.0 | 950 | $1,750 | $1.84 | 11d | 1 | 0.61mi |
| 3632 First St Unit A New Orleans, LA | 3.0 | 2.0 | 950 | $1,850 | $1.95 | 11d | 1 | 0.61mi |
| 3617 Fourth St Unit A New Orleans, LA | 3.0 | 2.0 | 1225 | $1,995 | $1.63 | 17d | 1 | 0.61mi |
| 2535 Marengo St New Orleans, LA | 3.0 | 1.0 | 1300 | $1,200 | $0.92 | 14d | 1 | 0.68mi |
| 4206 S Derbigny St New Orleans, LA | 3.0 | 1.0 | 1300 | $1,600 | $1.23 | 23d | 1 | 0.69mi |
| 2232 Amelia St New Orleans, LA | 3.0 | 2.0 | 900 | $1,800 | $2.00 | 17d | 1 | 0.70mi |
| 3514 S Miro St New Orleans, LA | 3.0 | 2.0 | 1230 | $1,950 | $1.59 | 17d | 1 | 0.70mi |
| 3511 S Miro St New Orleans, LA | 3.0 | 1.0 | 802 | $1,000 | $1.25 | 23d | 1 | 0.71mi |
| 2931 Baronne St New Orleans, LA | 3.0 | 1.0 | 1145 | $1,510 | $1.32 | 23d | 1 | 0.72mi |
| 4305 S Johnson St Unit 4305 New Orleans, LA | 3.0 | 1.0 | 1175 | $1,595 | $1.36 | 11d | 1 | 0.79mi |
| 3829 General Taylor St New Orleans, LA | 3.0 | 1.0 | 1000 | $1,300 | $1.30 | 23d | 1 | 0.84mi |
Listing history 34 events
-
2026-06-18days on market $189,000 Active 55 DOM
-
2026-06-17days on market $189,000 Active 54 DOM
-
2026-06-16days on market $189,000 Active 53 DOM
-
2026-06-15days on market $189,000 Active 52 DOM
-
2026-06-13days on market $189,000 Active 50 DOM
-
2026-06-10days on market $189,000 Active 47 DOM
-
2026-06-09days on market $189,000 Active 46 DOM
-
2026-06-08days on market $189,000 Active 45 DOM
-
2026-06-07days on market $189,000 Active 44 DOM
-
2026-06-05days on market $189,000 Active 41 DOM
-
2026-06-03days on market $189,000 Active 40 DOM
-
2026-06-02days on market $189,000 Active 39 DOM
-
2026-06-01days on market $189,000 Active 38 DOM
-
2026-05-31days on market $189,000 Active 37 DOM
-
2026-04-25price $189,000 1521-char remark
-
2026-04-22$179,711 Active 1521-char remark
-
2025-10-15price $169,997
-
2025-10-15price $169,997
-
2025-09-11price $189,997
-
2025-09-11price $189,997
-
2025-07-16$199,997 Active
-
2024-05-07$349,000 Active
-
2012-10-09$24,200
-
2011-09-26$75,000
-
2011-09-26$75,000
-
2011-03-28$75,000
-
2011-03-28$75,000
-
2008-05-02soldstatus $100,000
-
2007-01-26soldstatus $45,000
-
2006-11-07$60,000
-
2006-11-07$60,000
-
2001-05-01soldstatus $31,500
-
2001-01-12$42,500
-
2001-01-12$42,500
ⓘ Source: listings_history table (triggers on properties + properties_extension) + one-shot
backfill from property_details.listing_events for pre-trigger history.
Tax reassessment forecast LA · Resets to sale price
- Current annual tax
- $1,435 · $120/mo
- Projected year-2 tax
- $1,435 · $120/mo
- Expected delta
- $0/yr ($0/mo · 0.0%)
ⓘ Screening estimate from a state-policy table — verify with the county assessor before closing.
Climate risk First Street
- Flood 8/10 Severe FEMA zone X (shaded) · 60% chance over 30 yrs
- Wildfire 1/10 Low
- Heat 10/10 Extreme 7 d/yr ≥108°F today · 21 d/yr by 30 yrs out
- Wind 10/10 Extreme 99% chance of damaging wind over 30 yrs
- Air quality 3/10 Moderate 3 unhealthy d/yr today · 4 by 30 yrs out
Nearby sold comps map
Loading sold comps map…
Walkable amenities ~0.75 mi
Loading nearby amenities…
Taxation est. · year 1
- Rental income
- $30,096
- − Mortgage interest
- −$10,587
- − Property taxes
- −$1,435
- − Insurance
- −$1,742
- − Repairs & maintenance
- −$2,408
- − Management
- −$2,408
- − Depreciation
- −$5,498
- Taxable income
- $6,018
- Est. tax owed @ 24.0%
- −$1,444
- After-tax cash flow
- $7,260/yr
For passive investors: Depreciation is non-cash, so a rental often shows a tax loss while cash-flowing — sheltering income. Rental losses are passive: they offset passive income freely, and up to $25,000/yr can offset ordinary (W-2) income if you actively participate and your MAGI is under $100k (phasing out to $0 by $150k); unused losses carry forward. On sale, claimed depreciation is recaptured at up to 25%, and gains may owe capital-gains tax (a 1031 exchange can defer both). Figures are a year-1 estimate at your 24.0% rate — not tax advice; consult a CPA.
Schools (NCES district)
- District
- Orleans Parish
- NCES district ID
- 2201170
- Math proficiency
- 11% ▼ -52.00%
- Reading proficiency
- 27% ▼ -46.00%
- Median HH income
- $37,011
- Composite
- 15.78/100
- National rank
- #9271
- State rank
- #69 of 98 in LA
Livability — New Orleans
- Score
- 81/100
- State rank
- #3
- US rank
- #1383
Category grades
Schools grade is shown separately in the Schools card above.
Census & demographics
- Census place
- New Orleans, LA
- County
- Orleans Parish · 338,817 people
- City population
- 338,817
- Metro
- New Orleans-Metairie, LA
- Population (ZIP)
- 9,387
- Household income
- $39,333
- Rent vs Own
- Severe rent burden
- 714.0
Population outlook (Orleans County) Hauer SSP2
- Today (2025)
- 513,025 people
- By 2030
- 575,781 · +12.2%
- By 2040
- 700,174 · +36.5%
- By 2050
- 826,541 · +61.1%
- By 2075
- 1,123,374 · +119.0%
- By 2100
- 1,355,609 · +164.2%
Race, ethnicity, and origin ACS 2023
- Neighborhood character
- Diverse neighborhood (Simpson 0.57)
- Race & ethnicity
- Black 61% White 20% Hispanic / Latino 13% Two or more races 11% Asian 2%
- Hispanic origin (detail)
- Mexican 2%
- Common ancestry
- Lithuanian 2% Portuguese 1% Slovak 1%
- Foreign-born
- 13% · Canada, Vietnam, China
- Languages at home
- 86% English-only · Spanish 11% Other Indo-European 1% Vietnamese 1%
Political lean MEDSL · Orleans
- 2024 margin
- Solid D (+67.0) · D 82.2% · R 15.2% · Other 2.7%
- 2008→2024 swing
- +6.7pp toward D · 2008: 60.3pp · 2024: 67.0pp
- All cycles
- 2024: D+67.0 2020: D+68.2 2016: D+66.2 2012: D+62.5 2008: D+60.3
Not yet ingested
- Civics
- —
Market trends
- HPI YoY
- ▲ 65.92%
- Current HPI
- 229.3968
- Rent YoY
- ▲ 5.98%
- Metro
- New Orleans-Metairie, LA
- State GDP YoY
- ▲ 3.29%
- F500 in state
- 10
Industry mix (Fortune 500 HQ in LA)
| Industry | F500 HQs | Revenue |
|---|---|---|
| Telecommunications | 2 | $23B |
|
||
| Utilities | 1 | $12B |
|
||
| Wholesale / Distribution | 1 | $5B |
|
||
| Advertising | 1 | $2B |
|
||
Price history
+344.7% since first listed20 events — show timeline
- 2026-04-25 Price Changed $189,000 GSREIN
- 2026-04-22 Listed $179,711 GSREIN
- 2025-10-15 Price Changed $169,997 AcadianaMLS
- 2025-10-15 Price Changed $169,997 GSREIN
- 2025-09-11 Price Changed $189,997 AcadianaMLS
- 2025-09-11 Price Changed $189,997 GSREIN
- 2025-07-16 Listed $199,997 AcadianaMLS
- 2024-05-07 Listed $349,000 AcadianaMLS
- 2012-10-09 Listed $24,200 AcadianaMLS
- 2011-09-26 Listed $75,000 GSREIN
- 2011-09-26 Listed $75,000 AcadianaMLS
- 2011-03-28 Listed $75,000 GSREIN
- 2011-03-28 Listed $75,000 AcadianaMLS
- 2008-05-02 Sold (Public Records) $100,000 Public Records
- 2007-01-26 Sold (MLS) $45,000 GSREIN
- 2006-11-07 Listed $60,000 AcadianaMLS
- 2006-11-07 Listed $60,000 GSREIN
- 2001-05-01 Sold (MLS) $31,500 GSREIN
- 2001-01-12 Listed $42,500 GSREIN
- 2001-01-12 Listed $42,500 AcadianaMLS
Property tax history
+1.9%/yrLatest (2026): $1,435 · +1.1% YoY. Source: county tax records.
Cash-flow waterfall
monthlySold comps — $/sqft
last 12 mo · ≤1 miLoading sold comps…