 🏷️ Likely Rental
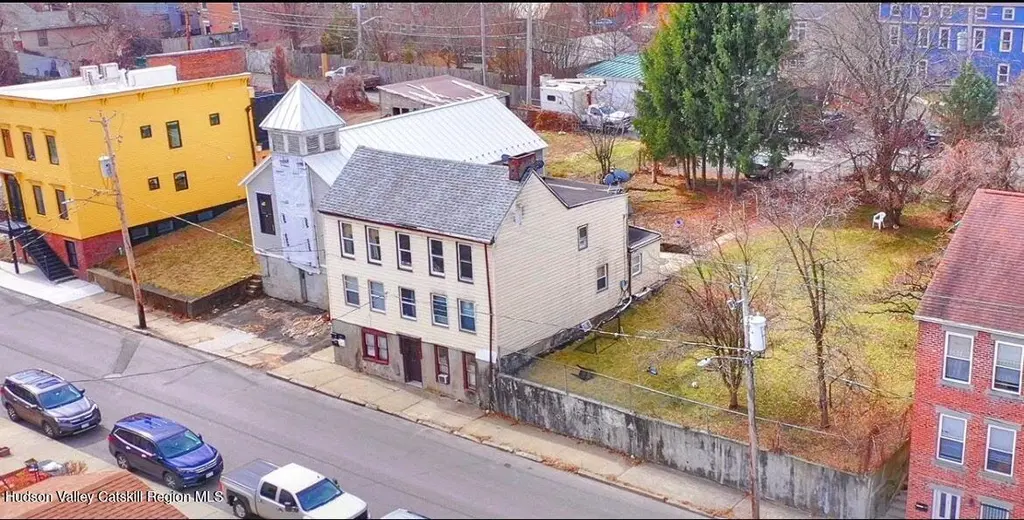
233-235 Columbia St · Hudson, NY
Flood risk No data
- FEMA flood zone
- —
- Chance of flooding over 30 yrs
- —
- Est. flood insurance / yr
- —
Fire risk No data
- Est. fire insurance / yr
- —
Heat risk No data
- Hot days now (above threshold)
- —
- Hot days in 30 yrs
- —
Wind risk No data
- Chance of severe wind over 30 yrs
- —
Air-quality risk No data
- Unhealthy air days now
- —
- Unhealthy air days in 30 yrs
- —
Risk factors via First Street. Map © Google.
Why this score? — see what drove the A- grade
The composite is a weighted blend of 9 inputs, each scored 0–100. Each bar is that input's sub-score; the figure is the points it added to the 100-point composite (weight × sub-score).
- Cash flow +30.0/30.0
- 1% rule +10.0/10.0
- DSCR +10.0/10.0
- Appreciation +10.0/10.0
- ARV discount +7.5/15.0
- Rent growth +5.0/5.0
- Schools +3.6/10.0
- Livability +3.5/5.0
- Condition / age +2.2/5.0
$625,000
🖨 Deal sheet (PDF) 📄 Offer letter ✓ Due diligence
Multi-family units
County records classify this as Multi-Family (2-4 Unit). Listing-text estimate: 4 units. confirmed
Listing remarks MLS
Just moments from the energy and culture of Warren Street, this fully occupied four unit property offers both immediate income and long-term potential in the heart of Hudson. Each unit is currently month to month tenant occupied, creating a seamless turnkey opportunity for investors seeking stable cash flow in one of the Hudson Valley's most sought-after markets. Set within walking distance to Hudson's many restaurants, boutiques, galleries, and waterfront, the location alone makes this a rare find. Included in the sale is an adjacent building lot, opening the door to expansion, development, or future resale value. A wonderful opportunity whether you are looking to grow your portfolio or secure a foothold in Hudson's thriving real estate market, this offering combines income, location, and opportunity in one compelling package.
Key facts
- Long term potential
- Stable cash flow
- Immediate income
Tags
Neighborhood map
What this means for you Summary
Snapshot
- This is a 4 × 6-bed/4.0-bath units multifamily listed at $625k. Condition is rated fair.
Deal economics
- At list price, monthly cash flow is $5k ($65k/yr) — positive. Per door: $1k/mo.
- The deal already cash-flows at list — no discount required.
- Meets the 1% rule at list price ($12k rent vs $625k).
- Recommended offer: $550k (12.0% below list) — sets the bar for market timing.
- Cap rate 16.6% vs local median 3.3% in Hudson — top-decile yield for the area; either an underpriced asset or a hidden risk that comps aren't pricing in. Stress-test before assuming the spread holds.
Location & tenants
- Location reads 70/100 on livability (#430 in NY) — a middle-class / working-renter tenant base. Strengths: amenities A+, health & safety A+; Watch: schools C-, commute F, employment F.
- Hudson City School District (town): math 38% / reading 47% proficiency, ranked #494 of 590 in NY (top 84%) — families likely to look elsewhere, expect single-tenant / working-renter base with shorter leases.
- Market conditions: Rents rising fast (+10.9%/yr); 161 active listings in the ZIP; 136 units permitted in Columbia County in 2024 (0 in 5+ unit buildings).
- At $12,289/mo this rent would consume 203% of the median local household income ($73k/yr) (locally 1083% of renters already pay >50% of income on rent) — very limited rent-growth headroom before tenants either downsize or default.
Forward outlook
- In year one you build about $67k of equity ($4k loan paydown + $62k appreciation (10.0% local appreciation)).
- Columbia County population projected at -22% by 2050 — secular population decline; favor cash flow + early exit over multi-decade hold.
- At projected returns (10.0% appreciation + 8.0% rent growth), your $175k cash investment doubles in ~2 years — after that, you're playing with house money.
- By year 2, paydown + projected appreciation supports a ~$107k cash-out refi (75% LTV) — recoverable capital for the next deal without selling this one.
Negotiation context
- It's been on market 124 days — a 12% lower offer ($550k) is reasonable based on typical stale-listing flexibility.
- 3 sale attempts since 2y ago with the ask held roughly flat each time — persistent listings suggest the price (not the market) is what's stuck; bring a comps-based counter.
Risks & watch-outs
- Watch-outs: built in 1900 — expect roof / HVAC / electrical / plumbing capex.
Questions for the listing agent
- It's been on market 124 days. Have you received any prior offers? Is the seller open to a 12% concession, seller financing, or rate buy-down credit?
- Can we see the unit-by-unit rent roll, current vacancy, and any below-market leases? What's the average tenancy length?
- What capital expenditures (roof, boiler, parking lot, exteriors) have been made in the last 5 years, and what's planned in the next 2?
- Have any recent inspections been done? Can we get a copy of the seller's disclosures and any deferred-maintenance estimates?
- Built in 1900 — when were the roof, HVAC, electrical panel, plumbing, and water heater last replaced?
- Why hasn't it sold? Are there any deal-killer items the seller is aware of (foundation, flood, title, zoning, code violations)?
- Is there a deadline driving the sale (1031 exchange, divorce, estate, relocation)? That informs how much negotiation room exists.
- What's the average days-on-market for RENTAL listings here right now (not sales)? A rising rental-DOM trend means longer vacancies and softer asking-rent achievability than the comps imply.
- What's the recent tenant-quality profile in this submarket — average credit score on applications, eviction rate, late-payment / NSF rate, and stable-employment percentage? A property-management company in the area should have these aggregated.
- How much new apartment / multifamily construction is in the pipeline within 1–3 miles? Heavy new supply (>2% of stock underway) typically softens rents 12–24 months out; light construction supports rent growth.
Investment metrics
- 1% rule
- 1.97% ✓
- Cap rate
- 16.64%
- Cash-on-cash
- 36.95%
- DSCR
- 2.64
- GRM
- 4.2
CMA / ARV
- ARV (median comp)
- $1,372,039
- List price
- $625,000
- Delta
- -54.45%
- Verdict
- UNDERPRICED
- Comps
- 13 within 1.0 mi
Projected returns pro-forma
10.0% appreciation · 8.0% rent growth · sell at horizon
- IRR
- 56.1%
- Equity multiple
- 5.28×
- Total profit
- $748,755
- Equity at exit
- $563,050
- IRR
- 51.7%
- Equity multiple
- 12.98×
- Total profit
- $2,096,302
- Equity at exit
- $1,214,238
Cash invested: $175,000 (down + closing). Projections, not guarantees.
Landlord ↔ Tenant lean methodology
- Overall (STATE)
- 15 Strongly Tenant-Friendly
- State New York
- 15 Strongly Tenant-Friendly · D+10
- County
- — inherits STATE
- City
- — inherits STATE
ZIP-level market 12534
- Home prices YoY
- 5.6%
- Rents YoY
- 10.9%
- Active inventory
- 161
- Price-to-rent
- 17.0×
Monthly cashflow live
- Estimated rent
- $12,289 medium interval (Pro) →
- Mortgage (P&I)
- −$3,278
- Tax est. 1.5%
- −$781 /mo · $9,375/yr
- Insurance
- −$260
- HOA
- −$0
- Vacancy / Maint / Mgmt
- −$2,581
- Net cashflow
- $5,389
Break-even live
Sensitivity live
| Price | -10% $5,821 | -5% $5,605 | +0% $5,389 | +5% $5,173 | +10% $4,957 |
|---|---|---|---|---|---|
| Rent | -10% $4,418 | -5% $4,904 | +0% $5,389 | +5% $5,874 | +10% $6,360 |
| Rate | -1.0pp $5,704 | -0.5pp $5,548 | base $5,389 | +0.5pp $5,227 | +1.0pp $5,062 |
4-unit breakdown (identical units grouped — click to expand)
| Units | Beds | Baths | Est. rent |
|---|---|---|---|
| 4× units | 6 | 4 | $12,288 |
| #1 | 6 | 4 | $3,072 |
| #2 | 6 | 4 | $3,072 |
| #3 | 6 | 4 | $3,072 |
| #4 | 6 | 4 | $3,072 |
| Total (4 units) | $12,289 | ||
UW: 25.0% down · 7.5% · 30yr · 1.5% tax · 5.0% vac · 8.0% maint · 8.0% mgmt
Financing live
Cash to close
- Down payment
- $156,250
- Closing costs
- $18,750
- Reserves months
- —
- Total cash needed
- —
Loan-product check · same deal, 3 products live
Conventional
25% down · 7.5% · 30yr
- Down + closing
- —
- Monthly P&I
- —
- Monthly cashflow
- —
- DSCR
- —
- Eligible?
- —
Personal DTI + credit; lowest rate.
DSCR
20% down · 8.5% · 30yr
- Down + closing
- —
- Monthly P&I
- —
- Monthly cashflow
- —
- DSCR
- —
- Eligible?
- —
No personal income docs; deal must DSCR.
Hard money
10% down · 12.0% · 12mo
- Down + closing
- —
- Monthly P&I
- —
- Monthly cashflow
- —
- DSCR
- —
- Eligible?
- —
Short-term bridge; refi at stabilization.
Listing history 20 events
-
2026-06-19days on market $625,000 Active 124 DOM
-
2026-06-18days on market $625,000 Active 123 DOM
-
2026-06-17days on market $625,000 Active 122 DOM
-
2026-06-16days on market $625,000 Active 121 DOM
-
2026-06-15days on market $625,000 Active 120 DOM
-
2026-06-14days on market $625,000 Active 118 DOM
-
2026-06-12days on market $625,000 Active 117 DOM
-
2026-06-09days on market $625,000 Active 114 DOM
-
2026-06-08days on market $625,000 Active 113 DOM
-
2026-06-07days on market $625,000 Active 112 DOM
-
2026-06-04days on market $625,000 Active 108 DOM
-
2026-06-02days on market $625,000 Active 107 DOM
-
2026-06-01days on market $625,000 Active 106 DOM
-
2026-05-31days on market $625,000 Active 105 DOM
-
2026-05-31days on market $625,000 Active 104 DOM
-
2026-04-30price $625,000 839-char remark
Show marketing remark (839 chars)
Just moments from the energy and culture of Warren Street, this fully occupied four unit property offers both immediate income and long-term potential in the heart of Hudson. Each unit is currently month to month tenant occupied, creating a seamless turnkey opportunity for investors seeking stable cash flow in one of the Hudson Valley's most sought-after markets. Set within walking distance to Hudson's many restaurants, boutiques, galleries, and waterfront, the location alone makes this a rare find. Included in the sale is an adjacent building lot, opening the door to expansion, development, or future resale value. A wonderful opportunity whether you are looking to grow your portfolio or secure a foothold in Hudson's thriving real estate market, this offering combines income, location, and opportunity in one compelling package.
-
2026-02-15$650,000 Active 839-char remark
Show marketing remark (839 chars)
Just moments from the energy and culture of Warren Street, this fully occupied four unit property offers both immediate income and long-term potential in the heart of Hudson. Each unit is currently month to month tenant occupied, creating a seamless turnkey opportunity for investors seeking stable cash flow in one of the Hudson Valley's most sought-after markets. Set within walking distance to Hudson's many restaurants, boutiques, galleries, and waterfront, the location alone makes this a rare find. Included in the sale is an adjacent building lot, opening the door to expansion, development, or future resale value. A wonderful opportunity whether you are looking to grow your portfolio or secure a foothold in Hudson's thriving real estate market, this offering combines income, location, and opportunity in one compelling package.
-
2025-07-03price $715,000
-
2025-04-24$749,000 Active
-
2024-07-17$675,000
ⓘ Source: listings_history table (triggers on properties + properties_extension) + one-shot
backfill from property_details.listing_events for pre-trigger history.
Nearby sold comps map
Loading sold comps map…
Walkable amenities ~0.75 mi
Loading nearby amenities…
Taxation est. · year 1
- Rental income
- $147,468
- − Mortgage interest
- −$35,010
- − Property taxes
- −$9,375
- − Insurance
- −$3,125
- − Repairs & maintenance
- −$11,797
- − Management
- −$11,797
- − Depreciation
- −$18,182
- Taxable income
- $58,182
- Est. tax owed @ 24.0%
- −$13,964
- After-tax cash flow
- $50,705/yr
For passive investors: Depreciation is non-cash, so a rental often shows a tax loss while cash-flowing — sheltering income. Rental losses are passive: they offset passive income freely, and up to $25,000/yr can offset ordinary (W-2) income if you actively participate and your MAGI is under $100k (phasing out to $0 by $150k); unused losses carry forward. On sale, claimed depreciation is recaptured at up to 25%, and gains may owe capital-gains tax (a 1031 exchange can defer both). Figures are a year-1 estimate at your 24.0% rate — not tax advice; consult a CPA.
Condition & rehab AI · 6 photos
This four-unit multi-family property requires moderate rehabilitation, including painting the exterior siding and repairing the roof. Improvements will significantly enhance its curb appeal and rental value.
Repairs flagged
- Major exterior siding — The siding is visibly weathered and in need of repainting.
- Major roof — The roof has visible snow and potential ice dams, indicating potential water damage.
Value-add opportunities
- Both paint exterior siding — Painting the exterior siding will improve the home's curb appeal and increase its rental value.
- Both repair and maintain roof — Repairing and maintaining the roof will prevent water damage and ensure the home's structural integrity, increasing its resale and rental value.
Renovation cost estimate screening
| Repair item | Severity | Est. cost |
|---|---|---|
| exterior siding · The siding is visibly weathered and in need of repainting. | Major | $15,000–50,000 |
| roof · The roof has visible snow and potential ice dams, indicating potential water damage. | Major | $15,000–50,000 |
| Total estimated repair cost · 2 items | $30,000–100,000 |
Value-add ROI direction
- Both paint exterior siding — Painting the exterior siding will improve the home's curb appeal and increase its rental value. ↑
- Both repair and maintain roof — Repairing and maintaining the roof will prevent water damage and ensure the home's structural integrity, increasing its resale and rental value. ↑
ⓘ Cost ranges are severity-bucket heuristics (US national rule-of-thumb). Get contractor quotes + a written scope before underwriting a rehab budget.
Schools (NCES district)
- District
- Hudson City School District
- NCES district ID
- 3614940
- Math proficiency
- 38% ▲ 4.00%
- Reading proficiency
- 47% ▲ 7.00%
- Median HH income
- $44,663
- Composite
- 36.03/100
- National rank
- #4779
- State rank
- #494 of 590 in NY
Livability — Hudson
- Score
- 70/100
- State rank
- #430
- US rank
- #7443
Category grades
Schools grade is shown separately in the Schools card above.
Census & demographics
- Census place
- Hudson, NY
- County
- Columbia County · 17,176 people
- City population
- 184
- Metro
- Hudson, NY
- Population (ZIP)
- 17,176
- Household income
- $72,741
- Rent vs Own
- Severe rent burden
- 1083.0
Population outlook (Columbia County) Hauer SSP2
- Today (2025)
- 58,662 people
- By 2030
- 56,557 · -3.6%
- By 2040
- 51,324 · -12.5%
- By 2050
- 45,790 · -21.9%
- By 2075
- 35,232 · -39.9%
- By 2100
- 25,846 · -55.9%
Race, ethnicity, and origin ACS 2023
- Neighborhood character
- Predominantly White (74%)
- Race & ethnicity
- White 74% Two or more races 7% Black 7% Hispanic / Latino 7% Asian 6%
- Hispanic origin (detail)
- Mexican 2% Puerto Rican 1%
- Common ancestry
- Lithuanian 4% Romanian 4% Iranian 3%
- Foreign-born
- 10% · Canada, China
- Languages at home
- 88% English-only · Spanish 5% Other Indo-European 3% Chinese 1%
Political lean MEDSL · Columbia
- 2024 margin
- D (+14.7) · D 57.4% · R 42.6%
- 2008→2024 swing
- +1.3pp toward D · 2008: 13.4pp · 2024: 14.7pp
- All cycles
- 2024: D+14.7 2020: D+16.7 2016: D+1.4 2012: D+11.7 2008: D+13.4
Not yet ingested
- Civics
- —
Market trends
- HPI YoY
- ▲ 25.98%
- Current HPI
- 490.0412
- Rent YoY
- ▲ 10.88%
- Metro
- Hudson, NY
- State GDP YoY
- ▲ 2.60%
- F500 in state
- 92
Industry mix (Fortune 500 HQ in NY)
| Industry | F500 HQs | Revenue |
|---|---|---|
| Financial Services | 10 | $950B |
|
||
| Consumer Goods | 9 | $162B |
|
||
| Insurance | 4 | $225B |
|
||
| Telecommunications | 2 | $144B |
|
||
| Pharmaceuticals | 2 | $112B |
|
||
| Media / Entertainment | 2 | $69B |
|
||
Price history
-7.4% since first listed5 events — show timeline
- 2026-04-30 Price Changed $625,000 HVCRMLS
- 2026-02-15 Listed $650,000 HVCRMLS
- 2025-07-03 Price Changed $715,000 HVCRMLS
- 2025-04-24 Listed $749,000 HVCRMLS
- 2024-07-17 Listed $675,000 HVCRMLS
Cash-flow waterfall
monthlySold comps — $/sqft
last 12 mo · ≤1 miLoading sold comps…