602 1/2 W Grand St · Whitewright, TX
Flood risk 1/10 · Minimal
- FEMA flood zone
- X (unshaded)
- Chance of flooding over 30 yrs
- 0.0%
- Est. flood insurance / yr
- $507 – $1,088
Fire risk 7/10 · Major
- Est. fire insurance / yr
- $1,222 – $2,270
Heat risk 7/10 · Major
- Hot days now (above 110°F)
- 7 days/yr
- Hot days in 30 yrs
- 21 days/yr
Wind risk 6/10 · Moderate
- Chance of severe wind over 30 yrs
- 27.0%
Air-quality risk 2/10 · Minimal
- Unhealthy air days now
- 1 days/yr
- Unhealthy air days in 30 yrs
- 2 days/yr
Risk factors via First Street. Map © Google.
Why this score? — see what drove the C grade
The composite is a weighted blend of 9 inputs, each scored 0–100. Each bar is that input's sub-score; the figure is the points it added to the 100-point composite (weight × sub-score).
- Cash flow +20.1/30.0
- ARV discount +15.0/15.0
- DSCR +6.4/10.0
- 1% rule +5.3/10.0
- Schools +4.5/10.0
- Livability +3.4/5.0
- Rent growth +2.5/5.0
- Condition / age +2.2/5.0
- Appreciation +0.0/10.0
$169,900
🖨 Deal sheet 📄 Offer letter ✓ Due diligence
Listing remarks
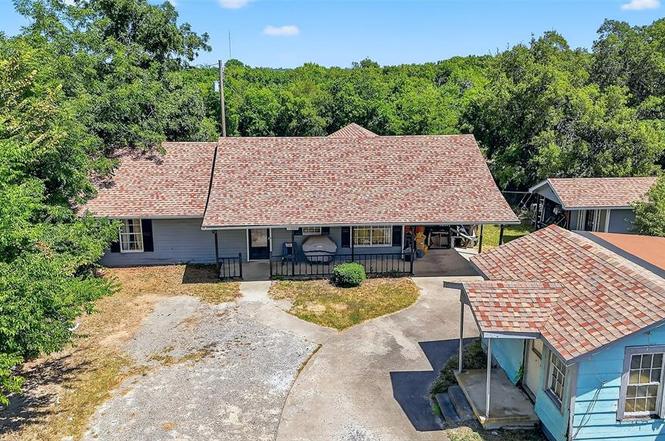
* * Motivated and open to all offers * * Welcome to 602 ½ W Grand Street, a charming and soulful retreat nestled in the heart of Whitewright, Texas—where small-town warmth meets everyday comfort. This thoughtfully designed home rests on over half an acre of peaceful land, offering nearly 2,000 square feet of inviting living space filled with natural light, character, and calm. From the moment you arrive, you're welcomed by the quiet dignity of its setting and the gentle rhythm of life that flows through each room. Whether it’s the cozy living spaces, the spacious kitchen perfect for slow mornings and shared meals, or the quiet corners ideal for reading, reflection,
Key facts
- Expansive lot
- Spacious kitchen
- Natural light
Tags
Neighborhood map
What this means for you Summary
Snapshot
- This is a 2-bed/2.0-bath single-family listed at $170k. Condition is rated fair.
Deal economics
- At list price, monthly cash flow is $210 ($3k/yr) — positive.
- The deal already cash-flows at list — no discount required.
- Meets the 1% rule at list price ($2k rent vs $170k).
- Recommended offer: $165k (3.0% below list) — sets the bar for market timing.
- Cap rate 7.8% vs local median 4.3% in Whitewright — top-decile yield for the area; either an underpriced asset or a hidden risk that comps aren't pricing in. Stress-test before assuming the spread holds.
Location & tenants
- Location reads 68/100 on livability (#457 in TX) — a middle-class / working-renter tenant base. Strengths: cost of living A+, housing A+, crime A-; Watch: amenities F, commute F, employment F.
- Whitewright ISD (rural): math 57% / reading 49% proficiency, ranked #134 of 826 in TX (top 16%) — acceptable for families but not a draw, mixed tenant base, ~2y average lease.
- Zoned schools: Whitewright El (math 47% / reading 42%, grade F, #1,155 of 4,322 statewide, top 29%, 389 students, 59% FRL) — zoned schools average 59% FRL vs 27% district-wide (32 pts higher); higher-poverty schools than district average — tighter screening recommended.
- Market conditions: 109 active listings in the ZIP; 4 comparable units currently listed for rent nearby; rentals leasing fast (median 2d on market — plan ~1-2 weeks tenant-placement turnaround); 2,272 units permitted in Grayson County in 2024 (750 in 5+ unit buildings).
Forward outlook
- Local home prices are declining (-3.0%/yr); year-one equity from $1k of loan paydown is wiped out by about $5k of value loss. Plan a longer hold.
- Grayson County population projected at +12% by 2050 — modest demand growth; plan on rents tracking national, not racing it.
Negotiation context
- It's been on market 58 days — a 3% lower offer ($165k) is reasonable based on typical stale-listing flexibility.
Risks & watch-outs
- Climate carrying-cost: major wind risk, 27% chance of damaging wind over 30y; major wildfire risk; extreme-heat days projected 7→21/yr by 2055 (HVAC capex compounding) — expect insurance premiums to compound above CPI over the hold.
Questions for the listing agent
- It's been on market 58 days. Have you received any prior offers? Is the seller open to a 3% concession, seller financing, or rate buy-down credit?
- Have any recent inspections been done? Can we get a copy of the seller's disclosures and any deferred-maintenance estimates?
- Is there a deadline driving the sale (1031 exchange, divorce, estate, relocation)? That informs how much negotiation room exists.
- What's the average days-on-market for RENTAL listings here right now (not sales)? A rising rental-DOM trend means longer vacancies and softer asking-rent achievability than the comps imply.
- What's the recent tenant-quality profile in this submarket — average credit score on applications, eviction rate, late-payment / NSF rate, and stable-employment percentage? A property-management company in the area should have these aggregated.
- How much new for-sale + rental construction is in the pipeline within 1–3 miles? Heavy new supply typically softens prices + rents 12–24 months out; constrained supply supports both.
Investment metrics
- 1% rule
- 1.03% ✓
- Cap rate
- 7.78%
- Cash-on-cash
- 5.30%
- DSCR
- 1.24
- GRM
- 8.1
CMA / ARV
- ARV (on-the-fly)
- $334,236
- Comps found
- 7
Show comp detail 7 sales within ~0.75 mi
| Address | Dist | Beds/Ba | Sqft | Sold | Price | $/sf | Match |
|---|---|---|---|---|---|---|---|
| 415 W Walnut St | 0.11mi | 3/2.0 (+1) | 1,924 (-0%) | 18mo | $175,500 | $91 | 74 |
| 215 Westfield Way | 0.50mi | 3/2.0 (+1) | 1,761 (-9%) | 2mo | $325,000 | $185 | 55 |
| 409 S Carter St | 0.30mi | 2/2.0 | 1,658 (-14%) | 9mo | $229,900 | $139 | 55 |
| 303 W Walnut St | 0.27mi | 3/2.0 (+1) | 1,732 (-10%) | 19mo | $325,000 | $188 | 50 |
| 714 Dixie Ln | 0.68mi | 3/2.5 (+1) | 1,850 (-4%) | 10mo | $320,000 | $173 | 46 |
| 702 Dixie Ln | 0.67mi | 3/2.0 (+1) | 1,683 (-13%) | 5mo | $299,000 | $178 | 38 |
| 704 Dixie Ln | 0.67mi | 3/2.5 (+1) | 2,132 (+10%) | 20mo | $369,500 | $173 | 28 |
Match score weights: distance 35% · size 25% · config 20% · recency 20%. Top-matched comps best support the ARV.
Projected returns pro-forma
-3.0% appreciation · 3.0% rent growth · sell at horizon
- IRR
- -8.1%
- Equity multiple
- 0.70×
- Total profit
- $-14,134
- Equity at exit
- $25,333
- IRR
- 1.5%
- Equity multiple
- 1.11×
- Total profit
- $5,017
- Equity at exit
- $14,690
Cash invested: $47,572 (down + closing). Projections, not guarantees.
Landlord ↔ Tenant lean methodology
- Overall (STATE)
- 87 Strongly Landlord-Friendly
- State Texas
- 87 Strongly Landlord-Friendly · R+5
- County
- — inherits STATE
- City
- — inherits STATE
ZIP-level market 75491
- Home prices YoY
- -8.6%
- Active inventory
- 109
- Price-to-rent
- 8.1×
Monthly cashflow live
- Estimated rent
- $1,752 medium interval (Pro) →
- Mortgage (P&I)
- −$891
- Tax est. 1.5%
- −$212 /mo · $2,548/yr
- Insurance
- −$71
- HOA
- −$0
- Vacancy / Maint / Mgmt
- −$368
- Net cashflow
- $210
Break-even live
UW: 25.0% down · 7.5% · 30yr · 1.5% tax · 5.0% vac · 8.0% maint · 8.0% mgmt
Financing live
Cash to close
- Down payment
- $42,475
- Closing costs
- $5,097
- Reserves months
- —
- Total cash needed
- —
Loan-product check · same deal, 3 products live
Conventional
25% down · 7.5% · 30yr
- Down + closing
- —
- Monthly P&I
- —
- Monthly cashflow
- —
- DSCR
- —
- Eligible?
- —
Personal DTI + credit; lowest rate.
DSCR
20% down · 8.5% · 30yr
- Down + closing
- —
- Monthly P&I
- —
- Monthly cashflow
- —
- DSCR
- —
- Eligible?
- —
No personal income docs; deal must DSCR.
Hard money
10% down · 12.0% · 12mo
- Down + closing
- —
- Monthly P&I
- —
- Monthly cashflow
- —
- DSCR
- —
- Eligible?
- —
Short-term bridge; refi at stabilization.
Rent comps 4 comps
| Address | Beds | Baths | Sqft | Rent | $/sqft | DOM | Units | Dist |
|---|---|---|---|---|---|---|---|---|
| 107 E Miller Whitewright, TX | 3.0 | 2.0 | 1226 | $1,725 | $1.41 | 1d | 1 | 0.61mi |
| 706 Dixie Ln Whitewright, TX | 3.0 | 2.5 | 1806 | $1,950 | $1.08 | 1d | 1 | 0.65mi |
| 201 S May St #1 Whitewright, TX | 3.0 | 2.5 | 1229 | $1,595 | $1.30 | 15d | 1 | 0.78mi |
| 201 S May St Whitewright, TX | 3.0 | 2.5 | 1229 | $1,595 | $1.30 | 1d | 1 | 0.78mi |
Listing history 3 events
-
2026-01-24status Pending
-
2026-01-18price $169,900
-
2025-11-27$189,000 Active
ⓘ Source: listings_history table (triggers on properties + properties_extension) + one-shot
backfill from property_details.listing_events for pre-trigger history.
Climate risk First Street
- Flood 1/10 Low FEMA zone X (unshaded) · 0% chance over 30 yrs
- Wildfire 7/10 Severe
- Heat 7/10 Severe 7 d/yr ≥110°F today · 21 d/yr by 30 yrs out
- Wind 6/10 Major 27% chance of damaging wind over 30 yrs
- Air quality 2/10 Low 1 unhealthy d/yr today · 2 by 30 yrs out
Nearby sold comps map
Loading sold comps map…
Walkable amenities ~0.75 mi
Loading nearby amenities…
Taxation est. · year 1
- Rental income
- $21,024
- − Mortgage interest
- −$9,517
- − Property taxes
- −$2,548
- − Insurance
- −$850
- − Repairs & maintenance
- −$1,682
- − Management
- −$1,682
- − Depreciation
- −$4,943
- Taxable loss
- −$198
- Est. tax savings @ 24.0%
- +$47
- After-tax cash flow
- $2,567/yr
For passive investors: Depreciation is non-cash, so a rental often shows a tax loss while cash-flowing — sheltering income. Rental losses are passive: they offset passive income freely, and up to $25,000/yr can offset ordinary (W-2) income if you actively participate and your MAGI is under $100k (phasing out to $0 by $150k); unused losses carry forward. On sale, claimed depreciation is recaptured at up to 25%, and gains may owe capital-gains tax (a 1031 exchange can defer both). Figures are a year-1 estimate at your 24.0% rate — not tax advice; consult a CPA.
Condition & rehab AI · 13 photos
The home is in fair condition with moderate repairs and maintenance needed. Painting the exterior siding and interior walls, and landscaping the yard would significantly increase its resale and rental value.
Repairs flagged
- Moderate exterior siding — The exterior siding shows signs of wear and discoloration.
- Moderate interior walls/paint — The interior walls and paint show signs of wear and discoloration.
- Moderate landscaping — The landscaping appears overgrown and in need of maintenance.
Value-add opportunities
- Resale paint exterior siding — Painting the exterior siding will improve the home's curb appeal and make it more attractive to potential buyers.
- Resale paint interior walls — Painting the interior walls will improve the home's appearance and make it more attractive to potential buyers.
- Both landscape and maintain yard — Landscape and maintain the yard will improve the home's curb appeal and make it more attractive to potential buyers and renters.
Renovation cost estimate screening
| Repair item | Severity | Est. cost |
|---|---|---|
| exterior siding · The exterior siding shows signs of wear and discoloration. | Moderate | $3,000–15,000 |
| interior walls/paint · The interior walls and paint show signs of wear and discoloration. | Moderate | $3,000–15,000 |
| landscaping · The landscaping appears overgrown and in need of maintenance. | Moderate | $3,000–15,000 |
| Total estimated repair cost · 3 items | $9,000–45,000 |
Value-add ROI direction
- Resale paint exterior siding — Painting the exterior siding will improve the home's curb appeal and make it more attractive to potential buyers. ↑
- Resale paint interior walls — Painting the interior walls will improve the home's appearance and make it more attractive to potential buyers. ↑
- Both landscape and maintain yard — Landscape and maintain the yard will improve the home's curb appeal and make it more attractive to potential buyers and renters. ↑
ⓘ Cost ranges are severity-bucket heuristics (US national rule-of-thumb). Get contractor quotes + a written scope before underwriting a rehab budget.
Schools (NCES district)
- District
- Whitewright ISD
- NCES district ID
- 4845670
- Math proficiency
- 57% ▲ 1.00%
- Reading proficiency
- 49% ▲ 2.00%
- Median HH income
- $49,969
- Composite
- 45.31/100
- National rank
- #2648
- State rank
- #134 of 826 in TX
Livability — Whitewright
- Score
- 68/100
- State rank
- #457
- US rank
- #9255
Category grades
Schools grade is shown separately in the Schools card above.
Census & demographics
- Census place
- Whitewright, TX
- Population (ZIP)
- 5,428
Population outlook (Grayson County) Hauer SSP2
- Today (2025)
- 134,540 people
- By 2030
- 138,653 · +3.1%
- By 2040
- 145,958 · +8.5%
- By 2050
- 151,218 · +12.4%
- By 2075
- 161,802 · +20.3%
- By 2100
- 159,036 · +18.2%
Race, ethnicity, and origin ACS 2023
- Neighborhood character
- Predominantly White (85%)
- Race & ethnicity
- White 85% Two or more races 7% Hispanic / Latino 7% Black 2% Asian 1%
- Hispanic origin (detail)
- Mexican 5%
- Common ancestry
- Lithuanian 2% Slovak 1% Italian 1%
- Foreign-born
- 4% · Canada, China
- Languages at home
- 95% English-only · Spanish 3% German/W. Germanic 1% Other Asian/Pacific 1%
Political lean MEDSL · Grayson
- 2024 margin
- Solid R (+54.3) · D 22.5% · R 76.7%
- 2008→2024 swing
- -16.4pp toward R · 2008: -37.9pp · 2024: -54.3pp
- All cycles
- 2024: R+54.3 2020: R+49.9 2016: R+53.1 2012: R+48.0 2008: R+37.9
Not yet ingested
- Civics
- —
Market trends
- HPI YoY
- ▼ -25.85%
- Current HPI
- 273.3968
- Rent YoY
- —
- Metro
- —
- State GDP YoY
- ▲ 3.95%
- F500 in state
- 110
Industry mix (Fortune 500 HQ in TX)
| Industry | F500 HQs | Revenue |
|---|---|---|
| Energy | 16 | $1,198B |
|
||
| Technology | 5 | $198B |
|
||
| Engineering / Construction | 4 | $72B |
|
||
| Energy Services | 3 | $60B |
|
||
| Utilities | 3 | $41B |
|
||
| Healthcare | 2 | $330B |
|
||
Price history
-10.1% since first listed3 events — show timeline
- 2026-01-24 Pending — NTREIS
- 2026-01-18 Price Changed $169,900 NTREIS
- 2025-11-27 Listed $189,000 NTREIS
Cash-flow waterfall
monthlySold comps — $/sqft
last 12 mo · ≤1 miLoading sold comps…