 12-Plex
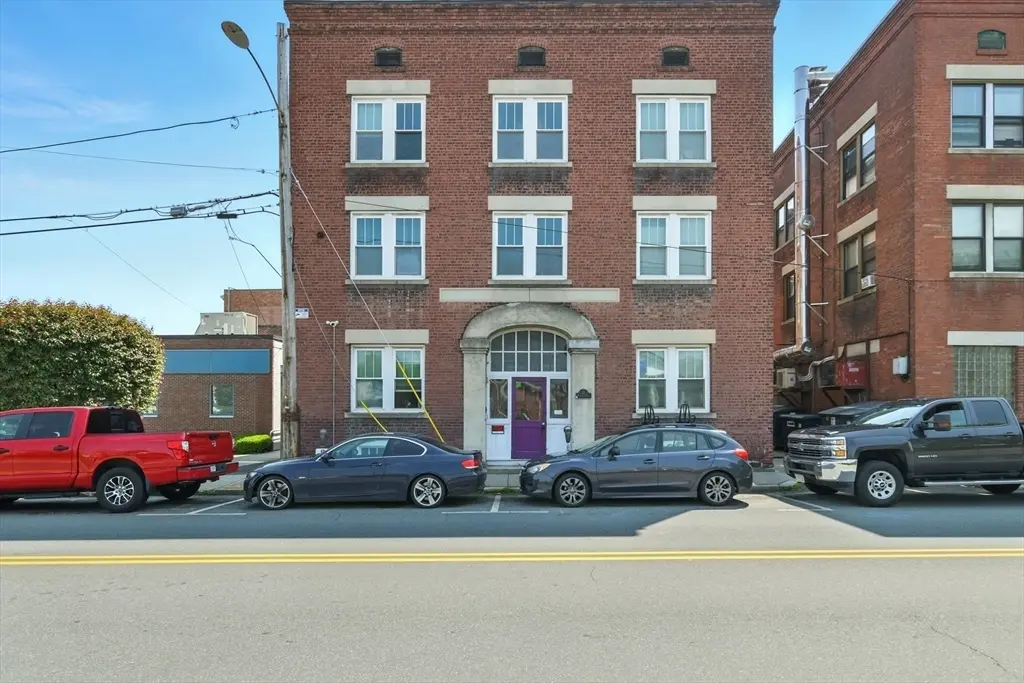
11 Conway St · Greenfield, MA
Flood risk 1/10 · Minimal
- FEMA flood zone
- X
- Chance of flooding over 30 yrs
- 0.0%
- Est. flood insurance / yr
- $473 – $860
Fire risk 1/10 · Minimal
- Est. fire insurance / yr
- $915 – $1,699
Heat risk 4/10 · Minor
- Hot days now (above 96°F)
- 7 days/yr
- Hot days in 30 yrs
- 17 days/yr
Wind risk 4/10 · Minor
- Chance of severe wind over 30 yrs
- 15.0%
Air-quality risk 2/10 · Minimal
- Unhealthy air days now
- 0 days/yr
- Unhealthy air days in 30 yrs
- 1 days/yr
Risk factors via First Street. Map © Google.
Why this score? — see what drove the D+ grade
The composite is a weighted blend of 9 inputs, each scored 0–100. Each bar is that input's sub-score; the figure is the points it added to the 100-point composite (weight × sub-score).
- Cash flow +19.7/30.0
- ARV discount +7.5/15.0
- DSCR +6.2/10.0
- 1% rule +4.1/10.0
- Rent growth +2.5/5.0
- Livability +2.5/5.0
- Condition / age +2.5/5.0
- Schools +2.0/10.0
- Appreciation +0.0/10.0
$2,100,000
🖨 Deal sheet 📄 Offer letter ✓ Due diligence
Multi-family units
County records classify this as Multi-Family (5+ Unit). Listing-text estimate: 12 units. confirmed
5+ unit building — per-unit beds/baths from public records are typically unavailable; the breakdown below (if shown) is an estimate from the listing text.
Listing remarks MLS
11 Conway St offers a rare chance to acquire a fully stabilized, cash-flowing multifamily in a prime downtown location. This well-maintained 12-unit building features a balanced mix of 6 one-bedroom units and 6 two bedroom units, with just two current vacancy. Tenants are responsible for their own electric (individually metered), while the landlord covers gas for heat and hot water. A strong rent roll provides consistent, dependable income from day one. Operational highlights include:10-year-old roof, Updated plumbing- APO, Coin-operated laundry for additional revenue, and All tenants are month-to-month, allowing for future rent optimization and strategic repositioning. This property is part of a 76 Unit Portfolio (MLS #s: 73459676, 73459674, 73459675, and 73459677.)With its excellent location, stable occupancy, and built-in value-add potential, this property is an ideal choice for both seasoned and new investors looking to expand their portfolio in Massachusetts.
Key facts
- Strong rent roll
- 10-year-old roof
- Updated plumbing
Tags
Neighborhood map
What this means for you Summary
Snapshot
- This is a 6×1bd/1ba + 6×2bd/1ba units multifamily listed at $2.10M.
Deal economics
- At list price, monthly cash flow is $2k ($30k/yr) — positive. Per door: $206/mo.
- The deal already cash-flows at list — no discount required.
- To meet the 1% rule (rent ≥ 1% of price), the offer needs to be $1.91M (9.2% below list).
- Recommended offer: $1.85M (12.0% below list) — sets the bar for market timing.
- Cap rate 7.7% vs local median 5.0% in Greenfield — top-decile yield for the area; either an underpriced asset or a hidden risk that comps aren't pricing in. Stress-test before assuming the spread holds.
Location & tenants
- Location reads: area grade D — affects rentability + tenant quality, not the cash-flow math above.
- Greenfield (town): math 15% / reading 32% proficiency, ranked #279 of 302 in MA (top 92%) — low school quality limits family demand, transient renter base, plan for 1-2y turnover.
- Market conditions: 18 active listings in the ZIP; 89 units permitted in Franklin County in 2024 (22 in 5+ unit buildings).
- At $19,068/mo this rent would consume 407% of the median local household income ($56k/yr) (locally 1270% of renters already pay >50% of income on rent) — very limited rent-growth headroom before tenants either downsize or default.
Forward outlook
- Local home prices are declining (-3.0%/yr); year-one equity from $15k of loan paydown is wiped out by about $63k of value loss. Plan a longer hold.
- Franklin County population projected at -20% by 2050 — secular population decline; favor cash flow + early exit over multi-decade hold.
Negotiation context
- It's been on market 197 days — a 12% lower offer ($1.85M) is reasonable based on typical stale-listing flexibility.
- 2 sale attempts since 3y ago with the ask held roughly flat each time — persistent listings suggest the price (not the market) is what's stuck; bring a comps-based counter.
- Current owner paid $925k; list at $2.10M implies a 127% gain — meaningful room to come down on a strong offer.
Risks & watch-outs
- Watch-outs: built in 1920 — expect roof / HVAC / electrical / plumbing capex.
Questions for the listing agent
- It's been on market 197 days. Have you received any prior offers? Is the seller open to a 12% concession, seller financing, or rate buy-down credit?
- Can we see the unit-by-unit rent roll, current vacancy, and any below-market leases? What's the average tenancy length?
- What capital expenditures (roof, boiler, parking lot, exteriors) have been made in the last 5 years, and what's planned in the next 2?
- Built in 1920 — when were the roof, HVAC, electrical panel, plumbing, and water heater last replaced?
- Why hasn't it sold? Are there any deal-killer items the seller is aware of (foundation, flood, title, zoning, code violations)?
- Is there a deadline driving the sale (1031 exchange, divorce, estate, relocation)? That informs how much negotiation room exists.
- The area grade is low — what's the realistic commute time and amenity access for the typical tenant pool here? Any planned neighborhood developments (good or bad) we should know about?
- What's the average days-on-market for RENTAL listings here right now (not sales)? A rising rental-DOM trend means longer vacancies and softer asking-rent achievability than the comps imply.
- What's the recent tenant-quality profile in this submarket — average credit score on applications, eviction rate, late-payment / NSF rate, and stable-employment percentage? A property-management company in the area should have these aggregated.
- How much new apartment / multifamily construction is in the pipeline within 1–3 miles? Heavy new supply (>2% of stock underway) typically softens rents 12–24 months out; light construction supports rent growth.
Investment metrics
- 1% rule
- 0.91% ✗
- Cap rate
- 7.71%
- Cash-on-cash
- 5.04%
- DSCR
- 1.22
- GRM
- 9.2
CMA / ARV
- ARV (median comp)
- $772,714
- List price
- $2,100,000
- Delta
- 171.77%
- Verdict
- OVERPRICED
- Comps
- 3 within 1.0 mi
Projected returns pro-forma
-3.0% appreciation · 3.0% rent growth · sell at horizon
- IRR
- -8.5%
- Equity multiple
- 0.69×
- Total profit
- $-183,745
- Equity at exit
- $313,117
- IRR
- 0.9%
- Equity multiple
- 1.07×
- Total profit
- $39,099
- Equity at exit
- $181,570
Cash invested: $588,000 (down + closing). Projections, not guarantees.
Landlord ↔ Tenant lean methodology
- Overall (STATE)
- 20 Strongly Tenant-Friendly
- State Massachusetts
- 20 Strongly Tenant-Friendly · D+15
- County
- — inherits STATE
- City
- — inherits STATE
ZIP-level market 01301
- Home prices YoY
- -24.0%
- Active inventory
- 18
- Price-to-rent
- 113.4×
Monthly cashflow live
- Estimated rent
- $19,068 medium interval (Pro) →
- Mortgage (P&I)
- −$11,013
- Tax from tax record
- −$704 /mo · $8,450/yr
- Insurance
- −$875
- HOA
- −$0
- Vacancy / Maint / Mgmt
- −$4,004
- Net cashflow
- $2,472
Break-even live
12-unit breakdown (identical units grouped — click to expand)
| Units | Beds | Baths | Est. rent |
|---|---|---|---|
| 6× units | 1 | 1 | $9,258 |
| #1 | 1 | 1 | $1,543 |
| #2 | 1 | 1 | $1,543 |
| #3 | 1 | 1 | $1,543 |
| #4 | 1 | 1 | $1,543 |
| #5 | 1 | 1 | $1,543 |
| #6 | 1 | 1 | $1,543 |
| 6× units | 2 | 1 | $9,810 |
| #7 | 2 | 1 | $1,635 |
| #8 | 2 | 1 | $1,635 |
| #9 | 2 | 1 | $1,635 |
| #10 | 2 | 1 | $1,635 |
| #11 | 2 | 1 | $1,635 |
| #12 | 2 | 1 | $1,635 |
| Total (12 units) | $19,068 | ||
UW: 25.0% down · 7.5% · 30yr · 1.5% tax · 5.0% vac · 8.0% maint · 8.0% mgmt
Financing live
Cash to close
- Down payment
- $525,000
- Closing costs
- $63,000
- Reserves months
- —
- Total cash needed
- —
Loan-product check · same deal, 3 products live
Conventional
25% down · 7.5% · 30yr
- Down + closing
- —
- Monthly P&I
- —
- Monthly cashflow
- —
- DSCR
- —
- Eligible?
- —
Personal DTI + credit; lowest rate.
DSCR
20% down · 8.5% · 30yr
- Down + closing
- —
- Monthly P&I
- —
- Monthly cashflow
- —
- DSCR
- —
- Eligible?
- —
No personal income docs; deal must DSCR.
Hard money
10% down · 12.0% · 12mo
- Down + closing
- —
- Monthly P&I
- —
- Monthly cashflow
- —
- DSCR
- —
- Eligible?
- —
Short-term bridge; refi at stabilization.
Listing history 20 events
-
2026-06-18days on market $2,100,000 Active 197 DOM
-
2026-06-17days on market $2,100,000 Active 196 DOM
-
2026-06-16days on market $2,100,000 Active 195 DOM
-
2026-06-15days on market $2,100,000 Active 194 DOM
-
2026-06-14days on market $2,100,000 Active 192 DOM
-
2026-06-13days on market $2,100,000 Active 191 DOM
-
2026-06-10days on market $2,100,000 Active 189 DOM
-
2026-06-09days on market $2,100,000 Active 188 DOM
-
2026-06-08days on market $2,100,000 Active 187 DOM
-
2026-06-07days on market $2,100,000 Active 186 DOM
-
2026-06-03days on market $2,100,000 Active 182 DOM
-
2026-06-02days on market $2,100,000 Active 181 DOM
-
2026-06-01days on market $2,100,000 Active 180 DOM
-
2026-05-31days on market $2,100,000 Active 179 DOM
-
2026-05-30days on market $2,100,000 Active 178 DOM
-
2025-12-03$2,100,000 New 979-char remark
Show marketing remark (979 chars)
11 Conway St offers a rare chance to acquire a fully stabilized, cash-flowing multifamily in a prime downtown location. This well-maintained 12-unit building features a balanced mix of 6 one-bedroom units and 6 two bedroom units, with just two current vacancy. Tenants are responsible for their own electric (individually metered), while the landlord covers gas for heat and hot water. A strong rent roll provides consistent, dependable income from day one. Operational highlights include:10-year-old roof, Updated plumbing- APO, Coin-operated laundry for additional revenue, and All tenants are month-to-month, allowing for future rent optimization and strategic repositioning. This property is part of a 76 Unit Portfolio (MLS #s: 73459676, 73459674, 73459675, and 73459677.)With its excellent location, stable occupancy, and built-in value-add potential, this property is an ideal choice for both seasoned and new investors looking to expand their portfolio in Massachusetts.
-
2023-10-06soldstatus $925,000 Sold 910-char remark
Show marketing remark (910 chars)
LOOKING FOR A LUCRATIVE INVESTMENT PROPERTY, YOU'VE FOUND IT !!! With 12 units (6 one bedroom & 6 studio) completely rented this is a great property to add to your portfolio. All units are month to month rental agreements, tenants pay their own electric (separately metered). Gas for heat and hot water paid by landlord. Security deposits being held on all units. Vacancies are never a problem !! There have been no vacant months in the past 5 years (actually, much longer !) There is a large basement with a concrete floor and a number of separate rooms that could easily be made into tenant storage and/or laundry for extra income. Rubber roof installed 2002, new boiler 2014, newer hot water system, 200 amp service, 3 phase electrical. Very well maintained and in great condition. This is in a Qualified Opportunity Zone ! As of June 2023 rent is $10,630 per month !! Cap rate 9.5%, GRM 7.84
-
2023-09-07status Under Agreement 910-char remark
Show marketing remark (910 chars)
LOOKING FOR A LUCRATIVE INVESTMENT PROPERTY, YOU'VE FOUND IT !!! With 12 units (6 one bedroom & 6 studio) completely rented this is a great property to add to your portfolio. All units are month to month rental agreements, tenants pay their own electric (separately metered). Gas for heat and hot water paid by landlord. Security deposits being held on all units. Vacancies are never a problem !! There have been no vacant months in the past 5 years (actually, much longer !) There is a large basement with a concrete floor and a number of separate rooms that could easily be made into tenant storage and/or laundry for extra income. Rubber roof installed 2002, new boiler 2014, newer hot water system, 200 amp service, 3 phase electrical. Very well maintained and in great condition. This is in a Qualified Opportunity Zone ! As of June 2023 rent is $10,630 per month !! Cap rate 9.5%, GRM 7.84
-
2023-04-11$1,000,000 New 910-char remark
Show marketing remark (910 chars)
LOOKING FOR A LUCRATIVE INVESTMENT PROPERTY, YOU'VE FOUND IT !!! With 12 units (6 one bedroom & 6 studio) completely rented this is a great property to add to your portfolio. All units are month to month rental agreements, tenants pay their own electric (separately metered). Gas for heat and hot water paid by landlord. Security deposits being held on all units. Vacancies are never a problem !! There have been no vacant months in the past 5 years (actually, much longer !) There is a large basement with a concrete floor and a number of separate rooms that could easily be made into tenant storage and/or laundry for extra income. Rubber roof installed 2002, new boiler 2014, newer hot water system, 200 amp service, 3 phase electrical. Very well maintained and in great condition. This is in a Qualified Opportunity Zone ! As of June 2023 rent is $10,630 per month !! Cap rate 9.5%, GRM 7.84
-
1999-04-05soldstatus $102,000
ⓘ Source: listings_history table (triggers on properties + properties_extension) + one-shot
backfill from property_details.listing_events for pre-trigger history.
Tax reassessment forecast MA · Partial reset (capped growth)
- Current annual tax
- $8,450 · $704/mo
- Projected year-2 tax
- $17,140 · $1,428/mo
- Expected delta
- +$8,690/yr (+$724/mo · 102.8%)
ⓘ Screening estimate from a state-policy table — verify with the county assessor before closing.
Climate risk First Street
- Flood 1/10 Low FEMA zone X · 0% chance over 30 yrs
- Wildfire 1/10 Low
- Heat 4/10 Moderate 7 d/yr ≥96°F today · 17 d/yr by 30 yrs out
- Wind 4/10 Moderate 15% chance of damaging wind over 30 yrs
- Air quality 2/10 Low 0 unhealthy d/yr today · 1 by 30 yrs out
Nearby sold comps map
Loading sold comps map…
Walkable amenities ~0.75 mi
Loading nearby amenities…
Taxation est. · year 1
- Rental income
- $228,816
- − Mortgage interest
- −$117,633
- − Property taxes
- −$8,450
- − Insurance
- −$10,500
- − Repairs & maintenance
- −$18,305
- − Management
- −$18,305
- − Depreciation
- −$61,091
- Taxable loss
- −$5,468
- Est. tax savings @ 24.0%
- +$1,312
- After-tax cash flow
- $30,975/yr
For passive investors: Depreciation is non-cash, so a rental often shows a tax loss while cash-flowing — sheltering income. Rental losses are passive: they offset passive income freely, and up to $25,000/yr can offset ordinary (W-2) income if you actively participate and your MAGI is under $100k (phasing out to $0 by $150k); unused losses carry forward. On sale, claimed depreciation is recaptured at up to 25%, and gains may owe capital-gains tax (a 1031 exchange can defer both). Figures are a year-1 estimate at your 24.0% rate — not tax advice; consult a CPA.
Schools (NCES district)
- District
- Greenfield
- NCES district ID
- 2505490
- Math proficiency
- 15% ▼ -15.00%
- Reading proficiency
- 32% ▼ -1.00%
- Median HH income
- $46,910
- Composite
- 20.45/100
- National rank
- #8580
- State rank
- #279 of 302 in MA
Livability — Greenfield
No livability data for this city. (Only ~50 U.S. cities are tracked.)
Census & demographics
- Census place
- Greenfield, MA
- County
- Franklin County · 17,876 people
- City population
- 17,876
- Metro
- Springfield, MA
- Population (ZIP)
- 17,876
- Household income
- $56,176
- Rent vs Own
- Severe rent burden
- 1270.0
Population outlook (Franklin County) Hauer SSP2
- Today (2025)
- 68,566 people
- By 2030
- 66,543 · -3.0%
- By 2040
- 60,766 · -11.4%
- By 2050
- 54,971 · -19.8%
- By 2075
- 42,642 · -37.8%
- By 2100
- 31,861 · -53.5%
Race, ethnicity, and origin ACS 2023
- Neighborhood character
- Predominantly White (87%)
- Race & ethnicity
- White 87% Hispanic / Latino 6% Two or more races 4% Black 2% Asian 2%
- Hispanic origin (detail)
- Puerto Rican 3%
- Common ancestry
- Lithuanian 9% Romanian 7% Slovak 2%
- Foreign-born
- 6% · Canada, China, Jamaica
- Languages at home
- 92% English-only · Spanish 4% Other Indo-European 1% Chinese 1%
Political lean MEDSL · Franklin
- 2024 margin
- Solid D (+37.8) · D 67.3% · R 29.6% · Other 3.1%
- 2008→2024 swing
- -9.9pp toward R · 2008: 47.7pp · 2024: 37.8pp
- All cycles
- 2024: D+37.8 2020: D+44.4 2016: D+37.0 2012: D+47.0 2008: D+47.7
Not yet ingested
- Civics
- —
Market trends
- HPI YoY
- ▼ -85.80%
- Current HPI
- 272.1354
- Rent YoY
- —
- Metro
- Springfield, MA
- State GDP YoY
- ▲ 2.28%
- F500 in state
- 38
Industry mix (Fortune 500 HQ in MA)
| Industry | F500 HQs | Revenue |
|---|---|---|
| Technology | 3 | $17B |
|
||
| Insurance | 2 | $84B |
|
||
| Retail | 2 | $76B |
|
||
| Life Sciences | 1 | $43B |
|
||
| Energy Technology | 1 | $31B |
|
||
| Aerospace / Defense | 1 | $18B |
|
||
Price history
+1958.8% since first listed5 events — show timeline
- 2025-12-03 Listed $2,100,000 MLS PIN
- 2023-10-06 Sold (MLS) $925,000 MLS PIN
- 2023-09-07 Pending — MLS PIN
- 2023-04-11 Listed $1,000,000 MLS PIN
- 1999-04-05 Sold (Public Records) $102,000 Public Records
Property tax history
+4.5%/yrLatest (2023): $8,450 · -6.1% YoY. Source: county tax records.
Cash-flow waterfall
monthlySold comps — $/sqft
last 12 mo · ≤1 miLoading sold comps…