 Fourplex
12398 Hwy 99 E · Red Bluff, CA
Flood risk No data
- FEMA flood zone
- —
- Chance of flooding over 30 yrs
- —
- Est. flood insurance / yr
- —
Fire risk No data
- Est. fire insurance / yr
- —
Heat risk No data
- Hot days now (above threshold)
- —
- Hot days in 30 yrs
- —
Wind risk No data
- Chance of severe wind over 30 yrs
- —
Air-quality risk No data
- Unhealthy air days now
- —
- Unhealthy air days in 30 yrs
- —
Risk factors via First Street. Map © Google.
Why this score? — see what drove the C grade
The composite is a weighted blend of 9 inputs, each scored 0–100. Each bar is that input's sub-score; the figure is the points it added to the 100-point composite (weight × sub-score).
- Cash flow +24.0/30.0
- DSCR +7.7/10.0
- ARV discount +7.5/15.0
- 1% rule +6.2/10.0
- Schools +4.4/10.0
- Livability +2.9/5.0
- Rent growth +2.7/5.0
- Condition / age +2.5/5.0
- Appreciation +0.0/10.0
$640,000
🖨 Deal sheet 📄 Offer letter ✓ Due diligence
Multi-family units
County records classify this as Multi-Family (5+ Unit). Listing-text estimate: 4 units. estimate disagrees with records
5+ unit building — per-unit beds/baths from public records are typically unavailable; the breakdown below (if shown) is an estimate from the listing text.
Listing remarks
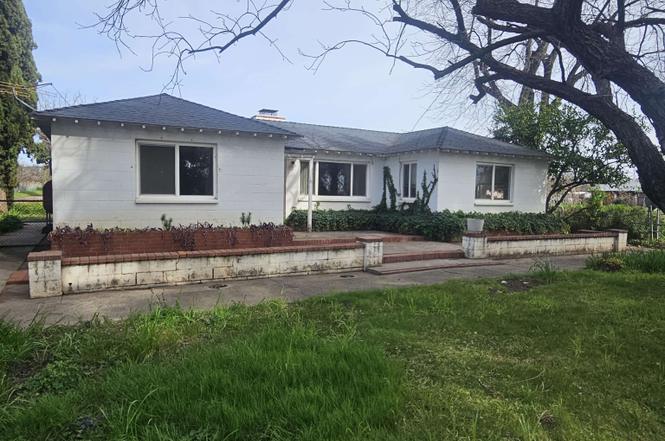
Located in the beautiful Dairyville area of Red Bluff, 5 houses of which one could be occupied by owner and have 4 separate houses as rental houses. Currently long term rentals. Details and all showings have to be arranged with listing agent. 24 to 48 hour notice required. Contact listing agent. Could be huge investment income for the business minded.
Key facts
- 2.1 acre lot
- 2 garage spots
- Built 1948
Property features AI
Finance
- Other: Lot approximately 2.1 acres (dimensions 136 x 660); Road surface to property is gravel; Directions: Hwy 99 E to property
- Financial info: Multiple rental units with listed actual rents: several units at $1,000; one unit at $798.66; one unit at $1,800
Exterior
- Parking: Detached garage; 2 garage spaces; Approximately 10 open parking spaces; Gravel drive/parking areas
- Utilities: Private well water; Septic tank sewer; Electricity available; Additional utility details: see remarks
- Home design: Residential income property; Zoned AG
- Construction: Wood siding construction (see remarks); Slab foundation
- Exterior features: Composition roof; Partial fencing (see remarks); Patio/porch details: see remarks; Outbuilding on the property; Level and wooded lot
Interior
- Kitchen: Electric oven; Electric range; Refrigerator
- Bedrooms: Multiple 2-bedroom units and one 3-bedroom unit (unit-level details below)
- Bathrooms: Multiple 1-bath units
- Heating & cooling: Electric heating; Space heater; Wood heating; Kerosene heating; Wall/window air conditioning units
- Interior features: Double pane windows; See remarks for additional interior details; Wood burning stove fireplace
- Laundry & utility: See remarks for laundry features
Neighborhood map
What this means for you Summary
Snapshot
- This is a 4 × 3-bed/1.5-bath units multifamily listed at $640k.
Deal economics
- At list price, monthly cash flow is $1k ($15k/yr) — positive. Per door: $312/mo.
- The deal already cash-flows at list — no discount required.
- Meets the 1% rule at list price ($7k rent vs $640k).
- Recommended offer: $582k (9.0% below list) — sets the bar for market timing.
- Cap rate 8.6% vs local median 3.7% in Red Bluff — top-decile yield for the area; either an underpriced asset or a hidden risk that comps aren't pricing in. Stress-test before assuming the spread holds.
Location & tenants
- Location reads 58/100 on livability (#698 in CA) — a working-class tenant base; expect higher turnover. Strengths: health & safety A+, housing A-; Watch: cost of living D, crime F, amenities F.
- Lassen View Union Elementary (rural): math 47% / reading 56% proficiency, ranked #142 of 517 in CA (top 28%) — acceptable for families but not a draw, mixed tenant base, ~2y average lease.
- Market conditions: Rents flat; 262 active listings in the ZIP; 186 units permitted in Tehama County in 2024 (0 in 5+ unit buildings).
- At $7,180/mo this rent would consume 130% of the median local household income ($66k/yr) (locally 981% of renters already pay >50% of income on rent) — very limited rent-growth headroom before tenants either downsize or default.
Forward outlook
- Local home prices are declining (-3.0%/yr); year-one equity from $4k of loan paydown is wiped out by about $19k of value loss. Plan a longer hold.
- Tehama County population projected at -14% by 2050 — secular population decline; favor cash flow + early exit over multi-decade hold.
Negotiation context
- It's been on market 106 days — a 9% lower offer ($582k) is reasonable based on typical stale-listing flexibility.
Risks & watch-outs
- Watch-outs: built in 1948 — expect roof / HVAC / electrical / plumbing capex.
Questions for the listing agent
- It's been on market 106 days. Have you received any prior offers? Is the seller open to a 9% concession, seller financing, or rate buy-down credit?
- Can we see the unit-by-unit rent roll, current vacancy, and any below-market leases? What's the average tenancy length?
- What capital expenditures (roof, boiler, parking lot, exteriors) have been made in the last 5 years, and what's planned in the next 2?
- Built in 1948 — when were the roof, HVAC, electrical panel, plumbing, and water heater last replaced?
- Why hasn't it sold? Are there any deal-killer items the seller is aware of (foundation, flood, title, zoning, code violations)?
- Is there a deadline driving the sale (1031 exchange, divorce, estate, relocation)? That informs how much negotiation room exists.
- Crime grade is F in this area — have there been break-ins, vandalism, or insurance claims at this property in the last 3 years? What carrier currently insures it and at what premium?
- What's the average days-on-market for RENTAL listings here right now (not sales)? A rising rental-DOM trend means longer vacancies and softer asking-rent achievability than the comps imply.
- What's the recent tenant-quality profile in this submarket — average credit score on applications, eviction rate, late-payment / NSF rate, and stable-employment percentage? A property-management company in the area should have these aggregated.
- How much new apartment / multifamily construction is in the pipeline within 1–3 miles? Heavy new supply (>2% of stock underway) typically softens rents 12–24 months out; light construction supports rent growth.
Investment metrics
- 1% rule
- 1.12% ✓
- Cap rate
- 8.64%
- Cash-on-cash
- 8.37%
- DSCR
- 1.37
- GRM
- 7.4
CMA / ARV
No comps found within radius.
Projected returns pro-forma
-3.0% appreciation · 0.98% rent growth · sell at horizon
- IRR
- -5.9%
- Equity multiple
- 0.79×
- Total profit
- $-38,336
- Equity at exit
- $95,426
- IRR
- 1.1%
- Equity multiple
- 1.07×
- Total profit
- $13,147
- Equity at exit
- $55,336
Cash invested: $179,200 (down + closing). Projections, not guarantees.
Landlord ↔ Tenant lean methodology
- Overall (STATE)
- 18 Strongly Tenant-Friendly
- State California
- 18 Strongly Tenant-Friendly · D+13
- County
- — inherits STATE
- City
- — inherits STATE
ZIP-level market 96080
- Rents YoY
- 1.0%
- Active inventory
- 262
- Price-to-rent
- 29.7×
Monthly cashflow live
- Estimated rent
- $7,180 medium interval (Pro) →
- Mortgage (P&I)
- −$3,356
- Tax est. 1.5%
- −$800 /mo · $9,600/yr
- Insurance
- −$267
- HOA
- −$0
- Vacancy / Maint / Mgmt
- −$1,508
- Net cashflow
- $1,249
Break-even live
4-unit breakdown (identical units grouped — click to expand)
| Units | Beds | Baths | Est. rent |
|---|---|---|---|
| 4× units | 3 | 1.5 | $7,180 |
| #1 | 3 | 1.5 | $1,795 |
| #2 | 3 | 1.5 | $1,795 |
| #3 | 3 | 1.5 | $1,795 |
| #4 | 3 | 1.5 | $1,795 |
| Total (4 units) | $7,180 | ||
UW: 25.0% down · 7.5% · 30yr · 1.5% tax · 5.0% vac · 8.0% maint · 8.0% mgmt
Financing live
Cash to close
- Down payment
- $160,000
- Closing costs
- $19,200
- Reserves months
- —
- Total cash needed
- —
Loan-product check · same deal, 3 products live
Conventional
25% down · 7.5% · 30yr
- Down + closing
- —
- Monthly P&I
- —
- Monthly cashflow
- —
- DSCR
- —
- Eligible?
- —
Personal DTI + credit; lowest rate.
DSCR
20% down · 8.5% · 30yr
- Down + closing
- —
- Monthly P&I
- —
- Monthly cashflow
- —
- DSCR
- —
- Eligible?
- —
No personal income docs; deal must DSCR.
Hard money
10% down · 12.0% · 12mo
- Down + closing
- —
- Monthly P&I
- —
- Monthly cashflow
- —
- DSCR
- —
- Eligible?
- —
Short-term bridge; refi at stabilization.
Listing history 17 events
-
2026-06-19days on market $640,000 Active 106 DOM
-
2026-06-18days on market $640,000 Active 105 DOM
-
2026-06-17days on market $640,000 Active 104 DOM
-
2026-06-16days on market $640,000 Active 103 DOM
-
2026-06-15days on market $640,000 Active 102 DOM
-
2026-06-14days on market $640,000 Active 100 DOM
-
2026-06-12days on market $640,000 Active 99 DOM
-
2026-06-09days on market $640,000 Active 96 DOM
-
2026-06-08days on market $640,000 Active 95 DOM
-
2026-06-07days on market $640,000 Active 94 DOM
-
2026-06-05days on market $640,000 Active 91 DOM
-
2026-06-03days on market $640,000 Active 90 DOM
-
2026-06-02days on market $640,000 Active 89 DOM
-
2026-06-01days on market $640,000 Active 88 DOM
-
2026-05-31days on market $640,000 Active 87 DOM
-
2026-05-30days on market $640,000 Active 86 DOM
-
2026-03-05$640,000 Active
ⓘ Source: listings_history table (triggers on properties + properties_extension) + one-shot
backfill from property_details.listing_events for pre-trigger history.
Nearby sold comps map
Loading sold comps map…
Walkable amenities ~0.75 mi
Loading nearby amenities…
Taxation est. · year 1
- Rental income
- $86,160
- − Mortgage interest
- −$35,850
- − Property taxes
- −$9,600
- − Insurance
- −$3,200
- − Repairs & maintenance
- −$6,893
- − Management
- −$6,893
- − Depreciation
- −$18,618
- Taxable income
- $5,106
- Est. tax owed @ 24.0%
- −$1,226
- After-tax cash flow
- $13,766/yr
For passive investors: Depreciation is non-cash, so a rental often shows a tax loss while cash-flowing — sheltering income. Rental losses are passive: they offset passive income freely, and up to $25,000/yr can offset ordinary (W-2) income if you actively participate and your MAGI is under $100k (phasing out to $0 by $150k); unused losses carry forward. On sale, claimed depreciation is recaptured at up to 25%, and gains may owe capital-gains tax (a 1031 exchange can defer both). Figures are a year-1 estimate at your 24.0% rate — not tax advice; consult a CPA.
Schools (NCES district)
- District
- Lassen View Union Elementary
- NCES district ID
- 0621090
- Math proficiency
- 47% ▲ 4.00%
- Reading proficiency
- 56% ▲ 4.00%
- Median HH income
- $45,781
- Composite
- 43.59/100
- National rank
- #2974
- State rank
- #142 of 517 in CA
Livability — Red Bluff
- Score
- 58/100
- State rank
- #698
- US rank
- #21144
Category grades
Schools grade is shown separately in the Schools card above.
Census & demographics
- County
- Tehama County · 31,554 people
- City population
- 31,554
- Metro
- Red Bluff, CA
- Population (ZIP)
- 31,554
- Household income
- $66,076
- Rent vs Own
- Severe rent burden
- 981.0
Population outlook (Tehama County) Hauer SSP2
- Today (2025)
- 61,058 people
- By 2030
- 59,493 · -2.6%
- By 2040
- 56,076 · -8.2%
- By 2050
- 52,372 · -14.2%
- By 2075
- 43,895 · -28.1%
- By 2100
- 34,186 · -44.0%
Race, ethnicity, and origin ACS 2023
- Neighborhood character
- Predominantly White (71%)
- Race & ethnicity
- White 71% Hispanic / Latino 19% Two or more races 13% Native American 3% Black 2% Asian 1%
- Hispanic origin (detail)
- Mexican 17%
- Common ancestry
- Italian 2% Slovak 2% Lithuanian 2%
- Foreign-born
- 6% · Canada, Vietnam
- Languages at home
- 89% English-only · Spanish 9%
Political lean MEDSL · Tehama
- 2024 margin
- Solid R (+41.8) · D 27.9% · R 69.7% · Other 2.3%
- 2008→2024 swing
- -17.7pp toward R · 2008: -24.1pp · 2024: -41.8pp
- All cycles
- 2024: R+41.8 2020: R+35.6 2016: R+36.8 2012: R+27.4 2008: R+24.1
Not yet ingested
- Civics
- —
Market trends
- HPI YoY
- ▼ -139.80%
- Current HPI
- 246.877
- Rent YoY
- ▲ 0.98%
- Metro
- Red Bluff, CA
- State GDP YoY
- ▲ 3.21%
- F500 in state
- 116
Industry mix (Fortune 500 HQ in CA)
| Industry | F500 HQs | Revenue |
|---|---|---|
| Technology | 27 | $1,492B |
|
||
| Financial Services | 3 | $174B |
|
||
| Retail | 3 | $44B |
|
||
| Insurance | 3 | $26B |
|
||
| Media / Entertainment | 2 | $115B |
|
||
| Pharmaceuticals / Biotech | 2 | $62B |
|
||
Price history
1 event — show timeline
- 2026-03-05 Listed $640,000 TCAOR
Cash-flow waterfall
monthlySold comps — $/sqft
last 12 mo · ≤1 miLoading sold comps…