 Duplex
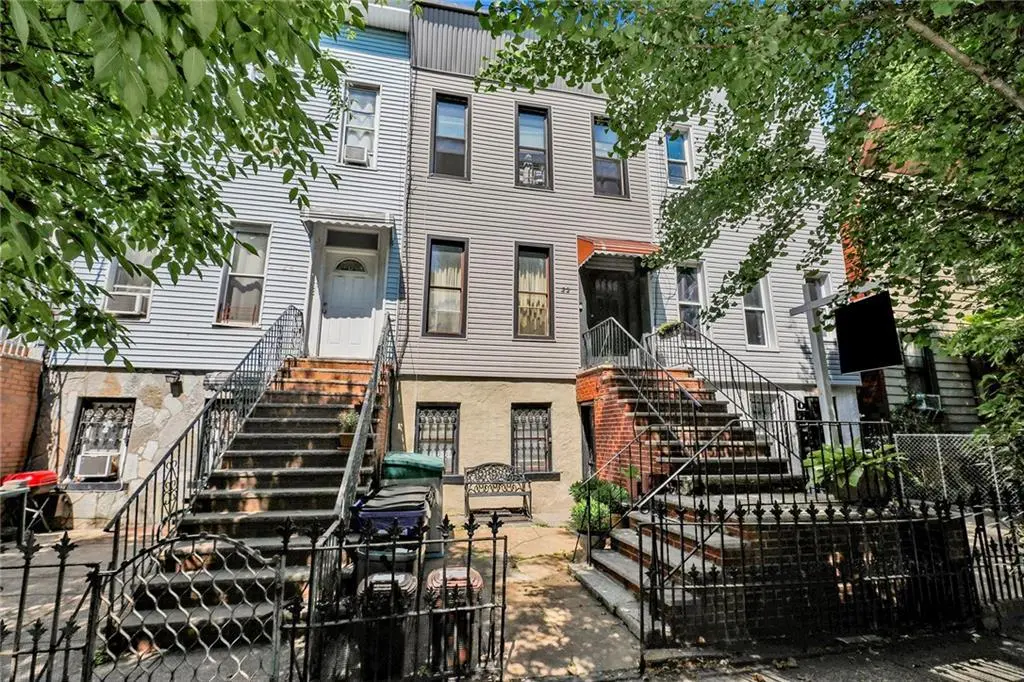
22 Roosevelt Pl · New York, NY
Flood risk 1/10 · Minimal
- FEMA flood zone
- X (unshaded)
- Chance of flooding over 30 yrs
- 0.0%
- Est. flood insurance / yr
- $507 – $1,088
Fire risk 1/10 · Minimal
- Est. fire insurance / yr
- $691 – $1,283
Heat risk 7/10 · Major
- Hot days now (above 99°F)
- 7 days/yr
- Hot days in 30 yrs
- 15 days/yr
Wind risk 6/10 · Moderate
- Chance of severe wind over 30 yrs
- 39.0%
Air-quality risk 5/10 · Moderate
- Unhealthy air days now
- 6 days/yr
- Unhealthy air days in 30 yrs
- 8 days/yr
Risk factors via First Street. Map © Google.
Why this score? — see what drove the C grade
The composite is a weighted blend of 9 inputs, each scored 0–100. Each bar is that input's sub-score; the figure is the points it added to the 100-point composite (weight × sub-score).
- ARV discount +15.0/15.0
- Cash flow +12.7/30.0
- Appreciation +10.0/10.0
- Schools +5.0/10.0
- Rent growth +4.1/5.0
- DSCR +3.8/10.0
- Livability +3.8/5.0
- Condition / age +2.5/5.0
- 1% rule +2.3/10.0
$899,000
🖨 Deal sheet 📄 Offer letter ✓ Due diligence
Multi-family units
County records classify this as Multi-Family (2-4 Unit). Listing-text estimate: 2 units. confirmed
Listing remarks
2 family, three-story townhouses with endless potential in the desirable Ocean Hill neighborhood. The garden-level owner's duplex features a spacious living room, full bathroom, dining room, and eat-in kitchen with access to the backyard. The second floor offers three bedrooms with closet space, a full bathroom with a stall shower. The top floor includes a bright living/dining area, two bedrooms, full bathroom, kitchen, storage space, and a skylight over the staircase. The unfinished basement offers exterior access and additional possibilities for customization, while the backyard provides great potential for outdoor entertaining or landscaping. Conveniently located near restaurants, bars,
Key facts
- 1,706 sq ft lot
- Built 1899
- Listed 11 days
Property features AI
Finance
- Other: Zoning: R5; Lot number 36
- Financial info: Financing options considered: exchange, bank mortgage, or cash
Exterior
- Parking: Street parking
- Utilities: Electric with circuit breakers; Gas hot water; Gas heating fuel; Steam/radiator heat
- Home design: Residential property; Two-unit multifamily (2 units); Building footprint roughly 40 x 17 ft
- Construction: Masonry construction; Flat roof; Block foundation; Building footprint approximately 680 sq ft
- Exterior features: Front yard; Back yard; Fully fenced yard; Attached building; Vinyl siding exterior
Interior
- Kitchen: Includes refrigerator; Includes stove
- Bedrooms: One unit with 2 bedrooms (upper unit); One unit with 3 bedrooms (lower unit)
- Flooring: Hardwood floors; Linoleum floors; Tile floors
- Bathrooms: Two full bathrooms and one half bathroom total; Upper unit: 1 full bathroom; Lower unit: 1 full bathroom and 1 half bathroom
- Heating & cooling: Gas-fired hot water; Steam/radiator heat; Circuit breaker electrical system
- Interior features: Refrigerator; Stove
- Laundry & utility: No central AC units reported
Neighborhood map
What this means for you Summary
Snapshot
- This is a 2 × 2-bed/?-bath units multifamily listed at $899k.
Deal economics
- At list price, monthly cash flow is $-107 ($-1k/yr) — negative. Per door: $-53/mo.
- To cash-flow at today's rent, offer at most $880k (2.1% below list).
- To meet the 1% rule (rent ≥ 1% of price), the offer needs to be $659k (26.7% below list).
- Recommended offer: $659k (26.7% below list) — sets the bar for 1% rule.
- Cap rate 6.2% vs local median 2.6% in New York — top-decile yield for the area; either an underpriced asset or a hidden risk that comps aren't pricing in. Stress-test before assuming the spread holds.
Location & tenants
- Location reads 75/100 on livability (#268 in NY, #4,188 nationally) — a middle-class / working-renter tenant base. Strengths: amenities A+, commute A+, health & safety A; Watch: crime F, cost of living F.
- Market conditions: Rents rising fast (+6.4%/yr); 152 active listings in the ZIP; 2 comparable units currently listed for rent nearby; 10,063 units permitted in Kings County in 2024 (9,789 in 5+ unit buildings).
- At $6,589/mo this rent would consume 127% of the median local household income ($62k/yr) (locally 6960% of renters already pay >50% of income on rent) — very limited rent-growth headroom before tenants either downsize or default.
Forward outlook
- In year one you build about $96k of equity ($6k loan paydown + $90k appreciation (10.0% local appreciation)).
- Kings County population projected at +13% by 2050 — modest demand growth; plan on rents tracking national, not racing it.
- By year 2, paydown + projected appreciation supports a ~$155k cash-out refi (75% LTV) — recoverable capital for the next deal without selling this one.
Negotiation context
- Only 12 days on market — expect competitive offers; lowballing is unlikely to land.
- Current owner paid $80k; list at $899k implies a 1024% gain — meaningful room to come down on a strong offer.
Risks & watch-outs
- Watch-outs: built in 1899 — expect roof / HVAC / electrical / plumbing capex.
- Climate carrying-cost: major wind risk, 39% chance of damaging wind over 30y; extreme-heat days projected 7→15/yr by 2055 (HVAC capex compounding) — expect insurance premiums to compound above CPI over the hold.
Questions for the listing agent
- What do current leases actually rent for vs. the listed asking? Can we see a recent rent roll and the last 12 months of T-12 income?
- Can we see the unit-by-unit rent roll, current vacancy, and any below-market leases? What's the average tenancy length?
- What capital expenditures (roof, boiler, parking lot, exteriors) have been made in the last 5 years, and what's planned in the next 2?
- Built in 1899 — when were the roof, HVAC, electrical panel, plumbing, and water heater last replaced?
- Is there a deadline driving the sale (1031 exchange, divorce, estate, relocation)? That informs how much negotiation room exists.
- Schools are B-rated — typically a magnet for longer-tenancy family renters. What's the average tenant stay here, and is there a school-zone premium baked into asking?
- Crime grade is F in this area — have there been break-ins, vandalism, or insurance claims at this property in the last 3 years? What carrier currently insures it and at what premium?
- What's the average days-on-market for RENTAL listings here right now (not sales)? A rising rental-DOM trend means longer vacancies and softer asking-rent achievability than the comps imply.
- What's the recent tenant-quality profile in this submarket — average credit score on applications, eviction rate, late-payment / NSF rate, and stable-employment percentage? A property-management company in the area should have these aggregated.
- How much new apartment / multifamily construction is in the pipeline within 1–3 miles? Heavy new supply (>2% of stock underway) typically softens rents 12–24 months out; light construction supports rent growth.
Investment metrics
- 1% rule
- 0.73% ✗
- Cap rate
- 6.15%
- Cash-on-cash
- -0.51%
- DSCR
- 0.98
- GRM
- 11.4
CMA / ARV
- ARV (on-the-fly)
- $1,186,656
- Comps found
- 5
Show comp detail 5 sales within ~0.75 mi
| Address | Dist | Beds/Ba | Sqft | Sold | Price | $/sf | Match |
|---|---|---|---|---|---|---|---|
| 174 Sumpter St | 0.23mi | 5/3.0 (+1) | 2,062 (-2%) | 2mo | $1,150,000 | $558 | 77 |
| 323 Bainbridge St | 0.54mi | 4/3.0 | 2,128 (+1%) | 6mo | $1,200,000 | $564 | 65 |
| 235 Marion St | 0.36mi | 5/3.0 (+1) | 2,040 (-3%) | 7mo | $1,130,000 | $554 | 65 |
| 168 Hull St | 0.39mi | 5/— (+1) | 1,942 (-8%) | 14mo | $1,375,000 | $708 | 52 |
| 702 Chauncey St | 0.66mi | 5/3.0 (+1) | 1,800 (-14%) | 15mo | $1,050,000 | $583 | 25 |
Match score weights: distance 35% · size 25% · config 20% · recency 20%. Top-matched comps best support the ARV.
Projected returns pro-forma
10.0% appreciation · 6.44% rent growth · sell at horizon
- IRR
- 24.9%
- Equity multiple
- 3.01×
- Total profit
- $505,963
- Equity at exit
- $809,890
- IRR
- 22.7%
- Equity multiple
- 7.16×
- Total profit
- $1,549,399
- Equity at exit
- $1,746,559
Cash invested: $251,720 (down + closing). Projections, not guarantees.
Landlord ↔ Tenant lean methodology
- Overall (CITY)
- 0 Strongly Tenant-Friendly
- State New York
- 15 Strongly Tenant-Friendly · D+10
- County
- — inherits STATE
- City New York
- 0 Strongly Tenant-Friendly · D+34
ZIP-level market 11233
- Home prices YoY
- 2.9%
- Rents YoY
- 6.4%
- Active inventory
- 152
- Price-to-rent
- 22.7×
Monthly cashflow live
- Estimated rent
- $6,589 high interval (Pro) →
- Mortgage (P&I)
- −$4,714
- Tax from tax record
- −$223 /mo · $2,675/yr
- Insurance
- −$375
- HOA
- −$0
- Vacancy / Maint / Mgmt
- −$1,384
- Net cashflow
- $-107
Break-even live
2-unit breakdown (identical units grouped — click to expand)
| Units | Beds | Baths | Est. rent |
|---|---|---|---|
| 2× units | 2 | — | $6,590 |
| #1 | 2 | — | $3,295 |
| #2 | 2 | — | $3,295 |
| Total (2 units) | $6,589 | ||
UW: 25.0% down · 7.5% · 30yr · 1.5% tax · 5.0% vac · 8.0% maint · 8.0% mgmt
Financing live
Cash to close
- Down payment
- $224,750
- Closing costs
- $26,970
- Reserves months
- —
- Total cash needed
- —
Loan-product check · same deal, 3 products live
Conventional
25% down · 7.5% · 30yr
- Down + closing
- —
- Monthly P&I
- —
- Monthly cashflow
- —
- DSCR
- —
- Eligible?
- —
Personal DTI + credit; lowest rate.
DSCR
20% down · 8.5% · 30yr
- Down + closing
- —
- Monthly P&I
- —
- Monthly cashflow
- —
- DSCR
- —
- Eligible?
- —
No personal income docs; deal must DSCR.
Hard money
10% down · 12.0% · 12mo
- Down + closing
- —
- Monthly P&I
- —
- Monthly cashflow
- —
- DSCR
- —
- Eligible?
- —
Short-term bridge; refi at stabilization.
Rent comps 2 comps
| Address | Beds | Baths | Sqft | Rent | $/sqft | DOM | Units | Dist |
|---|---|---|---|---|---|---|---|---|
| 358 Irving Ave Brooklyn, NY | 5.0 | 4.0 | 844 | $1,500 | $1.78 | 20d | 1 | 1.43mi |
| 1065 Sterling Pl Unit Gdn Brooklyn, NY | 3.0 | 1.5 | 1736 | $5,995 | $3.45 | 6d | 1 | 1.47mi |
Listing history 7 events
-
2026-06-16days on market $899,000 Active 12 DOM
-
2026-06-15days on market $899,000 Active 11 DOM
-
2026-06-13days on market $899,000 Active 9 DOM
-
2026-06-09days on market $899,000 Active 5 DOM
-
2026-06-08days on market $899,000 Active 4 DOM
-
2026-06-07remarks 699-char remark
-
2026-06-07$899,000 Active 3 DOM
ⓘ Source: listings_history table (triggers on properties + properties_extension) + one-shot
backfill from property_details.listing_events for pre-trigger history.
Tax reassessment forecast NY · Partial reset (capped growth)
- Current annual tax
- $2,675 · $223/mo
- Projected year-2 tax
- $8,934 · $745/mo
- Expected delta
- +$6,259/yr (+$522/mo · 233.9%)
ⓘ Screening estimate from a state-policy table — verify with the county assessor before closing.
Climate risk First Street
- Flood 1/10 Low FEMA zone X (unshaded) · 0% chance over 30 yrs
- Wildfire 1/10 Low
- Heat 7/10 Severe 7 d/yr ≥99°F today · 15 d/yr by 30 yrs out
- Wind 6/10 Major 39% chance of damaging wind over 30 yrs
- Air quality 5/10 Major 6 unhealthy d/yr today · 8 by 30 yrs out
Nearby sold comps map
Loading sold comps map…
Walkable amenities ~0.75 mi
Loading nearby amenities…
Taxation est. · year 1
- Rental income
- $79,068
- − Mortgage interest
- −$50,358
- − Property taxes
- −$2,675
- − Insurance
- −$4,495
- − Repairs & maintenance
- −$6,325
- − Management
- −$6,325
- − Depreciation
- −$26,153
- Taxable loss
- −$17,264
- Est. tax savings @ 24.0%
- +$4,143
- After-tax cash flow
- $2,863/yr
For passive investors: Depreciation is non-cash, so a rental often shows a tax loss while cash-flowing — sheltering income. Rental losses are passive: they offset passive income freely, and up to $25,000/yr can offset ordinary (W-2) income if you actively participate and your MAGI is under $100k (phasing out to $0 by $150k); unused losses carry forward. On sale, claimed depreciation is recaptured at up to 25%, and gains may owe capital-gains tax (a 1031 exchange can defer both). Figures are a year-1 estimate at your 24.0% rate — not tax advice; consult a CPA.
Schools (NCES district)
No district data.
Livability — New York
- Score
- 75/100
- State rank
- #268
- US rank
- #4188
Category grades
Schools grade is shown separately in the Schools card above.
Census & demographics
- Census place
- New York, NY
- County
- Kings County · 2,614,986 people
- City population
- 7,731,280
- Metro
- New York-Newark-Jersey City, NY-NJ-PA
- Population (ZIP)
- 81,822
- Household income
- $62,411
- Rent vs Own
- Severe rent burden
- 6960.0
Population outlook (Kings County) Hauer SSP2
- Today (2025)
- 2,847,441 people
- By 2030
- 2,937,006 · +3.1%
- By 2040
- 3,095,491 · +8.7%
- By 2050
- 3,228,968 · +13.4%
- By 2075
- 3,321,723 · +16.7%
- By 2100
- 3,111,387 · +9.3%
Race, ethnicity, and origin ACS 2023
- Neighborhood character
- Predominantly Black (65%)
- Race & ethnicity
- Black 65% Hispanic / Latino 16% White 12% Two or more races 8% Asian 2%
- Hispanic origin (detail)
- Puerto Rican 5% Dominican 5%
- Common ancestry
- Hispanic 1% Romanian 1% Lithuanian 1%
- Foreign-born
- 25% · Canada, Mexico, China
- Languages at home
- 80% English-only · Spanish 12% French/Haitian/Cajun 3% Other Indo-European 1%
Political lean MEDSL · Kings
- 2024 margin
- Solid D (+44.0) · D 72.0% · R 28.0%
- 2008→2024 swing
- -15.5pp toward R · 2008: 59.4pp · 2024: 44.0pp
- All cycles
- 2024: D+44.0 2020: D+54.8 2016: D+61.8 2012: D+63.9 2008: D+59.4
Not yet ingested
- Civics
- —
Market trends
- HPI YoY
- ▲ 18.31%
- Current HPI
- 645.4828
- Rent YoY
- ▲ 6.44%
- Metro
- New York-Newark-Jersey City, NY-NJ-PA
- State GDP YoY
- ▲ 2.60%
- F500 in state
- 92
Industry mix (Fortune 500 HQ in NY)
| Industry | F500 HQs | Revenue |
|---|---|---|
| Financial Services | 10 | $950B |
|
||
| Consumer Goods | 9 | $162B |
|
||
| Insurance | 4 | $225B |
|
||
| Telecommunications | 2 | $144B |
|
||
| Pharmaceuticals | 2 | $112B |
|
||
| Media / Entertainment | 2 | $69B |
|
||
Price history
+1023.8% since first listed2 events — show timeline
- 2026-06-04 Listed $899,000 BNYMLS
- 2004-03-24 Sold (Public Records) $80,000 Public Records
Property tax history
+6.5%/yrLatest (2025): $2,675 · +3.3% YoY. Source: county tax records.
Cash-flow waterfall
monthlySold comps — $/sqft
last 12 mo · ≤1 miLoading sold comps…