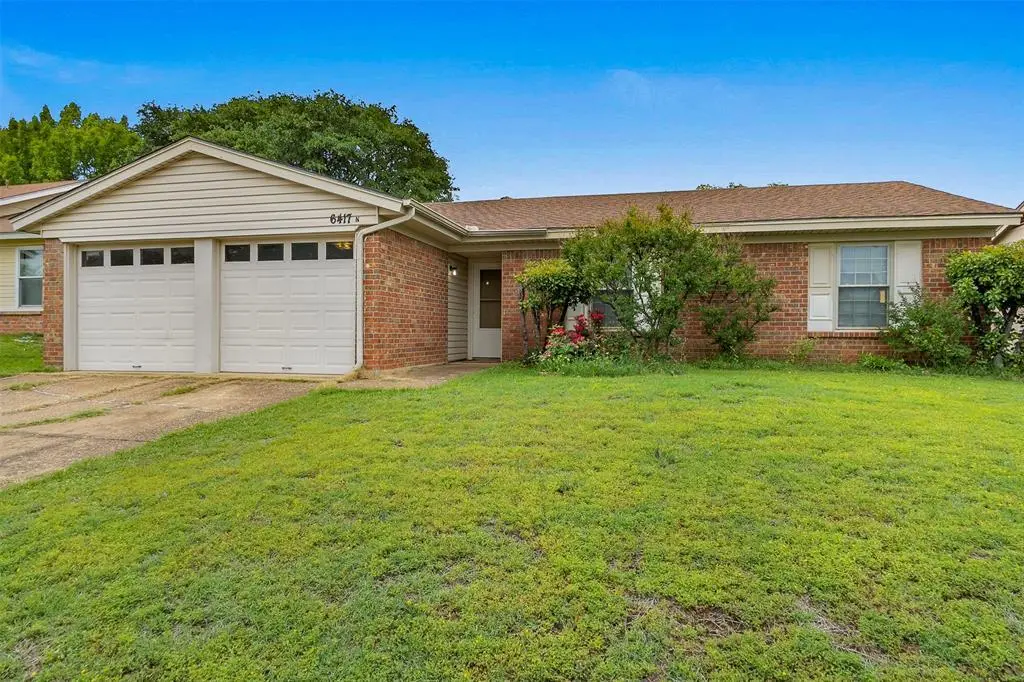
6417 Kary Lynn Dr N · Watauga, TX
Flood risk 1/10 · Minimal
- FEMA flood zone
- X (unshaded)
- Chance of flooding over 30 yrs
- 0.0%
- Est. flood insurance / yr
- $507 – $1,088
Fire risk 1/10 · Minimal
- Est. fire insurance / yr
- $1,222 – $2,270
Heat risk 7/10 · Major
- Hot days now (above 109°F)
- 7 days/yr
- Hot days in 30 yrs
- 23 days/yr
Wind risk 4/10 · Minor
- Chance of severe wind over 30 yrs
- 21.0%
Air-quality risk 3/10 · Minor
- Unhealthy air days now
- 3 days/yr
- Unhealthy air days in 30 yrs
- 4 days/yr
Risk factors via First Street. Map © Google.
Why this score? — see what drove the C- grade
The composite is a weighted blend of 9 inputs, each scored 0–100. Each bar is that input's sub-score; the figure is the points it added to the 100-point composite (weight × sub-score).
- ARV discount +13.9/15.0
- Cash flow +13.6/30.0
- Schools +4.8/10.0
- 1% rule +4.4/10.0
- DSCR +4.1/10.0
- Livability +3.8/5.0
- Rent growth +3.6/5.0
- Condition / age +2.5/5.0
- Appreciation +0.0/10.0
$225,000
🖨 Deal sheet 📄 Offer letter ✓ Due diligence
Listing remarks
Charming one-owner home in Keller ISD offering 3 bedrooms and 1 bath, move-in ready with the opportunity to update at your own pace. Lovingly maintained, the home features a welcoming living room with a wood-burning floor-to-ceiling brick fireplace and ceiling fan. The kitchen includes an electric range, dishwasher, refrigerator, and an eat-in dining area highlighted by a statement chandelier, plus additional seating at the breakfast bar. A conveniently located laundry room sits just off the kitchen. The primary bedroom is generously sized with a walk-in closet and direct access to a Hollywood-style bath with a shower-tub combo. Additional features include an attached 2-car garage with open
Key facts
- Eat-in dining area
- Laundry room
- Walk-in closet
Tags
Property features AI
Finance
- Other: Deed restrictions; Possession at closing/funding or negotiable; Subdivision: Bristol Square
- Financial info: Accepts Cash, Conventional, FHA, and VA financing
- HOA & community: No homeowners association
Exterior
- Parking: Driveway; Attached garage (2-car garage, approx. 20' x 20'); 2 covered parking spaces
- Utilities: City water; City sewer; Cable available
- Home design: Single-family residence; One story; Residential property
- Construction: Built in 1981 (preowned); Brick and siding construction; Slab foundation; Composition and tile roof
- Exterior features: Patio; Backyard with chain link fence; Landscaped interior lot in a subdivision
Interior
- Kitchen: Eat-in kitchen with breakfast bar; Electric range; Dishwasher; Garbage disposal; Refrigerator
- Bedrooms: 3 bedrooms (all on main level); Primary bedroom on main level with walk-in closet
- Flooring: Carpet; Linoleum
- Bathrooms: 1 full bathroom (Hollywood bath, on main level)
- Interior features: Cable TV available; Chandelier; Eat-in kitchen; High-speed internet available; Walk-in closet(s); Window coverings; Fireplace (wood burning); One-level living; 8 total rooms; 1 living area; 1 dining area
- Laundry & utility: Full-size washer/dryer area; Washer and dryer included; Electric dryer hookup; Laundry in kitchen / utility room; Separate utility room
Neighborhood map
What this means for you Summary
Snapshot
- This is a 3-bed/2.0-bath single-family listed at $225k.
Deal economics
- At list price, monthly cash flow is $11 ($126/yr) — positive.
- The deal already cash-flows at list — no discount required.
- To meet the 1% rule (rent ≥ 1% of price), the offer needs to be $211k (6.3% below list).
- Recommended offer: $211k (6.3% below list) — sets the bar for 1% rule.
- Cap rate 6.3% vs local median 4.6% in Watauga — top-decile yield for the area; either an underpriced asset or a hidden risk that comps aren't pricing in. Stress-test before assuming the spread holds.
Location & tenants
- Location reads 76/100 on livability (#105 in TX, #3,500 nationally) — a middle-class / working-renter tenant base. Strengths: crime A+, cost of living A+, housing A+; Watch: amenities F, commute F.
- Keller ISD (urban): math 50% / reading 54% proficiency, ranked #91 of 826 in TX (top 11%) — acceptable for families but not a draw, mixed tenant base, ~2y average lease; only 19% free/reduced lunch — higher-income household profile.
- Market conditions: Rents rising fast (+4.3%/yr); 130 active listings in the ZIP; 40 comparable units currently listed for rent nearby; rentals at typical pace (median 24d on market — plan ~3-4 weeks tenant-placement turnaround); solid renter incomes; 18,938 units permitted in Tarrant County in 2024 (8,336 in 5+ unit buildings).
Forward outlook
- Local home prices are declining (-3.0%/yr); year-one equity from $2k of loan paydown is wiped out by about $7k of value loss. Plan a longer hold.
- Tarrant County population projected at +41% by 2050 — long-run rental-demand tailwind backs the buy-and-hold thesis.
Negotiation context
- It's been on market 25 days — a 2% lower offer ($222k) is reasonable based on typical stale-listing flexibility.
Risks & watch-outs
- Climate carrying-cost: extreme-heat days projected 7→23/yr by 2055 (HVAC capex compounding) — expect insurance premiums to compound above CPI over the hold.
Questions for the listing agent
- Is there a deadline driving the sale (1031 exchange, divorce, estate, relocation)? That informs how much negotiation room exists.
- What's the average days-on-market for RENTAL listings here right now (not sales)? A rising rental-DOM trend means longer vacancies and softer asking-rent achievability than the comps imply.
- What's the recent tenant-quality profile in this submarket — average credit score on applications, eviction rate, late-payment / NSF rate, and stable-employment percentage? A property-management company in the area should have these aggregated.
- How much new for-sale + rental construction is in the pipeline within 1–3 miles? Heavy new supply typically softens prices + rents 12–24 months out; constrained supply supports both.
Investment metrics
- 1% rule
- 0.94% ✗
- Cap rate
- 6.35%
- Cash-on-cash
- 0.20%
- DSCR
- 1.01
- GRM
- 8.9
CMA / ARV
- ARV (median comp)
- $262,497
- List price
- $225,000
- Delta
- -14.28%
- Verdict
- UNDERPRICED
- Comps
- 20 within 1.0 mi
Show comp detail 12 sales within ~0.75 mi
| Address | Dist | Beds/Ba | Sqft | Sold | Price | $/sf | Match |
|---|---|---|---|---|---|---|---|
| 6417 Kary Lynn Dr N | 0.00mi | 3/1.0 | 1,130 (0%) | 0mo | $225,000 | $199 | 96 |
| 6357 Cascade Cir | 0.12mi | 3/2.0 | 1,112 (-2%) | 2mo | $274,900 | $247 | 91 |
| 6501 Starnes Rd | 0.33mi | 3/2.0 | 1,251 (+11%) | 2mo | $310,000 | $248 | 64 |
| 6636 Fair Meadows Dr | 0.44mi | 3/2.0 | 1,244 (+10%) | 2mo | $297,000 | $239 | 61 |
| 5920 Oak Hill Rd | 0.43mi | 3/2.0 | 1,251 (+11%) | 1mo | $269,000 | $215 | 61 |
| 6028 Herschel Dr | 0.43mi | 3/2.0 | 1,269 (+12%) | 0mo | $250,000 | $197 | 59 |
| 7924 Lazy Brook Dr | 0.68mi | 3/2.0 | 1,189 (+5%) | 1mo | $289,900 | $244 | 59 |
| 5929 Robin Dr | 0.40mi | 3/2.0 | 1,292 (+14%) | 1mo | $249,950 | $193 | 57 |
| 6820 Mickey Dr | 0.59mi | 3/2.0 | 1,230 (+9%) | 1mo | $289,500 | $235 | 57 |
| 6825 Wooddale Dr | 0.50mi | 3/2.0 | 1,288 (+14%) | 0mo | $315,000 | $245 | 53 |
| 6925 Bennington Dr | 0.74mi | 3/2.0 | 1,240 (+10%) | 0mo | $230,000 | $185 | 49 |
| 6716 Brookdale Dr | 0.63mi | 3/2.0 | 1,278 (+13%) | 1mo | $280,000 | $219 | 48 |
Match score weights: distance 35% · size 25% · config 20% · recency 20%. Top-matched comps best support the ARV.
Projected returns pro-forma
-3.0% appreciation · 4.34% rent growth · sell at horizon
- IRR
- -14.4%
- Equity multiple
- 0.48×
- Total profit
- $-32,815
- Equity at exit
- $33,548
- IRR
- -3.4%
- Equity multiple
- 0.76×
- Total profit
- $-15,181
- Equity at exit
- $19,454
Cash invested: $63,000 (down + closing). Projections, not guarantees.
Landlord ↔ Tenant lean methodology
- Overall (STATE)
- 87 Strongly Landlord-Friendly
- State Texas
- 87 Strongly Landlord-Friendly · R+5
- County
- — inherits STATE
- City
- — inherits STATE
ZIP-level market 76148
- Home prices YoY
- -17.1%
- Rents YoY
- 4.3%
- Active inventory
- 130
- Price-to-rent
- 8.9×
Monthly cashflow live
- Estimated rent
- $2,109 high interval (Pro) →
- Mortgage (P&I)
- −$1,180
- Tax from tax record
- −$382 /mo · $4,584/yr
- Insurance
- −$94
- HOA
- −$0
- Vacancy / Maint / Mgmt
- −$443
- Net cashflow
- $11
Break-even live
UW: 25.0% down · 7.5% · 30yr · 1.5% tax · 5.0% vac · 8.0% maint · 8.0% mgmt
Financing live
Cash to close
- Down payment
- $56,250
- Closing costs
- $6,750
- Reserves months
- —
- Total cash needed
- —
Loan-product check · same deal, 3 products live
Conventional
25% down · 7.5% · 30yr
- Down + closing
- —
- Monthly P&I
- —
- Monthly cashflow
- —
- DSCR
- —
- Eligible?
- —
Personal DTI + credit; lowest rate.
DSCR
20% down · 8.5% · 30yr
- Down + closing
- —
- Monthly P&I
- —
- Monthly cashflow
- —
- DSCR
- —
- Eligible?
- —
No personal income docs; deal must DSCR.
Hard money
10% down · 12.0% · 12mo
- Down + closing
- —
- Monthly P&I
- —
- Monthly cashflow
- —
- DSCR
- —
- Eligible?
- —
Short-term bridge; refi at stabilization.
Rent comps 40 comps
| Address | Beds | Baths | Sqft | Rent | $/sqft | DOM | Units | Dist |
|---|---|---|---|---|---|---|---|---|
| 6405 Kary Lynn Dr N Watauga, TX | 3.0 | 2.0 | 1072 | $1,950 | $1.82 | 24d | 1 | 0.03mi |
| 7320 Echo Hill Dr Watauga, TX | 3.0 | 2.0 | 1287 | $1,890 | $1.47 | 43d | 1 | 0.15mi |
| 7400 Echo Hill Dr Watauga, TX | 3.0 | 2.0 | 1364 | $1,950 | $1.43 | 4d | 1 | 0.15mi |
| 7529 Meadowlark Ln N Watauga, TX | 3.0 | 2.0 | 1342 | $2,150 | $1.60 | 43d | 1 | 0.16mi |
| 6405 Kary Lynn Dr S Watauga, TX | 3.0 | 2.0 | 1072 | $1,950 | $1.82 | 24d | 1 | 0.17mi |
| 6516 Meadowview Ln Watauga, TX | 3.0 | 2.0 | 1164 | $2,100 | $1.80 | 24d | 1 | 0.21mi |
| 6529 Blue Grass Dr Watauga, TX | 3.0 | 2.0 | 1354 | $2,150 | $1.59 | 24d | 1 | 0.22mi |
| 7529 Walnuthill Ct Watauga, TX | 3.0 | 2.0 | 1360 | $2,150 | $1.58 | 43d | 1 | 0.24mi |
| 7608 Meadowlark Ln N Watauga, TX | 3.0 | 2.0 | 1377 | $1,925 | $1.40 | 22d | 1 | 0.24mi |
| 6437 Starnes Rd Watauga, TX | 3.0 | 2.0 | 1297 | $1,980 | $1.53 | 43d | 1 | 0.30mi |
| 6024 Herschel Dr Watauga, TX | 3.0 | 2.0 | 1418 | $1,950 | $1.38 | 14d | 1 | 0.45mi |
| 6024 Herschel Dr Watauga, TX | 3.0 | 2.0 | 1418 | $1,950 | $1.38 | 22d | 1 | 0.45mi |
| 6633 Greendale Dr Watauga, TX | 3.0 | 2.0 | 1379 | $2,025 | $1.47 | 20d | 1 | 0.49mi |
| 6633 Greendale Dr Watauga, TX | 3.0 | 2.0 | 1379 | $2,025 | $1.47 | 24d | 1 | 0.49mi |
| 6569 Westridge Dr Watauga, TX | 3.0 | 2.5 | 1487 | $2,050 | $1.38 | 43d | 1 | 0.49mi |
| 6017 Hillcrest Dr Watauga, TX | 3.0 | 2.0 | 1314 | $1,950 | $1.48 | 7d | 1 | 0.53mi |
| 7733 Liz Ln Watauga, TX | 3.0 | 2.0 | 1464 | $1,975 | $1.35 | 24d | 1 | 0.66mi |
| 6621 North Park Dr Watauga, TX | 3.0 | 2.0 | 1401 | $2,085 | $1.49 | 24d | 1 | 0.68mi |
| 6889 Hightower Dr Unit 6946 North Richland Hills, TX | 2.0 | 2.0 | 966 | $1,434 | $1.48 | 43d | 1 | 0.69mi |
| 6889 Hightower Dr Unit 6922 North Richland Hills, TX | 3.0 | 2.0 | 1219 | $1,921 | $1.58 | 3d | 1 | 0.69mi |
| 6889 Hightower Dr Unit 6926 North Richland Hills, TX | 2.0 | 2.0 | 1022 | $1,496 | $1.46 | 3d | 1 | 0.69mi |
| 6889 Hightower Dr North Richland Hills, TX | 2.0 | 2.0 | 1022 | $1,594 | $1.56 | 2d | 1 | 0.69mi |
| 6889 Hightower Dr North Richland Hills, TX | 3.0 | 2.0 | 1219 | $1,939 | $1.59 | 12d | 1 | 0.69mi |
| 6400 High Lawn Ter Watauga, TX | 3.0 | 2.0 | 1430 | $2,155 | $1.51 | 43d | 1 | 0.76mi |
| 6617 Nola Dr Watauga, TX | 3.0 | 2.0 | 1395 | $2,095 | $1.50 | 24d | 1 | 0.82mi |
| 6937 Cheswick Dr North Richland Hills, TX | 3.0 | 2.0 | 1181 | $1,900 | $1.61 | 17d | 1 | 0.87mi |
| 6937 Cheswick Dr North Richland Hills, TX | 3.0 | 2.0 | 1181 | $1,900 | $1.61 | 22d | 1 | 0.87mi |
| 8221 Mark Ln Watauga, TX | 3.0 | 2.0 | 1411 | $2,900 | $2.06 | 24d | 1 | 0.90mi |
| 6629 High Lawn Ter Watauga, TX | 3.0 | 2.0 | 1497 | $2,150 | $1.44 | 17d | 1 | 0.92mi |
| 7427 Windhaven Rd North Richland Hills, TX | 2.0 | 2.0 | 1100 | $1,575 | $1.43 | 2d | 1 | 1.05mi |
| 7008 Hanging Cliff Pl North Richland Hills, TX | 3.0 | 2.0 | 1441 | $2,095 | $1.45 | 43d | 1 | 1.06mi |
| 7002 Lincoln Dr North Richland Hills, TX | 2.0 | 2.0 | 1125 | $1,675 | $1.49 | 14d | 1 | 1.08mi |
| 7525 Windhaven Rd North Richland Hills, TX | 3.0 | 2.0 | 1212 | $1,595 | $1.32 | 24d | 1 | 1.09mi |
| 7013 Lincolnshire Ln North Richland Hills, TX | 3.0 | 2.0 | 1419 | $2,200 | $1.55 | 24d | 1 | 1.13mi |
| 7013 Lincolnshire Ln North Richland Hills, TX | 3.0 | 2.0 | 1419 | $2,000 | $1.41 | 2d | 1 | 1.13mi |
| 5824 Storm Dr Watauga, TX | 3.0 | 2.0 | 1148 | $1,850 | $1.61 | 18d | 1 | 1.13mi |
| 7001 Newcastle Pl North Richland Hills, TX | 3.0 | 2.0 | 1455 | $2,400 | $1.65 | 43d | 1 | 1.18mi |
| 2107 Ridgecliff Dr Keller, TX | 3.0 | 2.0 | 1310 | $2,550 | $1.95 | 5d | 1 | 1.22mi |
| 6269 Stardust Dr S Watauga, TX | 3.0 | 2.0 | 1334 | $1,975 | $1.48 | 43d | 1 | 1.25mi |
| 5832 Swords Dr Fort Worth, TX | 3.0 | 2.0 | 1300 | $1,895 | $1.46 | 43d | 1 | 1.26mi |
Listing history 4 events
-
2026-05-18status Pending 830-char remark
-
2026-05-09historical Active Option Contract 830-char remark
-
2026-05-06price $225,000 830-char remark
-
2026-04-23$250,000 Active 830-char remark
ⓘ Source: listings_history table (triggers on properties + properties_extension) + one-shot
backfill from property_details.listing_events for pre-trigger history.
Tax reassessment forecast TX · Resets to sale price
- Current annual tax
- $4,584 · $382/mo
- Projected year-2 tax
- $4,584 · $382/mo
- Expected delta
- $0/yr ($0/mo · 0.0%)
ⓘ Screening estimate from a state-policy table — verify with the county assessor before closing.
Climate risk First Street
- Flood 1/10 Low FEMA zone X (unshaded) · 0% chance over 30 yrs
- Wildfire 1/10 Low
- Heat 7/10 Severe 7 d/yr ≥109°F today · 23 d/yr by 30 yrs out
- Wind 4/10 Moderate 21% chance of damaging wind over 30 yrs
- Air quality 3/10 Moderate 3 unhealthy d/yr today · 4 by 30 yrs out
Nearby sold comps map
Loading sold comps map…
Walkable amenities ~0.75 mi
Loading nearby amenities…
Taxation est. · year 1
- Rental income
- $25,309
- − Mortgage interest
- −$12,603
- − Property taxes
- −$4,584
- − Insurance
- −$1,125
- − Repairs & maintenance
- −$2,025
- − Management
- −$2,025
- − Depreciation
- −$6,545
- Taxable loss
- −$3,598
- Est. tax savings @ 24.0%
- +$864
- After-tax cash flow
- $990/yr
For passive investors: Depreciation is non-cash, so a rental often shows a tax loss while cash-flowing — sheltering income. Rental losses are passive: they offset passive income freely, and up to $25,000/yr can offset ordinary (W-2) income if you actively participate and your MAGI is under $100k (phasing out to $0 by $150k); unused losses carry forward. On sale, claimed depreciation is recaptured at up to 25%, and gains may owe capital-gains tax (a 1031 exchange can defer both). Figures are a year-1 estimate at your 24.0% rate — not tax advice; consult a CPA.
Schools (NCES district)
- District
- Keller ISD
- NCES district ID
- 4825260
- Math proficiency
- 50% ▼ -14.00%
- Reading proficiency
- 54% ▼ -9.00%
- Median HH income
- $92,106
- Composite
- 48.46/100
- National rank
- #2131
- State rank
- #91 of 826 in TX
Livability — Watauga
- Score
- 76/100
- State rank
- #105
- US rank
- #3500
Category grades
Schools grade is shown separately in the Schools card above.
Census & demographics
- Census place
- Watauga, TX
- County
- Tarrant County · 2,033,669 people
- City population
- 23,367
- Metro
- Dallas-Fort Worth-Arlington, TX
- Population (ZIP)
- 23,367
- Household income
- $89,840
- Rent vs Own
- Severe rent burden
- 373.0
Population outlook (Tarrant County) Hauer SSP2
- Today (2025)
- 2,380,417 people
- By 2030
- 2,578,900 · +8.3%
- By 2040
- 2,974,995 · +25.0%
- By 2050
- 3,350,489 · +40.8%
- By 2075
- 4,216,909 · +77.2%
- By 2100
- 4,741,527 · +99.2%
Race, ethnicity, and origin ACS 2023
- Neighborhood character
- Diverse neighborhood (Simpson 0.59)
- Race & ethnicity
- White 57% Hispanic / Latino 29% Two or more races 16% Black 6% Asian 5% Native American 1%
- Hispanic origin (detail)
- Mexican 22% Puerto Rican 2%
- Common ancestry
- Lithuanian 2% Slovak 2% Italian 1%
- Foreign-born
- 12% · Canada, Vietnam
- Languages at home
- 79% English-only · Spanish 16% Tagalog/Filipino 2% Other Asian/Pacific 2%
Political lean MEDSL · Tarrant
- 2024 margin
- Lean R (+5.1) · D 46.7% · R 51.9% · Other 1.4%
- 2008→2024 swing
- +6.6pp toward D · 2008: -11.7pp · 2024: -5.1pp
- All cycles
- 2024: R+5.1 2020: D+0.2 2016: R+8.7 2012: R+15.7 2008: R+11.7
Not yet ingested
- Civics
- —
Market trends
- HPI YoY
- ▼ -64.11%
- Current HPI
- 310.2504
- Rent YoY
- ▲ 4.34%
- Metro
- Dallas-Fort Worth-Arlington, TX
- State GDP YoY
- ▲ 3.95%
- F500 in state
- 110
Industry mix (Fortune 500 HQ in TX)
| Industry | F500 HQs | Revenue |
|---|---|---|
| Energy | 16 | $1,198B |
|
||
| Technology | 5 | $198B |
|
||
| Engineering / Construction | 4 | $72B |
|
||
| Energy Services | 3 | $60B |
|
||
| Utilities | 3 | $41B |
|
||
| Healthcare | 2 | $330B |
|
||
Price history
-10.0% since first listed5 events — show timeline
- 2026-06-11 Sold (MLS) — NTREIS
- 2026-05-18 Pending — NTREIS
- 2026-05-09 Contingent — NTREIS
- 2026-05-06 Price Changed $225,000 NTREIS
- 2026-04-23 Listed $250,000 NTREIS
Property tax history
+5.0%/yrLatest (2025): $4,584 · +9.0% YoY. Source: county tax records.
Cash-flow waterfall
monthlySold comps — $/sqft
last 12 mo · ≤1 miLoading sold comps…