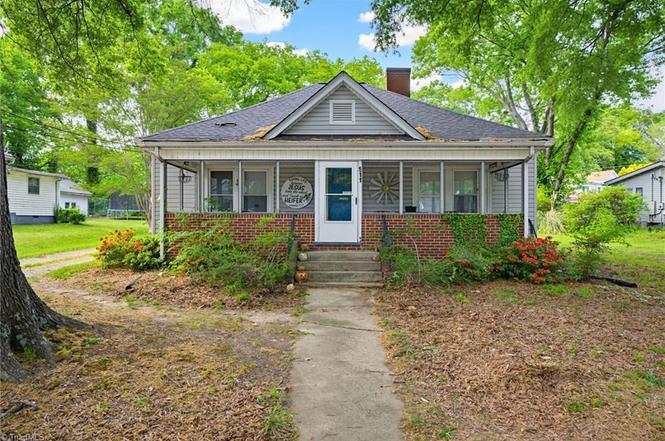
511 Early Ave · Eden, NC
Flood risk 1/10 · Minimal
- FEMA flood zone
- X (unshaded)
- Chance of flooding over 30 yrs
- 0.0%
- Est. flood insurance / yr
- $507 – $1,088
Fire risk 2/10 · Minimal
- Est. fire insurance / yr
- $906 – $1,684
Heat risk 6/10 · Moderate
- Hot days now (above 104°F)
- 7 days/yr
- Hot days in 30 yrs
- 18 days/yr
Wind risk 4/10 · Minor
- Chance of severe wind over 30 yrs
- 7.0%
Air-quality risk 2/10 · Minimal
- Unhealthy air days now
- 2 days/yr
- Unhealthy air days in 30 yrs
- 2 days/yr
Risk factors via First Street. Map © Google.
Why this score? — see what drove the B- grade
The composite is a weighted blend of 9 inputs, each scored 0–100. Each bar is that input's sub-score; the figure is the points it added to the 100-point composite (weight × sub-score).
- Cash flow +25.5/30.0
- ARV discount +15.0/15.0
- DSCR +8.4/10.0
- 1% rule +6.6/10.0
- Livability +3.4/5.0
- Schools +3.3/10.0
- Rent growth +2.5/5.0
- Condition / age +2.5/5.0
- Appreciation +0.0/10.0
$85,000
🖨 Deal sheet (PDF) 📄 Offer letter ✓ Due diligence
Listing remarks MLS
$66,900.00. Great investor or first time homeowner opportunity. Newer roof, fresh paint, refinished/replaced flooring. 2 bedrooms, 1 full bath. Large walk in closet in primary bedroom. Detached wired, 1 bay garage/storage. Centrally located in Eden, NC convenient to shopping/schools/employment.
Key facts
- Covered front porch
- Additional storage
- Main-level living
Tags
Property features AI
Finance
- HOA & community: No homeowners association
Exterior
- Parking: Detached garage (1 car); Driveway with gravel parking
- Utilities: Public water; Public sewer; Electric water heater; Natural gas heating
- Home design: Residential stick/site-built house; One story; Built in 1940
- Construction: Vinyl siding; Crawl space foundation; Existing structure
- Exterior features: City lot; No fencing; Storage structure on property; Publicly maintained road
Interior
- Kitchen: Dishwasher; Free-standing range
- Bedrooms: Bedrooms located on main level
- Flooring: Carpet; Vinyl; Wood
- Bathrooms: 1 full bathroom
- Heating & cooling: Forced air heating (natural gas); Central air conditioning
- Interior features: Primary bedroom on main level; Attic access only
- Laundry & utility: Washer hookup; Dryer connection on main level; Electric water heater
Neighborhood map
What this means for you Summary
Snapshot
- This is a 2-bed/1.0-bath single-family listed at $85k.
Deal economics
- At list price, monthly cash flow is $198 ($2k/yr) — positive.
- The deal already cash-flows at list — no discount required.
- Meets the 1% rule at list price ($983 rent vs $85k).
- Recommended offer: $82k (3.0% below list) — sets the bar for market timing.
- Cap rate 9.1% vs local median 4.3% in Eden — top-decile yield for the area; either an underpriced asset or a hidden risk that comps aren't pricing in. Stress-test before assuming the spread holds.
Location & tenants
- Location reads 67/100 on livability (#224 in NC) — a middle-class / working-renter tenant base. Strengths: cost of living A+, housing A+, health & safety A+; Watch: crime D-, amenities F, commute F.
- Rockingham County Schools (rural): math 38% / reading 40% proficiency, ranked #120 of 178 in NC (top 67%) — families likely to look elsewhere, expect single-tenant / working-renter base with shorter leases.
- Zoned schools: Leaksville-Spray Elementary (math 26% / reading 27%, grade F, #1,073 of 1,410 statewide, top 77%, 404 students, 99% FRL); J E Holmes Middle (math 31% / reading 37%, grade F, #294 of 475 statewide, top 63%, 627 students, 99% FRL); John M Morehead High (math 22% / reading 47%, grade F, #427 of 535 statewide, top 81%, 814 students, 64% FRL) — zoned schools average 87% FRL vs 52% district-wide (35 pts higher); higher-poverty schools than district average — tighter screening recommended.
- Market conditions: 208 active listings in the ZIP; 2 comparable units currently listed for rent nearby; 344 units permitted in Rockingham County in 2024 (0 in 5+ unit buildings).
Forward outlook
- Local home prices are declining (-3.0%/yr); year-one equity from $588 of loan paydown is wiped out by about $3k of value loss. Plan a longer hold.
- Rockingham County population projected at -22% by 2050 — secular population decline; favor cash flow + early exit over multi-decade hold.
Negotiation context
- It's been on market 46 days — a 3% lower offer ($82k) is reasonable based on typical stale-listing flexibility.
- 2 sale attempts since 5y ago; this cycle's ask has dropped $10k (10%) from the opening price — seller is motivated, your offer sets the floor, not the list.
- Current owner paid $70k; 21% above their basis — modest negotiation headroom, anchor on the comps not their cost.
Risks & watch-outs
- Watch-outs: built in 1940 — expect roof / HVAC / electrical / plumbing capex.
- Climate carrying-cost: extreme-heat days projected 7→18/yr by 2055 (HVAC capex compounding) — expect insurance premiums to compound above CPI over the hold.
Questions for the listing agent
- It's been on market 46 days. Have you received any prior offers? Is the seller open to a 3% concession, seller financing, or rate buy-down credit?
- Built in 1940 — when were the roof, HVAC, electrical panel, plumbing, and water heater last replaced?
- Is there a deadline driving the sale (1031 exchange, divorce, estate, relocation)? That informs how much negotiation room exists.
- Schools are F-rated, which usually means shorter tenancies and higher turnover. Who's the typical renter profile here, and what's been the actual vacancy rate?
- Crime grade is D in this area — have there been break-ins, vandalism, or insurance claims at this property in the last 3 years? What carrier currently insures it and at what premium?
- What's the average days-on-market for RENTAL listings here right now (not sales)? A rising rental-DOM trend means longer vacancies and softer asking-rent achievability than the comps imply.
- What's the recent tenant-quality profile in this submarket — average credit score on applications, eviction rate, late-payment / NSF rate, and stable-employment percentage? A property-management company in the area should have these aggregated.
- How much new for-sale + rental construction is in the pipeline within 1–3 miles? Heavy new supply typically softens prices + rents 12–24 months out; constrained supply supports both.
Investment metrics
- 1% rule
- 1.16% ✓
- Cap rate
- 9.08%
- Cash-on-cash
- 9.97%
- DSCR
- 1.44
- GRM
- 7.2
CMA / ARV
- ARV (on-the-fly)
- $162,992
- Comps found
- 12
Show comp detail 12 sales within ~0.75 mi
| Address | Dist | Beds/Ba | Sqft | Sold | Price | $/sf | Match |
|---|---|---|---|---|---|---|---|
| 521 Walnut St | 0.08mi | 3/1.5 (+1) | 1,426 (+7%) | 3mo | $165,000 | $116 | 76 |
| 724 Early Ave | 0.39mi | 2/1.0 | 1,315 (-2%) | 5mo | $90,000 | $68 | 75 |
| 804 Church St | 0.55mi | 2/1.0 | 1,334 (-0%) | 1mo | $100,000 | $75 | 74 |
| 609 Morehead St | 0.07mi | 3/1.5 (+1) | 1,176 (-12%) | 0mo | $159,900 | $136 | 70 |
| 522 Glovenia St | 0.24mi | 3/2.0 (+1) | 1,400 (+5%) | 3mo | $250,000 | $179 | 69 |
| 301 Lloyd St | 0.73mi | 2/1.0 | 1,321 (-1%) | 11mo | $144,500 | $109 | 55 |
| 509 College St | 0.38mi | 3/2.0 (+1) | 1,228 (-8%) | 10mo | $149,900 | $122 | 52 |
| 516 S Hamilton St | 0.66mi | 3/1.0 (+1) | 1,447 (+8%) | 1mo | $185,000 | $128 | 50 |
| 1013 Willow St | 0.65mi | 3/2.0 (+1) | 1,302 (-2%) | 9mo | $214,900 | $165 | 49 |
| 1002 Irving Ave | 0.63mi | 2/1.0 | 1,196 (-10%) | 7mo | $103,000 | $86 | 47 |
| 1005 Willow St | 0.61mi | 3/2.0 (+1) | 1,200 (-10%) | 7mo | $199,900 | $167 | 40 |
| 115 Moir St | 0.44mi | 3/2.0 (+1) | 1,524 (+14%) | 11mo | $178,500 | $117 | 38 |
Match score weights: distance 35% · size 25% · config 20% · recency 20%. Top-matched comps best support the ARV.
Projected returns pro-forma
-3.0% appreciation · 3.0% rent growth · sell at horizon
- IRR
- -1.3%
- Equity multiple
- 0.95×
- Total profit
- $-1,173
- Equity at exit
- $12,674
- IRR
- 8.4%
- Equity multiple
- 1.64×
- Total profit
- $15,231
- Equity at exit
- $7,349
Cash invested: $23,800 (down + closing). Projections, not guarantees.
Landlord ↔ Tenant lean methodology
- Overall (STATE)
- 85 Strongly Landlord-Friendly
- State North Carolina
- 85 Strongly Landlord-Friendly · R+3
- County
- — inherits STATE
- City
- — inherits STATE
ZIP-level market 27288
- Home prices YoY
- -26.5%
- Active inventory
- 208
- Price-to-rent
- 7.2×
Monthly cashflow live
- Estimated rent
- $983 medium interval (Pro) →
- Mortgage (P&I)
- −$446
- Tax from tax record
- −$98 /mo · $1,174/yr
- Insurance
- −$35
- HOA
- −$0
- Vacancy / Maint / Mgmt
- −$206
- Net cashflow
- $198
Break-even live
Sensitivity live
| Price | -10% $246 | -5% $222 | +0% $198 | +5% $174 | +10% $150 |
|---|---|---|---|---|---|
| Rent | -10% $120 | -5% $159 | +0% $198 | +5% $237 | +10% $275 |
| Rate | -1.0pp $240 | -0.5pp $219 | base $198 | +0.5pp $176 | +1.0pp $153 |
UW: 25.0% down · 7.5% · 30yr · 1.5% tax · 5.0% vac · 8.0% maint · 8.0% mgmt
Financing live
Cash to close
- Down payment
- $21,250
- Closing costs
- $2,550
- Reserves months
- —
- Total cash needed
- —
Loan-product check · same deal, 3 products live
Conventional
25% down · 7.5% · 30yr
- Down + closing
- —
- Monthly P&I
- —
- Monthly cashflow
- —
- DSCR
- —
- Eligible?
- —
Personal DTI + credit; lowest rate.
DSCR
20% down · 8.5% · 30yr
- Down + closing
- —
- Monthly P&I
- —
- Monthly cashflow
- —
- DSCR
- —
- Eligible?
- —
No personal income docs; deal must DSCR.
Hard money
10% down · 12.0% · 12mo
- Down + closing
- —
- Monthly P&I
- —
- Monthly cashflow
- —
- DSCR
- —
- Eligible?
- —
Short-term bridge; refi at stabilization.
Rent comps 2 comps
| Address | Beds | Baths | Sqft | Rent | $/sqft | DOM | Units | Dist |
|---|---|---|---|---|---|---|---|---|
| 704 Irving Ave Unit A Eden, NC | 2.0 | 1.0 | 900 | $900 | $1.00 | 24d | 1 | 0.31mi |
| 606 Park Ave Eden, NC | 3.0 | 2.0 | 1625 | $1,495 | $0.92 | 24d | 1 | 1.22mi |
Listing history 11 events
-
2026-06-18days on market $85,000 Active 46 DOM
-
2026-06-17days on market $85,000 Active 45 DOM
-
2026-06-16pricestatusdays on market $85,000 Active 44 DOM
-
2026-06-03days on market $94,900 Due Diligence Period 42 DOM
-
2026-06-02days on market $94,900 Due Diligence Period 41 DOM
-
2026-06-01days on market $94,900 Due Diligence Period 40 DOM
-
2026-05-31days on market $94,900 Due Diligence Period 39 DOM
-
2026-05-31days on market $94,900 Due Diligence Period 38 DOM
-
2026-04-22$94,900 Active
-
2021-12-13soldstatus $70,000 Closed 295-char remark
Show marketing remark (295 chars)
$66,900.00. Great investor or first time homeowner opportunity. Newer roof, fresh paint, refinished/replaced flooring. 2 bedrooms, 1 full bath. Large walk in closet in primary bedroom. Detached wired, 1 bay garage/storage. Centrally located in Eden, NC convenient to shopping/schools/employment.
-
2021-08-10$66,900 295-char remark
Show marketing remark (295 chars)
$66,900.00. Great investor or first time homeowner opportunity. Newer roof, fresh paint, refinished/replaced flooring. 2 bedrooms, 1 full bath. Large walk in closet in primary bedroom. Detached wired, 1 bay garage/storage. Centrally located in Eden, NC convenient to shopping/schools/employment.
ⓘ Source: listings_history table (triggers on properties + properties_extension) + one-shot
backfill from property_details.listing_events for pre-trigger history.
Tax reassessment forecast NC · Resets to sale price
- Current annual tax
- $1,174 · $98/mo
- Projected year-2 tax
- $1,174 · $98/mo
- Expected delta
- $0/yr ($0/mo · 0.0%)
ⓘ Screening estimate from a state-policy table — verify with the county assessor before closing.
Climate risk First Street
- Flood 1/10 Low FEMA zone X (unshaded) · 0% chance over 30 yrs
- Wildfire 2/10 Low
- Heat 6/10 Major 7 d/yr ≥104°F today · 18 d/yr by 30 yrs out
- Wind 4/10 Moderate 7% chance of damaging wind over 30 yrs
- Air quality 2/10 Low 2 unhealthy d/yr today · 2 by 30 yrs out
Nearby sold comps map
Loading sold comps map…
Walkable amenities ~0.75 mi
Loading nearby amenities…
Taxation est. · year 1
- Rental income
- $11,798
- − Mortgage interest
- −$4,761
- − Property taxes
- −$1,174
- − Insurance
- −$425
- − Repairs & maintenance
- −$944
- − Management
- −$944
- − Depreciation
- −$2,473
- Taxable income
- $1,077
- Est. tax owed @ 24.0%
- −$259
- After-tax cash flow
- $2,114/yr
For passive investors: Depreciation is non-cash, so a rental often shows a tax loss while cash-flowing — sheltering income. Rental losses are passive: they offset passive income freely, and up to $25,000/yr can offset ordinary (W-2) income if you actively participate and your MAGI is under $100k (phasing out to $0 by $150k); unused losses carry forward. On sale, claimed depreciation is recaptured at up to 25%, and gains may owe capital-gains tax (a 1031 exchange can defer both). Figures are a year-1 estimate at your 24.0% rate — not tax advice; consult a CPA.
Schools (NCES district)
- District
- Rockingham County Schools
- NCES district ID
- 3703990
- Math proficiency
- 38% ▼ -2.00%
- Reading proficiency
- 40% ▲ 1.00%
- Median HH income
- $38,914
- Composite
- 32.6/100
- National rank
- #5673
- State rank
- #120 of 178 in NC
Livability — Eden
- Score
- 67/100
- State rank
- #224
- US rank
- #10535
Category grades
Schools grade is shown separately in the Schools card above.
Census & demographics
- Census place
- Eden, NC
- County
- Rockingham County · 22,926 people
- City population
- 22,926
- Metro
- Greensboro-High Point, NC
- Population (ZIP)
- 22,926
- Household income
- $52,594
- Rent vs Own
- Severe rent burden
- 860.0
Population outlook (Rockingham County) Hauer SSP2
- Today (2025)
- 87,103 people
- By 2030
- 83,763 · -3.8%
- By 2040
- 76,082 · -12.7%
- By 2050
- 68,106 · -21.8%
- By 2075
- 52,531 · -39.7%
- By 2100
- 39,871 · -54.2%
Race, ethnicity, and origin ACS 2023
- Neighborhood character
- Predominantly White (67%)
- Race & ethnicity
- White 67% Black 23% Hispanic / Latino 6% Two or more races 5% Native American 1%
- Hispanic origin (detail)
- Mexican 4%
- Common ancestry
- Serbian 2% Slovak 2% Lithuanian 1%
- Foreign-born
- 3% · Canada
- Languages at home
- 94% English-only · Spanish 5% German/W. Germanic 1%
Political lean MEDSL · Rockingham
- 2024 margin
- Solid R (+35.9) · D 31.7% · R 67.6%
- 2008→2024 swing
- -19.9pp toward R · 2008: -16.0pp · 2024: -35.9pp
- All cycles
- 2024: R+35.9 2020: R+32.0 2016: R+30.0 2012: R+21.3 2008: R+16.0
Not yet ingested
- Civics
- —
Market trends
- HPI YoY
- ▼ -66.28%
- Current HPI
- 183.5709
- Rent YoY
- —
- Metro
- Greensboro-High Point, NC
- State GDP YoY
- ▲ 3.28%
- F500 in state
- 26
Industry mix (Fortune 500 HQ in NC)
| Industry | F500 HQs | Revenue |
|---|---|---|
| Financial Services | 2 | $213B |
|
||
| Retail | 2 | $95B |
|
||
| Industrial Conglomerate | 1 | $38B |
|
||
| Metals / Steel | 1 | $35B |
|
||
| Utilities | 1 | $30B |
|
||
| Industrial Machinery | 1 | $19B |
|
||
Price history
+41.9% since first listed3 events — show timeline
- 2026-04-22 Listed $94,900 Triad MLS
- 2021-12-13 Sold (MLS) $70,000 Triad MLS
- 2021-08-10 Listed $66,900 Triad MLS
Property tax history
+5.7%/yrLatest (2025): $1,174 · -0.0% YoY. Source: county tax records.
Cash-flow waterfall
monthlySold comps — $/sqft
last 12 mo · ≤1 miLoading sold comps…