25210 Hemlock Ln · Cleveland, TX
Flood risk 6/10 · Moderate
- FEMA flood zone
- AE
- Chance of flooding over 30 yrs
- 0.72%
- Est. flood insurance / yr
- $1,737 – $8,500
Fire risk 5/10 · Moderate
- Est. fire insurance / yr
- $1,222 – $2,270
Heat risk 8/10 · Major
- Hot days now (above 110°F)
- 7 days/yr
- Hot days in 30 yrs
- 24 days/yr
Wind risk 8/10 · Major
- Chance of severe wind over 30 yrs
- 99.0%
Air-quality risk 2/10 · Minimal
- Unhealthy air days now
- 1 days/yr
- Unhealthy air days in 30 yrs
- 2 days/yr
Risk factors via First Street. Map © Google.
Why this score? — see what drove the B grade
The composite is a weighted blend of 9 inputs, each scored 0–100. Each bar is that input's sub-score; the figure is the points it added to the 100-point composite (weight × sub-score).
- Cash flow +28.9/30.0
- ARV discount +15.0/15.0
- DSCR +10.0/10.0
- 1% rule +7.8/10.0
- Livability +3.1/5.0
- Rent growth +2.5/5.0
- Schools +2.5/10.0
- Condition / age +2.5/5.0
- Appreciation +0.0/10.0
$140,000
🖨 Deal sheet 📄 Offer letter ✓ Due diligence
Listing remarks MLS
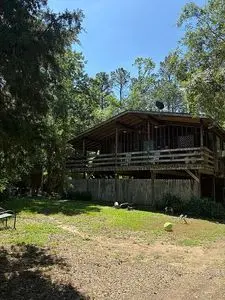
This property presents a unique opportunity for investors, builders, or buyers looking for their next renovation project. Located in a quiet and peaceful neighborhood of Northwoods subdivision, this1980 built property sits on 0.3943 acre +/- lot with plenty of potential to transform into something special. The property consists of 2 lots, dwelling sits on lot 105 of Northwoods 01at0.198 acres. lot104 of Northwoods 01is0.1963 acres . Will not separate the property is fenced. the home is older and in need of repair and updates, making it ideal for a fixer upper, flip opportunity or rebuild site as the property and dwelling are being sold AS-IS. seller will make no improvements or repairs. With a desirable setting of rural living while being close to several amenities with ample lot space , this property is full of possibilities for the right buyer. home is for sale by owner and all offers will be considered toughly without bias. feel free to email at. .. [email protected]
Key facts
- Incredible bones
- Massive yard
- Wraparound deck
Tags
Property features AI
Finance
- Other: Living area approximately 960; Lot around 0.39 acre (approximately 8,625 sq ft)
- HOA & community: Northwoods POA with an annual fee of $100
Exterior
- Parking: No designated parking listed
- Utilities: Public water; Septic tank sewer
- Home design: Residential property; Faces north; One-story (living area indicates compact single-level layout)
- Construction: Built in 1980; Wood siding; Composition roof
- Exterior features: Cleared and wooded lot
Interior
- Kitchen: Free-standing range; Oven
- Bedrooms: Two bedrooms total — Primary bedroom located on the second floor; Both bedrooms approx. 12 x 12
- Bathrooms: 1 full bathroom
- Heating & cooling: Window unit(s) for cooling
- Interior features: Ceiling fan(s); Free-standing stove/fireplace (wood/stove style)
- Laundry & utility: Washer hookup; Electric dryer hookup
Neighborhood map
What this means for you Summary
Snapshot
- This is a 2-bed/1.0-bath single-family listed at $140k.
Deal economics
- At list price, monthly cash flow is $48 ($581/yr) — positive.
- The deal already cash-flows at list — no discount required.
- Meets the 1% rule at list price ($2k rent vs $140k).
- Cap rate 10.4% vs local median 4.7% in Cleveland — top-decile yield for the area; either an underpriced asset or a hidden risk that comps aren't pricing in. Stress-test before assuming the spread holds.
Location & tenants
- Location reads 61/100 on livability (#1,013 in TX) — a middle-class / working-renter tenant base. Strengths: cost of living A+, housing A+; Watch: crime D-, amenities F, commute F.
- Splendora ISD (rural): math 25% / reading 31% proficiency, ranked #648 of 826 in TX (top 78%) — low school quality limits family demand, transient renter base, plan for 1-2y turnover.
- Zoned schools: Piney Woods El (math 23% / reading 28%, grade F, #2,982 of 4,322 statewide, top 70%, 534 students, 55% FRL); Splendora J H (math 28% / reading 42%, grade F, #842 of 1,662 statewide, top 51%, 774 students, 62% FRL); Splendora H S (math 18% / reading 38%, grade F, #1,170 of 1,632 statewide, top 72%, 1,344 students, 59% FRL) — zoned schools at 59% FRL track the district average.
- Market conditions: 336 active listings in the ZIP; 2 comparable units currently listed for rent nearby; 13,259 units permitted in Montgomery County in 2024 (1,402 in 5+ unit buildings).
- This rent runs 35% of the median local income ($62k/yr) — at the standard rent-burdened threshold; future hikes will face affordability resistance.
Forward outlook
- Local home prices are declining (-3.0%/yr); year-one equity from $968 of loan paydown is wiped out by about $4k of value loss. Plan a longer hold.
- Montgomery County population projected at +65% by 2050 — long-run rental-demand tailwind backs the buy-and-hold thesis.
Negotiation context
- Only 1 days on market — expect competitive offers; lowballing is unlikely to land.
- 2 sale attempts with the ask held roughly flat each time — persistent listings suggest the price (not the market) is what's stuck; bring a comps-based counter.
Risks & watch-outs
- Watch-outs: flood insurance adds $427/mo.
- Climate carrying-cost: in FEMA flood zone AE (mandatory federal flood insurance); severe wind risk, 99% chance of damaging wind over 30y; moderate wildfire risk; extreme-heat days projected 7→24/yr by 2055 (HVAC capex compounding) — expect insurance premiums to compound above CPI over the hold.
Questions for the listing agent
- What's the actual annual flood-insurance premium (NFIP or private), and is the property in a SFHA with mandatory coverage?
- What does the HOA fee cover, when was the last increase, and are there any pending special assessments or reserve-fund shortfalls?
- Is there a deadline driving the sale (1031 exchange, divorce, estate, relocation)? That informs how much negotiation room exists.
- Schools are F-rated, which usually means shorter tenancies and higher turnover. Who's the typical renter profile here, and what's been the actual vacancy rate?
- Crime grade is D in this area — have there been break-ins, vandalism, or insurance claims at this property in the last 3 years? What carrier currently insures it and at what premium?
- What's the average days-on-market for RENTAL listings here right now (not sales)? A rising rental-DOM trend means longer vacancies and softer asking-rent achievability than the comps imply.
- What's the recent tenant-quality profile in this submarket — average credit score on applications, eviction rate, late-payment / NSF rate, and stable-employment percentage? A property-management company in the area should have these aggregated.
- How much new for-sale + rental construction is in the pipeline within 1–3 miles? Heavy new supply typically softens prices + rents 12–24 months out; constrained supply supports both.
Investment metrics
- 1% rule
- 1.28% ✓
- Cap rate
- 10.36%
- Cash-on-cash
- 14.54%
- DSCR
- 1.65
- GRM
- 6.5
CMA / ARV
- ARV (median comp)
- $185,899
- List price
- $140,000
- Delta
- -24.69%
- Verdict
- UNDERPRICED
- Comps
- 18 within 1.0 mi
Show comp detail 3 sales within ~0.75 mi
| Address | Dist | Beds/Ba | Sqft | Sold | Price | $/sf | Match |
|---|---|---|---|---|---|---|---|
| 25372 Spruce Ln | 0.18mi | 2/1.0 | 850 (-12%) | 13mo | $149,900 | $176 | 62 |
| 25561 Spruce Ln | 0.35mi | 3/2.0 (+1) | 1,056 (+10%) | 20mo | $160,000 | $152 | 41 |
| 11441 Timber Rd | 0.61mi | 2/1.0 | 1,092 (+14%) | 15mo | $165,000 | $151 | 36 |
Match score weights: distance 35% · size 25% · config 20% · recency 20%. Top-matched comps best support the ARV.
Projected returns pro-forma
-3.0% appreciation · 3.0% rent growth · sell at horizon
- IRR
- -13.7%
- Equity multiple
- 0.51×
- Total profit
- $-19,325
- Equity at exit
- $20,874
- IRR
- -4.5%
- Equity multiple
- 0.70×
- Total profit
- $-11,736
- Equity at exit
- $12,105
Cash invested: $39,200 (down + closing). Projections, not guarantees.
Landlord ↔ Tenant lean methodology
- Overall (STATE)
- 87 Strongly Landlord-Friendly
- State Texas
- 87 Strongly Landlord-Friendly · R+5
- County
- — inherits STATE
- City
- — inherits STATE
ZIP-level market 77328
- Home prices YoY
- -7.7%
- Active inventory
- 336
- Price-to-rent
- 6.5×
Monthly cashflow live
- Estimated rent
- $1,797 medium interval (Pro) →
- Mortgage (P&I)
- −$734
- Tax from tax record
- −$144 /mo · $1,726/yr
- Insurance
- −$58
- Flood insurance flood zone
- −$427 /mo · $5,118/yr
- HOA
- −$8
- Vacancy / Maint / Mgmt
- −$377
- Net cashflow
- $48
Break-even live
UW: 25.0% down · 7.5% · 30yr · 1.5% tax · 5.0% vac · 8.0% maint · 8.0% mgmt
Financing live
Cash to close
- Down payment
- $35,000
- Closing costs
- $4,200
- Reserves months
- —
- Total cash needed
- —
Loan-product check · same deal, 3 products live
Conventional
25% down · 7.5% · 30yr
- Down + closing
- —
- Monthly P&I
- —
- Monthly cashflow
- —
- DSCR
- —
- Eligible?
- —
Personal DTI + credit; lowest rate.
DSCR
20% down · 8.5% · 30yr
- Down + closing
- —
- Monthly P&I
- —
- Monthly cashflow
- —
- DSCR
- —
- Eligible?
- —
No personal income docs; deal must DSCR.
Hard money
10% down · 12.0% · 12mo
- Down + closing
- —
- Monthly P&I
- —
- Monthly cashflow
- —
- DSCR
- —
- Eligible?
- —
Short-term bridge; refi at stabilization.
Rent comps 2 comps
| Address | Beds | Baths | Sqft | Rent | $/sqft | DOM | Units | Dist |
|---|---|---|---|---|---|---|---|---|
| 25507 Greenwood Canyon Dr Cleveland, TX | 3.0–5.0 | 2.0–3.5 | 1950 | $1,875 | $0.96 | 1d | 1 | 0.48mi |
| 10387 Red Cardinal Dr Cleveland, TX | 3.0 | 2.0 | 1076 | $1,830 | $1.70 | 43d | 1 | 0.88mi |
HOA detail
- Monthly dues
- $8 · $96/yr
Listing history 15 events
-
2026-06-17days on market $140,000 Active 1 DOM
-
2026-06-17days on market $140,000 Active 35 DOM
-
2026-06-16days on market $140,000 Active 34 DOM
-
2026-06-15days on market $140,000 Active 33 DOM
-
2026-06-13days on market $140,000 Active 31 DOM
-
2026-06-13days on market $140,000 Active 30 DOM
-
2026-06-09days on market $140,000 Active 27 DOM
-
2026-06-08days on market $140,000 Active 26 DOM
-
2026-06-07days on market $140,000 Active 25 DOM
-
2026-06-04days on market $140,000 Active 22 DOM
-
2026-06-03days on market $140,000 Active 21 DOM
-
2026-06-02days on market $140,000 Active 20 DOM
-
2026-06-01days on market $140,000 Active 19 DOM
-
2026-05-31days on market $140,000 Active 18 DOM
-
2026-05-14$140,000 Active 990-char remark
Show marketing remark (990 chars)
This property presents a unique opportunity for investors, builders, or buyers looking for their next renovation project. Located in a quiet and peaceful neighborhood of Northwoods subdivision, this1980 built property sits on 0.3943 acre +/- lot with plenty of potential to transform into something special. The property consists of 2 lots, dwelling sits on lot 105 of Northwoods 01at0.198 acres. lot104 of Northwoods 01is0.1963 acres . Will not separate the property is fenced. the home is older and in need of repair and updates, making it ideal for a fixer upper, flip opportunity or rebuild site as the property and dwelling are being sold AS-IS. seller will make no improvements or repairs. With a desirable setting of rural living while being close to several amenities with ample lot space , this property is full of possibilities for the right buyer. home is for sale by owner and all offers will be considered toughly without bias. feel free to email at. .. [email protected]
ⓘ Source: listings_history table (triggers on properties + properties_extension) + one-shot
backfill from property_details.listing_events for pre-trigger history.
Tax reassessment forecast TX · Resets to sale price
- Current annual tax
- $1,726 · $144/mo
- Projected year-2 tax
- $2,562 · $214/mo
- Expected delta
- +$836/yr (+$70/mo · 48.4%)
ⓘ Screening estimate from a state-policy table — verify with the county assessor before closing.
Climate risk First Street
- Flood 6/10 Major FEMA zone AE · 72% chance over 30 yrs
- Wildfire 5/10 Major
- Heat 8/10 Severe 7 d/yr ≥110°F today · 24 d/yr by 30 yrs out
- Wind 8/10 Severe 99% chance of damaging wind over 30 yrs
- Air quality 2/10 Low 1 unhealthy d/yr today · 2 by 30 yrs out
Nearby sold comps map
Loading sold comps map…
Walkable amenities ~0.75 mi
Loading nearby amenities…
Taxation est. · year 1
- Rental income
- $21,560
- − Mortgage interest
- −$7,842
- − Property taxes
- −$1,726
- − Insurance
- −$5,818
- − Repairs & maintenance
- −$1,725
- − Management
- −$1,725
- − HOA
- −$96
- − Depreciation
- −$4,073
- Taxable loss
- −$1,445
- Est. tax savings @ 24.0%
- +$347
- After-tax cash flow
- $928/yr
For passive investors: Depreciation is non-cash, so a rental often shows a tax loss while cash-flowing — sheltering income. Rental losses are passive: they offset passive income freely, and up to $25,000/yr can offset ordinary (W-2) income if you actively participate and your MAGI is under $100k (phasing out to $0 by $150k); unused losses carry forward. On sale, claimed depreciation is recaptured at up to 25%, and gains may owe capital-gains tax (a 1031 exchange can defer both). Figures are a year-1 estimate at your 24.0% rate — not tax advice; consult a CPA.
Schools (NCES district)
- District
- Splendora ISD
- NCES district ID
- 4841070
- Math proficiency
- 25% ▼ -8.00%
- Reading proficiency
- 31% ▼ -1.00%
- Median HH income
- $54,166
- Composite
- 24.92/100
- National rank
- #7572
- State rank
- #648 of 826 in TX
Livability — Cleveland
- Score
- 61/100
- State rank
- #1013
- US rank
- #17943
Category grades
Schools grade is shown separately in the Schools card above.
Census & demographics
- County
- San Jacinto County · 17,208 people
- City population
- 17,208
- Metro
- Houston-The Woodlands-Sugar Land, TX
- Population (ZIP)
- 17,208
- Household income
- $62,428
- Rent vs Own
- Severe rent burden
- 58.0
Population outlook (Montgomery County) Hauer SSP2
- Today (2025)
- 713,896 people
- By 2030
- 805,263 · +12.8%
- By 2040
- 992,708 · +39.1%
- By 2050
- 1,179,590 · +65.2%
- By 2075
- 1,628,084 · +128.1%
- By 2100
- 1,937,880 · +171.5%
Race, ethnicity, and origin ACS 2023
- Neighborhood character
- Majority White (61%)
- Race & ethnicity
- White 61% Hispanic / Latino 33% Two or more races 14% Black 2%
- Hispanic origin (detail)
- Mexican 27% Cuban 1%
- Common ancestry
- Lithuanian 4% Italian 3% Serbian 3%
- Foreign-born
- 18% · Canada, China
- Languages at home
- 67% English-only · Spanish 31% Chinese 1%
Political lean MEDSL · Montgomery
- 2024 margin
- Solid R (+45.5) · D 26.8% · R 72.3%
- 2008→2024 swing
- +7.2pp toward D · 2008: -52.7pp · 2024: -45.5pp
- All cycles
- 2024: R+45.5 2020: R+43.8 2016: R+51.4 2012: R+60.7 2008: R+52.7
Not yet ingested
- Civics
- —
Market trends
- HPI YoY
- ▼ -22.82%
- Current HPI
- 273.6604
- Rent YoY
- —
- Metro
- Houston-The Woodlands-Sugar Land, TX
- State GDP YoY
- ▲ 3.95%
- F500 in state
- 110
Industry mix (Fortune 500 HQ in TX)
| Industry | F500 HQs | Revenue |
|---|---|---|
| Energy | 16 | $1,198B |
|
||
| Technology | 5 | $198B |
|
||
| Engineering / Construction | 4 | $72B |
|
||
| Energy Services | 3 | $60B |
|
||
| Utilities | 3 | $41B |
|
||
| Healthcare | 2 | $330B |
|
||
Price history
+0.0% since first listed2 events — show timeline
- 2026-06-17 Listed $140,000 HARMLS
- 2026-05-14 Listed $140,000 FSBO.com
Property tax history
+3.5%/yrLatest (2025): $1,726 · -0.4% YoY. Source: county tax records.
Cash-flow waterfall
monthlySold comps — $/sqft
last 12 mo · ≤1 miLoading sold comps…