 Duplex
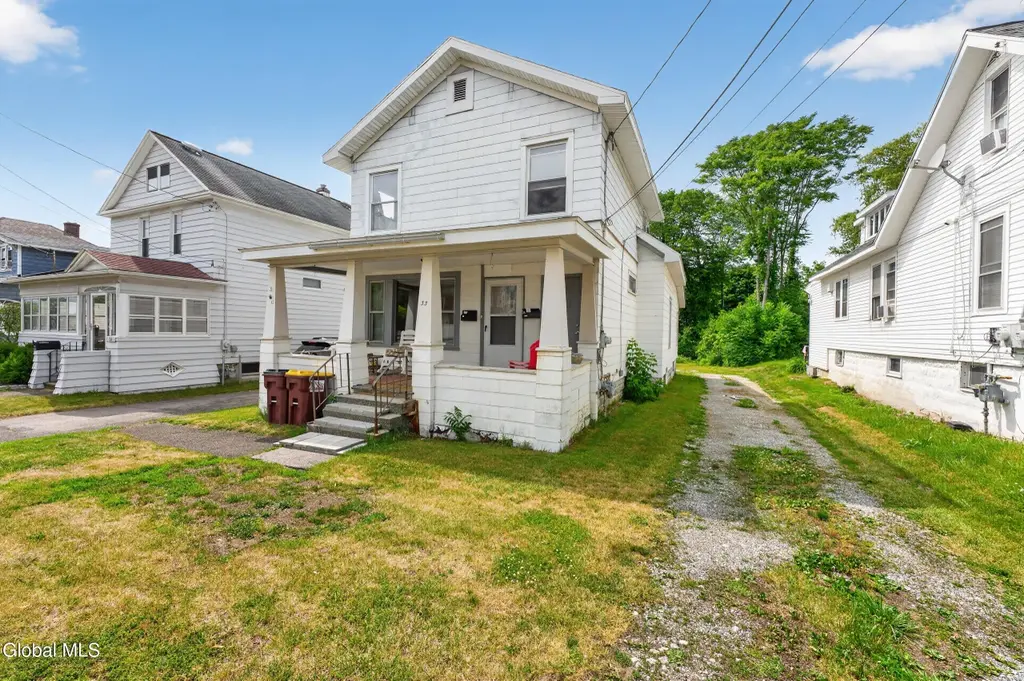
33 Osborne Rd · Roessleville, NY
Flood risk 1/10 · Minimal
- FEMA flood zone
- X (unshaded)
- Chance of flooding over 30 yrs
- 0.0%
- Est. flood insurance / yr
- $473 – $860
Fire risk 1/10 · Minimal
- Est. fire insurance / yr
- $691 – $1,283
Heat risk 4/10 · Minor
- Hot days now (above 96°F)
- 7 days/yr
- Hot days in 30 yrs
- 16 days/yr
Wind risk 3/10 · Minor
- Chance of severe wind over 30 yrs
- 6.0%
Air-quality risk 1/10 · Minimal
- Unhealthy air days now
- 0 days/yr
- Unhealthy air days in 30 yrs
- 0 days/yr
Risk factors via First Street. Map © Google.
Why this score? — see what drove the B+ grade
The composite is a weighted blend of 9 inputs, each scored 0–100. Each bar is that input's sub-score; the figure is the points it added to the 100-point composite (weight × sub-score).
- Cash flow +30.0/30.0
- ARV discount +15.0/15.0
- DSCR +10.0/10.0
- 1% rule +9.3/10.0
- Schools +5.3/10.0
- Rent growth +2.5/5.0
- Livability +2.5/5.0
- Condition / age +2.5/5.0
- Appreciation +0.0/10.0
$246,900
🖨 Deal sheet 📄 Offer letter ✓ Due diligence
Multi-family units
County records classify this as Multi-Family (2-4 Unit). Listing-text estimate: 2 units. confirmed
Listing remarks MLS
LOTS OF POTENTIAL! NEED TLC/1ST FLOOR HAS LARGE DR/MOSTLY HARDWOOD FLOORS/2 CAR GARAGE/SOLD AS IS/NO STAR EXEMPTION -- Very Good Condition
Key facts
- Generous lot
- 0.26 acre lot
- 2 garage spots
Tags
Property features AI
Exterior
- Parking: Detached garage; 2 garage spaces (4 parking spaces total)
- Utilities: Public sewer
- Home design: Duplex; Living area approximately 1,848 (listed value)
- Construction: Shingle siding; Asphalt roof
- Exterior features: Level lot
Interior
- Bedrooms: Unit 1 has 2 bedrooms; Unit 2 has 2 bedrooms
- Bathrooms: 2 full bathrooms total (one full bath on the 1st level, one full bath on the 2nd level)
- Heating & cooling: Natural gas heating
- Interior features: Crawl space and full basement
- Laundry & utility: Main level laundry
Neighborhood map
What this means for you Summary
Snapshot
- This is a 2 × 2-bed/1.0-bath units multifamily listed at $247k.
Deal economics
- At list price, monthly cash flow is $1k ($12k/yr) — positive. Per door: $517/mo.
- The deal already cash-flows at list — no discount required.
- Meets the 1% rule at list price ($4k rent vs $247k).
- Cap rate 11.3% vs local median 5.3% in Roessleville — top-decile yield for the area; either an underpriced asset or a hidden risk that comps aren't pricing in. Stress-test before assuming the spread holds.
Location & tenants
- Location reads: area grade B — affects rentability + tenant quality, not the cash-flow math above.
- South Colonie Central School District (suburban): math 63% / reading 57% proficiency, ranked #215 of 590 in NY (top 36%) — acceptable for families but not a draw, mixed tenant base, ~2y average lease; only 19% free/reduced lunch — higher-income household profile.
- Zoned schools: Colonie Central High School (math 96% / reading 72%, grade A, #404 of 1,100 statewide, top 37%, 1,538 students, 39% FRL) — zoned schools average 39% FRL vs 19% district-wide (20 pts higher); higher-poverty schools than district average — tighter screening recommended.
- Zoned-school proficiency averages 84% at this address vs 60% district-wide (+24 pts) — the actual schools serving this property are materially stronger than the South Colonie Central School District average implies; a family-tenant draw the district grade alone would hide.
- Market conditions: 105 active listings in the ZIP; 7 comparable units currently listed for rent nearby; rentals lingering (median 44d on market — plan ~5-8 weeks vacancy on turnover, expect pricing pressure); 57% of comp listings sitting > 30 days — soft ceiling on asking rent; solid renter incomes; 675 units permitted in Albany County in 2024 (451 in 5+ unit buildings).
- At $3,530/mo this rent would consume 47% of the median local household income ($91k/yr) (locally 530% of renters already pay >50% of income on rent) — very limited rent-growth headroom before tenants either downsize or default.
Forward outlook
- Local home prices are declining (-3.0%/yr); year-one equity from $2k of loan paydown is wiped out by about $7k of value loss. Plan a longer hold.
- Albany County population projected at +9% by 2050 — modest demand growth; plan on rents tracking national, not racing it.
- At projected returns (-3.0% appreciation + 3.0% rent growth), your $69k cash investment doubles in ~7 years — after that, you're playing with house money.
Negotiation context
- Only 5 days on market — expect competitive offers; lowballing is unlikely to land.
- 2 sale attempts since 22y ago with the ask held roughly flat each time — persistent listings suggest the price (not the market) is what's stuck; bring a comps-based counter.
- Current owner paid $109k; list at $247k implies a 127% gain — meaningful room to come down on a strong offer.
Risks & watch-outs
- Watch-outs: built in 1920 — expect roof / HVAC / electrical / plumbing capex.
Questions for the listing agent
- Can we see the unit-by-unit rent roll, current vacancy, and any below-market leases? What's the average tenancy length?
- What capital expenditures (roof, boiler, parking lot, exteriors) have been made in the last 5 years, and what's planned in the next 2?
- Built in 1920 — when were the roof, HVAC, electrical panel, plumbing, and water heater last replaced?
- Is there a deadline driving the sale (1031 exchange, divorce, estate, relocation)? That informs how much negotiation room exists.
- What's the average days-on-market for RENTAL listings here right now (not sales)? A rising rental-DOM trend means longer vacancies and softer asking-rent achievability than the comps imply.
- What's the recent tenant-quality profile in this submarket — average credit score on applications, eviction rate, late-payment / NSF rate, and stable-employment percentage? A property-management company in the area should have these aggregated.
- How much new apartment / multifamily construction is in the pipeline within 1–3 miles? Heavy new supply (>2% of stock underway) typically softens rents 12–24 months out; light construction supports rent growth.
Investment metrics
- 1% rule
- 1.43% ✓
- Cap rate
- 11.32%
- Cash-on-cash
- 17.96%
- DSCR
- 1.80
- GRM
- 5.8
CMA / ARV
- ARV (on-the-fly)
- $347,424
- Comps found
- 7
Show comp detail 7 sales within ~0.75 mi
| Address | Dist | Beds/Ba | Sqft | Sold | Price | $/sf | Match |
|---|---|---|---|---|---|---|---|
| 61 Osborne Rd | 0.14mi | 4/2.0 | 1,848 (0%) | 16mo | $280,000 | $152 | 80 |
| 22 Yardboro Ave | 0.32mi | 4/2.0 | 1,828 (-1%) | 15mo | $190,000 | $104 | 71 |
| 15 Leach Ave | 0.24mi | 5/2.0 (+1) | 1,937 (+5%) | 11mo | $320,000 | $165 | 67 |
| 14 Orford St | 0.16mi | 4/2.0 | 1,600 (-13%) | 6mo | $300,000 | $188 | 65 |
| 29 Commodore St | 0.32mi | 4/2.0 | 1,924 (+4%) | 17mo | $428,000 | $222 | 64 |
| 22 Maplewood Ave | 0.43mi | 4/2.0 | 1,774 (-4%) | 12mo | $410,000 | $231 | 63 |
| 6 N Elmhurst Ave | 0.37mi | 4/2.0 | 1,620 (-12%) | 8mo | $320,000 | $198 | 56 |
Match score weights: distance 35% · size 25% · config 20% · recency 20%. Top-matched comps best support the ARV.
Projected returns pro-forma
-3.0% appreciation · 3.0% rent growth · sell at horizon
- IRR
- 9.5%
- Equity multiple
- 1.38×
- Total profit
- $25,977
- Equity at exit
- $36,814
- IRR
- 18.7%
- Equity multiple
- 2.56×
- Total profit
- $107,816
- Equity at exit
- $21,347
Cash invested: $69,132 (down + closing). Projections, not guarantees.
Landlord ↔ Tenant lean methodology
- Overall (STATE)
- 15 Strongly Tenant-Friendly
- State New York
- 15 Strongly Tenant-Friendly · D+10
- County
- — inherits STATE
- City
- — inherits STATE
ZIP-level market 12205
- Active inventory
- 105
- Price-to-rent
- 11.7×
Monthly cashflow live
- Estimated rent
- $3,530 high interval (Pro) →
- Mortgage (P&I)
- −$1,295
- Tax from tax record
- −$356 /mo · $4,276/yr
- Insurance
- −$103
- HOA
- −$0
- Vacancy / Maint / Mgmt
- −$741
- Net cashflow
- $1,035
Break-even live
2-unit breakdown (identical units grouped — click to expand)
| Units | Beds | Baths | Est. rent |
|---|---|---|---|
| 2× units | 2 | 1 | $3,530 |
| #1 | 2 | 1 | $1,765 |
| #2 | 2 | 1 | $1,765 |
| Total (2 units) | $3,530 | ||
UW: 25.0% down · 7.5% · 30yr · 1.5% tax · 5.0% vac · 8.0% maint · 8.0% mgmt
Financing live
Cash to close
- Down payment
- $61,725
- Closing costs
- $7,407
- Reserves months
- —
- Total cash needed
- —
Loan-product check · same deal, 3 products live
Conventional
25% down · 7.5% · 30yr
- Down + closing
- —
- Monthly P&I
- —
- Monthly cashflow
- —
- DSCR
- —
- Eligible?
- —
Personal DTI + credit; lowest rate.
DSCR
20% down · 8.5% · 30yr
- Down + closing
- —
- Monthly P&I
- —
- Monthly cashflow
- —
- DSCR
- —
- Eligible?
- —
No personal income docs; deal must DSCR.
Hard money
10% down · 12.0% · 12mo
- Down + closing
- —
- Monthly P&I
- —
- Monthly cashflow
- —
- DSCR
- —
- Eligible?
- —
Short-term bridge; refi at stabilization.
Rent comps 7 comps
| Address | Beds | Baths | Sqft | Rent | $/sqft | DOM | Units | Dist |
|---|---|---|---|---|---|---|---|---|
| 11 Brayton St Albany, NY | 3.0 | 1.5 | 1414 | $1,950 | $1.38 | 21d | 1 | 0.09mi |
| 14 Woodside Ave Albany, NY | 4.0 | 3.0 | 1248 | $2,700 | $2.16 | 43d | 1 | 0.46mi |
| 255 Patroon Creek Blvd Albany, NY | 1.0–3.0 | 1.0–2.0 | 1080 | $2,559 | $2.37 | 14d | 22 | 0.78mi |
| 2 Van Buren Ave Albany, NY | 3.0 | 1.0 | 1500 | $2,350 | $1.57 | 43d | 1 | 0.91mi |
| 32 Richmond St Unit 2 Albany, NY | 3.0 | 3.0 | 1248 | $2,500 | $2.00 | 14d | 1 | 1.09mi |
| 234 Osborne Rd Albany, NY | 4.0 | 1.5 | 1260 | $2,800 | $2.22 | 43d | 1 | 1.27mi |
| 135 Winthrop Ave Albany, NY | 3.0 | 2.0 | 1788 | $3,500 | $1.96 | 43d | 1 | 1.48mi |
Listing history 6 events
-
2026-06-17status $246,900 Pending 5 DOM
-
2026-06-17days on market $246,900 Active 5 DOM
-
2026-06-16days on market $246,900 Active 4 DOM
-
2026-06-15days on market $246,900 Active 3 DOM
-
2026-06-13remarks 599-char remark
-
2026-06-13$246,900 Active 1 DOM
ⓘ Source: listings_history table (triggers on properties + properties_extension) + one-shot
backfill from property_details.listing_events for pre-trigger history.
Tax reassessment forecast NY · Partial reset (capped growth)
- Current annual tax
- $4,276 · $356/mo
- Projected year-2 tax
- $4,276 · $356/mo
- Expected delta
- $0/yr ($0/mo · 0.0%)
ⓘ Screening estimate from a state-policy table — verify with the county assessor before closing.
Climate risk First Street
- Flood 1/10 Low FEMA zone X (unshaded) · 0% chance over 30 yrs
- Wildfire 1/10 Low
- Heat 4/10 Moderate 7 d/yr ≥96°F today · 16 d/yr by 30 yrs out
- Wind 3/10 Moderate 6% chance of damaging wind over 30 yrs
- Air quality 1/10 Low 0 unhealthy d/yr today · 0 by 30 yrs out
Nearby sold comps map
Loading sold comps map…
Walkable amenities ~0.75 mi
Loading nearby amenities…
Taxation est. · year 1
- Rental income
- $42,360
- − Mortgage interest
- −$13,830
- − Property taxes
- −$4,276
- − Insurance
- −$1,234
- − Repairs & maintenance
- −$3,389
- − Management
- −$3,389
- − Depreciation
- −$7,183
- Taxable income
- $9,059
- Est. tax owed @ 24.0%
- −$2,174
- After-tax cash flow
- $10,243/yr
For passive investors: Depreciation is non-cash, so a rental often shows a tax loss while cash-flowing — sheltering income. Rental losses are passive: they offset passive income freely, and up to $25,000/yr can offset ordinary (W-2) income if you actively participate and your MAGI is under $100k (phasing out to $0 by $150k); unused losses carry forward. On sale, claimed depreciation is recaptured at up to 25%, and gains may owe capital-gains tax (a 1031 exchange can defer both). Figures are a year-1 estimate at your 24.0% rate — not tax advice; consult a CPA.
Schools (NCES district)
- District
- South Colonie Central School District
- NCES district ID
- 3627210
- Math proficiency
- 63% ▼ -1.00%
- Reading proficiency
- 57% ▲ 4.00%
- Median HH income
- $69,499
- Composite
- 52.97/100
- National rank
- #1527
- State rank
- #215 of 590 in NY
Livability — Roessleville
No livability data for this city. (Only ~50 U.S. cities are tracked.)
Census & demographics
- Census place
- Roessleville, NY
- County
- Albany County · 196,626 people
- Metro
- Albany-Schenectady-Troy, NY
- Population (ZIP)
- 25,838
- Household income
- $91,020
- Rent vs Own
- Severe rent burden
- 530.0
Population outlook (Albany County) Hauer SSP2
- Today (2025)
- 320,794 people
- By 2030
- 327,401 · +2.1%
- By 2040
- 338,218 · +5.4%
- By 2050
- 348,467 · +8.6%
- By 2075
- 381,693 · +19.0%
- By 2100
- 393,809 · +22.8%
Race, ethnicity, and origin ACS 2023
- Neighborhood character
- Predominantly White (73%)
- Race & ethnicity
- White 73% Asian 8% Black 8% Two or more races 6% Hispanic / Latino 5%
- Hispanic origin (detail)
- Puerto Rican 3%
- Common ancestry
- Romanian 6% Lithuanian 3% Iranian 2%
- Foreign-born
- 13% · Canada, China, Vietnam
- Languages at home
- 84% English-only · Other Indo-European 4% Russian/Polish/Slavic 3% Tagalog/Filipino 2%
Political lean MEDSL · Albany
- 2024 margin
- Strong D (+25.8) · D 62.9% · R 37.1%
- 2008→2024 swing
- -3.6pp toward R · 2008: 29.4pp · 2024: 25.8pp
- All cycles
- 2024: D+25.8 2020: D+31.4 2016: D+24.3 2012: D+31.0 2008: D+29.4
Not yet ingested
- Civics
- —
Market trends
- HPI YoY
- ▼ -182.10%
- Current HPI
- 302.9752
- Rent YoY
- —
- Metro
- Albany-Schenectady-Troy, NY
- State GDP YoY
- ▲ 2.60%
- F500 in state
- 92
Industry mix (Fortune 500 HQ in NY)
| Industry | F500 HQs | Revenue |
|---|---|---|
| Financial Services | 10 | $950B |
|
||
| Consumer Goods | 9 | $162B |
|
||
| Insurance | 4 | $225B |
|
||
| Telecommunications | 2 | $144B |
|
||
| Pharmaceuticals | 2 | $112B |
|
||
| Media / Entertainment | 2 | $69B |
|
||
Price history
+124.7% since first listed5 events — show timeline
- 2026-06-12 Listed $246,900 Global MLS
- 2004-11-03 Sold (Public Records) $109,000 Public Records
- 2004-10-22 Sold (MLS) $109,000 Global MLS
- 2004-07-11 Listing Removed — Global MLS
- 2004-06-14 Listed $109,900 Global MLS
Property tax history
+2.3%/yrLatest (2025): $4,276 · -6.5% YoY. Source: county tax records.
Cash-flow waterfall
monthlySold comps — $/sqft
last 12 mo · ≤1 miLoading sold comps…