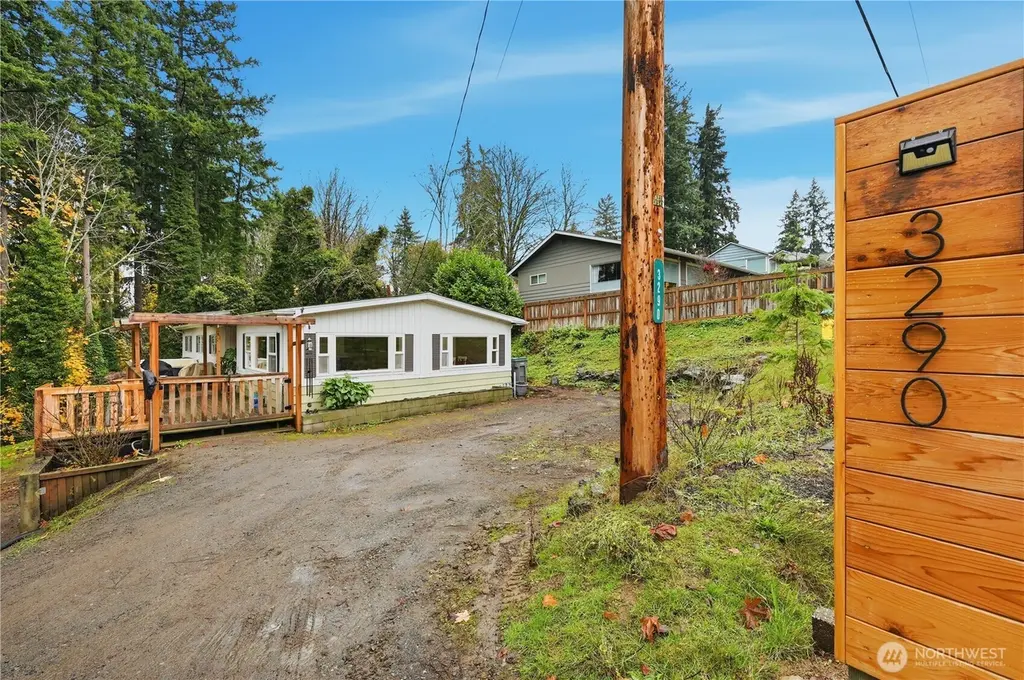
3290 Rocky Point Rd NW · Rocky Point, WA
Flood risk 1/10 · Minimal
- FEMA flood zone
- X (unshaded)
- Chance of flooding over 30 yrs
- 0.0%
- Est. flood insurance / yr
- $507 – $1,088
Fire risk 1/10 · Minimal
- Est. fire insurance / yr
- $604 – $1,122
Heat risk 3/10 · Minor
- Hot days now (above 86°F)
- 7 days/yr
- Hot days in 30 yrs
- 14 days/yr
Wind risk 1/10 · Minimal
- Chance of severe wind over 30 yrs
- —
Air-quality risk 7/10 · Major
- Unhealthy air days now
- 10 days/yr
- Unhealthy air days in 30 yrs
- 10 days/yr
Risk factors via First Street. Map © Google.
Why this score? — see what drove the C- grade
The composite is a weighted blend of 9 inputs, each scored 0–100. Each bar is that input's sub-score; the figure is the points it added to the 100-point composite (weight × sub-score).
- Cash flow +15.0/30.0
- ARV discount +15.0/15.0
- DSCR +4.6/10.0
- Schools +3.9/10.0
- Livability +3.5/5.0
- 1% rule +3.2/10.0
- Rent growth +2.6/5.0
- Condition / age +2.5/5.0
- Appreciation +0.0/10.0
$249,999
🖨 Deal sheet (PDF) 📄 Offer letter ✓ Due diligence
Listing remarks
Tucked at the end of Rocky Point, this quiet West Bremerton home offers 2 bedrooms plus a bonus room, a large living room, flex room, and inviting dining space. Enjoy an out-of-town feel minutes from amenities—8 min to PSNS, Hwy 3, and 12 min to the ferry. Peekaboo water and Olympic Mountain views, a large deck for 4th of July fireworks, a greenhouse, and a huge chicken coop/shed. Updates include a 2024 roof, 1-yr-old septic with transferable agreement, new flooring, paint, vanities, fixtures, and more. Endless potential—come see it! Seller will pay all buyer's closing costs!
Key facts
- New floors
- Spacious deck
- Updated vanities
Tags
Neighborhood map
What this means for you Summary
Snapshot
- This is a 2-bed/2.0-bath manufactured listed at $250k.
Deal economics
- At list price, monthly cash flow is $77 ($926/yr) — positive.
- The deal already cash-flows at list — no discount required.
- To meet the 1% rule (rent ≥ 1% of price), the offer needs to be $205k (17.9% below list).
- Recommended offer: $205k (17.9% below list) — sets the bar for 1% rule.
Location & tenants
- Location reads 70/100 on livability (#243 in WA) — a middle-class / working-renter tenant base. Strengths: crime A+, housing A+, health & safety A+; Watch: cost of living C-, schools D-, amenities F.
- Bremerton School District (urban): math 36% / reading 51% proficiency, ranked #194 of 291 in WA (top 67%) — families likely to look elsewhere, expect single-tenant / working-renter base with shorter leases.
- Market conditions: Rents flat; 349 active listings in the ZIP; 9 comparable units currently listed for rent nearby; rentals at typical pace (median 15d on market — plan ~3-4 weeks tenant-placement turnaround); solid renter incomes; 1,294 units permitted in Kitsap County in 2024 (302 in 5+ unit buildings).
Forward outlook
- Local home prices are declining (-3.0%/yr); year-one equity from $2k of loan paydown is wiped out by about $8k of value loss. Plan a longer hold.
- Kitsap County population projected at +8% by 2050 — modest demand growth; plan on rents tracking national, not racing it.
Negotiation context
- It's been on market 101 days — a 9% lower offer ($227k) is reasonable based on typical stale-listing flexibility.
- 4 sale attempts since 10y ago; this cycle's ask has dropped $100k (29%) from the opening price — seller is motivated, your offer sets the floor, not the list.
- Current owner paid $70k; list at $250k implies a 257% gain — meaningful room to come down on a strong offer.
Questions for the listing agent
- It's been on market 101 days. Have you received any prior offers? Is the seller open to a 18% concession, seller financing, or rate buy-down credit?
- Built in 1971 — when were the roof, HVAC, electrical panel, plumbing, and water heater last replaced?
- Why hasn't it sold? Are there any deal-killer items the seller is aware of (foundation, flood, title, zoning, code violations)?
- Is there a deadline driving the sale (1031 exchange, divorce, estate, relocation)? That informs how much negotiation room exists.
- Schools are D-rated, which usually means shorter tenancies and higher turnover. Who's the typical renter profile here, and what's been the actual vacancy rate?
- What's the average days-on-market for RENTAL listings here right now (not sales)? A rising rental-DOM trend means longer vacancies and softer asking-rent achievability than the comps imply.
- What's the recent tenant-quality profile in this submarket — average credit score on applications, eviction rate, late-payment / NSF rate, and stable-employment percentage? A property-management company in the area should have these aggregated.
- How much new for-sale + rental construction is in the pipeline within 1–3 miles? Heavy new supply typically softens prices + rents 12–24 months out; constrained supply supports both.
Investment metrics
- 1% rule
- 0.82% ✗
- Cap rate
- 6.66%
- Cash-on-cash
- 1.32%
- DSCR
- 1.06
- GRM
- 10.2
CMA / ARV
- ARV (median comp)
- $345,909
- List price
- $249,999
- Delta
- -27.73%
- Verdict
- UNDERPRICED
- Comps
- 10 within 2.0 mi
Show comp detail 2 sales within ~0.75 mi
| Address | Dist | Beds/Ba | Sqft | Sold | Price | $/sf | Match |
|---|---|---|---|---|---|---|---|
| 3290 Rocky Point Rd NW | 0.00mi | 2/2.0 | 1,416 (0%) | 1mo | $249,999 | $177 | 99 |
| 3238 View Dr NW | 0.07mi | 3/2.0 (+1) | 1,628 (+15%) | 17mo | $408,000 | $251 | 52 |
Match score weights: distance 35% · size 25% · config 20% · recency 20%. Top-matched comps best support the ARV.
Projected returns pro-forma
-3.0% appreciation · 0.28% rent growth · sell at horizon
- IRR
- -17.0%
- Equity multiple
- 0.41×
- Total profit
- $-41,142
- Equity at exit
- $37,276
- IRR
- -14.3%
- Equity multiple
- 0.27×
- Total profit
- $-51,070
- Equity at exit
- $21,615
Cash invested: $70,000 (down + closing). Projections, not guarantees.
Landlord ↔ Tenant lean methodology
- Overall (STATE)
- 28 Tenant-Leaning
- State Washington
- 28 Tenant-Leaning · D+8
- County
- — inherits STATE
- City
- — inherits STATE
ZIP-level market 98312
- Rents YoY
- 0.3%
- Active inventory
- 349
- Price-to-rent
- 10.2×
Monthly cashflow live
- Estimated rent
- $2,051 high interval (Pro) →
- Mortgage (P&I)
- −$1,311
- Tax from tax record
- −$128 /mo · $1,538/yr
- Insurance
- −$104
- HOA
- −$0
- Vacancy / Maint / Mgmt
- −$431
- Net cashflow
- $77
Break-even live
Sensitivity live
| Price | -10% $219 | -5% $148 | +0% $77 | +5% $6 | +10% $-64 |
|---|---|---|---|---|---|
| Rent | -10% $-85 | -5% $-4 | +0% $77 | +5% $158 | +10% $239 |
| Rate | -1.0pp $203 | -0.5pp $141 | base $77 | +0.5pp $12 | +1.0pp $-54 |
UW: 25.0% down · 7.5% · 30yr · 1.5% tax · 5.0% vac · 8.0% maint · 8.0% mgmt
Financing live
Cash to close
- Down payment
- $62,500
- Closing costs
- $7,500
- Reserves months
- —
- Total cash needed
- —
Loan-product check · same deal, 3 products live
Conventional
25% down · 7.5% · 30yr
- Down + closing
- —
- Monthly P&I
- —
- Monthly cashflow
- —
- DSCR
- —
- Eligible?
- —
Personal DTI + credit; lowest rate.
DSCR
20% down · 8.5% · 30yr
- Down + closing
- —
- Monthly P&I
- —
- Monthly cashflow
- —
- DSCR
- —
- Eligible?
- —
No personal income docs; deal must DSCR.
Hard money
10% down · 12.0% · 12mo
- Down + closing
- —
- Monthly P&I
- —
- Monthly cashflow
- —
- DSCR
- —
- Eligible?
- —
Short-term bridge; refi at stabilization.
Rent comps 9 comps
| Address | Beds | Baths | Sqft | Rent | $/sqft | DOM | Units | Dist |
|---|---|---|---|---|---|---|---|---|
| 3431 Mathews Dr NW Bremerton, WA | 1.0 | 1.0 | 1005 | $1,900 | $1.89 | 44d | 1 | 0.16mi |
| 3070 NW Paul Benjamin Rd Bremerton, WA | 3.0 | 2.5 | 1752 | $2,895 | $1.65 | 14d | 1 | 1.11mi |
| 3070 NW Paul Benjamin Rd Bremerton, WA | 3.0 | 2.5 | 1752 | $2,895 | $1.65 | 44d | 1 | 1.11mi |
| 778 NE Mesa Ln Bremerton, WA | 1.0–3.0 | 1.0–2.0 | 877 | $1,822 | $2.08 | 14d | 3 | 1.29mi |
| 3000 Austin Dr Bremerton, WA | 1.0–3.0 | 1.0–2.0 | 950 | $1,888 | $1.99 | 14d | 10 | 1.40mi |
| 820 NE Riddell Rd Unit D Bremerton, WA | 2.0 | 1.0 | 974 | $1,650 | $1.69 | 22d | 1 | 1.44mi |
| 685 Sylvan Way Bremerton, WA | 2.0 | 2.0 | 1040 | $2,100 | $2.02 | 14d | 2 | 1.45mi |
| 3232 Pine Rd Bremerton, WA | 2.0–3.0 | 2.0 | 980 | $1,718 | $1.75 | 14d | 9 | 1.45mi |
| 3985 NW Dyes Inlet Ln Bremerton, WA | 2.0 | 1.0 | 900 | $2,100 | $2.33 | 14d | 1 | 1.49mi |
Listing history 16 events
-
2026-05-08status Pending
-
2026-04-29status Active
-
2026-03-20status Pending
-
2026-03-05price $249,999
-
2026-02-12price $275,000
-
2026-02-02price $295,000
-
2026-01-15status Active
-
2025-12-10price $320,000
-
2025-11-25price $345,000
-
2025-11-14$350,000 Active
-
2016-09-30soldstatus $70,000 Sold
-
2016-09-30soldstatus $70,000
-
2016-09-16status Pending Inspection
-
2016-07-23$75,000 Active
-
1995-09-01soldstatus $48,100
-
1993-08-31soldstatus $42,500
ⓘ Source: listings_history table (triggers on properties + properties_extension) + one-shot
backfill from property_details.listing_events for pre-trigger history.
Tax reassessment forecast WA · Resets to sale price
- Current annual tax
- $1,538 · $128/mo
- Projected year-2 tax
- $2,450 · $204/mo
- Expected delta
- +$912/yr (+$76/mo · 59.3%)
ⓘ Screening estimate from a state-policy table — verify with the county assessor before closing.
Climate risk First Street
- Flood 1/10 Low FEMA zone X (unshaded) · 0% chance over 30 yrs
- Wildfire 1/10 Low
- Heat 3/10 Moderate 7 d/yr ≥86°F today · 14 d/yr by 30 yrs out
- Wind 1/10 Low
- Air quality 7/10 Severe 10 unhealthy d/yr today · 10 by 30 yrs out
Nearby sold comps map
Loading sold comps map…
Walkable amenities ~0.75 mi
Loading nearby amenities…
Taxation est. · year 1
- Rental income
- $24,615
- − Mortgage interest
- −$14,004
- − Property taxes
- −$1,538
- − Insurance
- −$1,250
- − Repairs & maintenance
- −$1,969
- − Management
- −$1,969
- − Depreciation
- −$7,273
- Taxable loss
- −$3,387
- Est. tax savings @ 24.0%
- +$813
- After-tax cash flow
- $1,739/yr
For passive investors: Depreciation is non-cash, so a rental often shows a tax loss while cash-flowing — sheltering income. Rental losses are passive: they offset passive income freely, and up to $25,000/yr can offset ordinary (W-2) income if you actively participate and your MAGI is under $100k (phasing out to $0 by $150k); unused losses carry forward. On sale, claimed depreciation is recaptured at up to 25%, and gains may owe capital-gains tax (a 1031 exchange can defer both). Figures are a year-1 estimate at your 24.0% rate — not tax advice; consult a CPA.
Schools (NCES district)
- District
- Bremerton School District
- NCES district ID
- 5300660
- Math proficiency
- 36% ▼ -3.00%
- Reading proficiency
- 51% ▲ 1.00%
- Median HH income
- $46,765
- Composite
- 39.34/100
- National rank
- #8163
- State rank
- #194 of 291 in WA
Livability — Rocky Point
- Score
- 70/100
- State rank
- #243
- US rank
- #7686
Category grades
Schools grade is shown separately in the Schools card above.
Census & demographics
- Census place
- Rocky Point, WA
- County
- Kitsap County · 243,099 people
- Metro
- Bremerton-Silverdale-Port Orchard, WA
- Population (ZIP)
- 36,307
- Household income
- $90,449
- Rent vs Own
- Severe rent burden
- 993.0
Population outlook (Kitsap County) Hauer SSP2
- Today (2025)
- 277,525 people
- By 2030
- 285,040 · +2.7%
- By 2040
- 294,957 · +6.3%
- By 2050
- 300,622 · +8.3%
- By 2075
- 315,580 · +13.7%
- By 2100
- 304,340 · +9.7%
Race, ethnicity, and origin ACS 2023
- Neighborhood character
- Predominantly White (68%)
- Race & ethnicity
- White 68% Two or more races 13% Hispanic / Latino 12% Asian 4% Black 4% Native American 1%
- Hispanic origin (detail)
- Mexican 6% Puerto Rican 1%
- Common ancestry
- Italian 7% Portuguese 5% Slovak 4%
- Foreign-born
- 6% · Canada, China
- Languages at home
- 91% English-only · Spanish 4% Tagalog/Filipino 2% Other Asian/Pacific 1%
Political lean MEDSL · Kitsap
- 2024 margin
- Strong D (+20.9) · D 58.8% · R 37.9% · Other 3.3%
- 2008→2024 swing
- +8.6pp toward D · 2008: 12.3pp · 2024: 20.9pp
- All cycles
- 2024: D+20.9 2020: D+18.1 2016: D+11.6 2012: D+11.1 2008: D+12.3
Not yet ingested
- Civics
- —
Market trends
- HPI YoY
- ▼ -436.68%
- Current HPI
- 379.2342
- Rent YoY
- ▲ 0.28%
- Metro
- Bremerton-Silverdale-Port Orchard, WA
- State GDP YoY
- ▲ 4.65%
- F500 in state
- 22
Industry mix (Fortune 500 HQ in WA)
| Industry | F500 HQs | Revenue |
|---|---|---|
| Retail | 2 | $269B |
|
||
| Technology / Retail | 1 | $638B |
|
||
| Technology | 1 | $245B |
|
||
| Telecommunications | 1 | $38B |
|
||
| Food / Beverage | 1 | $36B |
|
||
| Automotive / Trucks | 1 | $34B |
|
||
Price history
+488.2% since first listed16 events — show timeline
- 2026-05-08 Pending — NWMLS as Distributed by MLS Grid
- 2026-04-29 Relisted — NWMLS as Distributed by MLS Grid
- 2026-03-20 Pending — NWMLS as Distributed by MLS Grid
- 2026-03-05 Price Changed $249,999 NWMLS as Distributed by MLS Grid
- 2026-02-12 Price Changed $275,000 NWMLS as Distributed by MLS Grid
- 2026-02-02 Price Changed $295,000 NWMLS as Distributed by MLS Grid
- 2026-01-15 Relisted — NWMLS as Distributed by MLS Grid
- 2025-12-10 Price Changed $320,000 NWMLS as Distributed by MLS Grid
- 2025-11-25 Price Changed $345,000 NWMLS as Distributed by MLS Grid
- 2025-11-14 Listed $350,000 NWMLS as Distributed by MLS Grid
- 2016-09-30 Sold (Public Records) $70,000 Public Records
- 2016-09-30 Sold (MLS) $70,000 NWMLS as Distributed by MLS Grid
- 2016-09-16 Pending — NWMLS as Distributed by MLS Grid
- 2016-07-23 Listed $75,000 NWMLS as Distributed by MLS Grid
- 1995-09-01 Sold (Public Records) $48,100 Public Records
- 1993-08-31 Sold (Public Records) $42,500 Public Records
Property tax history
+1.9%/yrLatest (2026): $1,538 · +1.4% YoY. Source: county tax records.
Cash-flow waterfall
monthlySold comps — $/sqft
last 12 mo · ≤1 miLoading sold comps…