 Multi-family
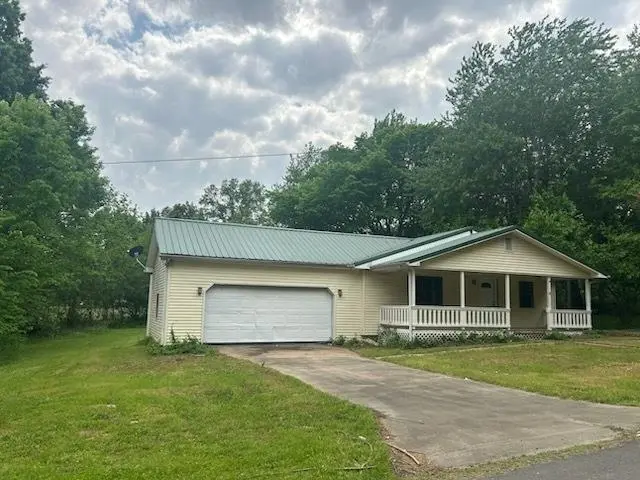
11450 Bonham St · Kevil, KY
Flood risk 1/10 · Minimal
- FEMA flood zone
- X (unshaded)
- Chance of flooding over 30 yrs
- 0.0%
- Est. flood insurance / yr
- $507 – $1,088
Fire risk 2/10 · Minimal
- Est. fire insurance / yr
- $839 – $1,559
Heat risk 5/10 · Moderate
- Hot days now (above 108°F)
- 7 days/yr
- Hot days in 30 yrs
- 20 days/yr
Wind risk 3/10 · Minor
- Chance of severe wind over 30 yrs
- 7.0%
Air-quality risk 2/10 · Minimal
- Unhealthy air days now
- 1 days/yr
- Unhealthy air days in 30 yrs
- 1 days/yr
Risk factors via First Street. Map © Google.
Why this score? — see what drove the B grade
The composite is a weighted blend of 9 inputs, each scored 0–100. Each bar is that input's sub-score; the figure is the points it added to the 100-point composite (weight × sub-score).
- Cash flow +30.0/30.0
- 1% rule +10.0/10.0
- DSCR +10.0/10.0
- ARV discount +7.5/15.0
- Schools +4.0/10.0
- Livability +3.0/5.0
- Rent growth +2.5/5.0
- Condition / age +2.5/5.0
- Appreciation +1.2/10.0
$88,000
🖨 Deal sheet (PDF) 📄 Offer letter ✓ Due diligence
Multi-family units
County records classify this as Multi-Family (2-4 Unit). Listing-text estimate: 1 unit. estimate disagrees with records
Listing remarks MLS
INVESTORS SPECIAL. WITH SOME TENDER LOVE AND CARE THIS WOULD MAKE A GREAT RENTAL OR EVEN A FLIP. OR A GREAT FIRST HOME FOR BUYERS WITH IMAGINATION AND THE SKILL AND WILLINGNESS TO PUT IN THE WORK.
Key facts
- 0.34 acre lot
- Garage
- Built 1952
Property features AI
Finance
- Other: Directions: From Ballard Co courthouse, head north on N 4th St / KY-286. Turn right onto KY-121 North stay on KY-121 N for several miles toward Kevil. Merge on US-60 East continue until you reach the Kevil area. Turn left on Bonham Street.
Exterior
- Parking: Attached garage
- Utilities: Utilities not specified
- Home design: Single family residence; Residential property; One-story home; Located in the Wheeler City subdivision; Facing direction not provided
- Construction: Vinyl siding; Slab foundation; Built year not provided
- Exterior features: Level lot; Metal roof
Interior
- Bathrooms: 1 full bathroom
- Interior features: Single-level living (1 story)
Neighborhood map
What this means for you Summary
Snapshot
- This is a 2-bed/2.0-bath multifamily listed at $88k.
Deal economics
- At list price, monthly cash flow is $781 ($9k/yr) — positive.
- The deal already cash-flows at list — no discount required.
- Meets the 1% rule at list price ($2k rent vs $88k).
- Recommended offer: $85k (3.0% below list) — sets the bar for market timing.
Location & tenants
- Location reads 60/100 on livability (#404 in KY) — a middle-class / working-renter tenant base. Strengths: cost of living A+, crime B+, housing B+; Watch: employment D, amenities F, commute F.
- Mccracken County (town): math 41% / reading 52% proficiency, ranked #16 of 165 in KY (top 10%) — families likely to look elsewhere, expect single-tenant / working-renter base with shorter leases.
- Zoned schools: Heath Elementary School (math 45% / reading 48%, grade D-, #133 of 676 statewide, top 20%, 484 students, 53% FRL); Heath Middle School (math 43% / reading 60%, grade C, #19 of 217 statewide, top 8%, 410 students, 48% FRL); Mccracken County High School (math 30% / reading 44%, grade F, #58 of 254 statewide, top 27%, 1,999 students, 43% FRL).
- Market conditions: 33 active listings in the ZIP; 187 units permitted in McCracken County in 2024 (104 in 5+ unit buildings).
Forward outlook
- Local home prices are declining (-3.0%/yr); year-one equity from $608 of loan paydown is wiped out by about $3k of value loss. Plan a longer hold.
- McCracken County population projected to shrink 9% by 2050 — rents likely to lag national; underwrite the cash flow, not the appreciation.
- At projected returns (-3.0% appreciation + 3.0% rent growth), your $25k cash investment doubles in ~4 years — after that, you're playing with house money.
Negotiation context
- It's been on market 38 days — a 3% lower offer ($85k) is reasonable based on typical stale-listing flexibility.
- 4 sale attempts since 8y ago with the ask held roughly flat each time — persistent listings suggest the price (not the market) is what's stuck; bring a comps-based counter.
Risks & watch-outs
- Watch-outs: built in 1952 — expect roof / HVAC / electrical / plumbing capex.
- Climate carrying-cost: extreme-heat days projected 7→20/yr by 2055 (HVAC capex compounding) — expect insurance premiums to compound above CPI over the hold.
Questions for the listing agent
- It's been on market 38 days. Have you received any prior offers? Is the seller open to a 3% concession, seller financing, or rate buy-down credit?
- Built in 1952 — when were the roof, HVAC, electrical panel, plumbing, and water heater last replaced?
- Is there a deadline driving the sale (1031 exchange, divorce, estate, relocation)? That informs how much negotiation room exists.
- Schools are F-rated, which usually means shorter tenancies and higher turnover. Who's the typical renter profile here, and what's been the actual vacancy rate?
- What's the average days-on-market for RENTAL listings here right now (not sales)? A rising rental-DOM trend means longer vacancies and softer asking-rent achievability than the comps imply.
- What's the recent tenant-quality profile in this submarket — average credit score on applications, eviction rate, late-payment / NSF rate, and stable-employment percentage? A property-management company in the area should have these aggregated.
- How much new apartment / multifamily construction is in the pipeline within 1–3 miles? Heavy new supply (>2% of stock underway) typically softens rents 12–24 months out; light construction supports rent growth.
Investment metrics
- 1% rule
- 2.00% ✓
- Cap rate
- 16.94%
- Cash-on-cash
- 38.02%
- DSCR
- 2.69
- GRM
- 4.2
CMA / ARV
No comps found within radius.
Projected returns pro-forma
-3.0% appreciation · 3.0% rent growth · sell at horizon
- IRR
- 34.1%
- Equity multiple
- 2.44×
- Total profit
- $35,488
- Equity at exit
- $13,121
- IRR
- 41.0%
- Equity multiple
- 4.86×
- Total profit
- $95,034
- Equity at exit
- $7,609
Cash invested: $24,640 (down + closing). Projections, not guarantees.
Landlord ↔ Tenant lean methodology
- Overall (STATE)
- 83 Strongly Landlord-Friendly
- State Kentucky
- 83 Strongly Landlord-Friendly · R+16
- County
- — inherits STATE
- City
- — inherits STATE
ZIP-level market 42053
- Home prices YoY
- -3.4%
- Active inventory
- 33
- Price-to-rent
- 8.3×
Monthly cashflow live
- Estimated rent
- $1,758 medium interval (Pro) →
- Mortgage (P&I)
- −$461
- Tax est. 1.5%
- −$110 /mo · $1,320/yr
- Insurance
- −$37
- HOA
- −$0
- Vacancy / Maint / Mgmt
- −$369
- Net cashflow
- $781
Break-even live
Sensitivity live
| Price | -10% $841 | -5% $811 | +0% $781 | +5% $750 | +10% $720 |
|---|---|---|---|---|---|
| Rent | -10% $642 | -5% $711 | +0% $781 | +5% $850 | +10% $920 |
| Rate | -1.0pp $825 | -0.5pp $803 | base $781 | +0.5pp $758 | +1.0pp $735 |
2-unit breakdown (identical units grouped — click to expand)
| Units | Beds | Baths | Est. rent |
|---|---|---|---|
| 2× units | 2 | 1 | $1,758 |
| #1 | 2 | 1 | $879 |
| #2 | 2 | 1 | $879 |
| Total (2 units) | $1,758 | ||
UW: 25.0% down · 7.5% · 30yr · 1.5% tax · 5.0% vac · 8.0% maint · 8.0% mgmt
Financing live
Cash to close
- Down payment
- $22,000
- Closing costs
- $2,640
- Reserves months
- —
- Total cash needed
- —
Loan-product check · same deal, 3 products live
Conventional
25% down · 7.5% · 30yr
- Down + closing
- —
- Monthly P&I
- —
- Monthly cashflow
- —
- DSCR
- —
- Eligible?
- —
Personal DTI + credit; lowest rate.
DSCR
20% down · 8.5% · 30yr
- Down + closing
- —
- Monthly P&I
- —
- Monthly cashflow
- —
- DSCR
- —
- Eligible?
- —
No personal income docs; deal must DSCR.
Hard money
10% down · 12.0% · 12mo
- Down + closing
- —
- Monthly P&I
- —
- Monthly cashflow
- —
- DSCR
- —
- Eligible?
- —
Short-term bridge; refi at stabilization.
Listing history 10 events
-
2026-06-09days on market $88,000 Active 38 DOM
-
2026-06-08days on market $88,000 Active 37 DOM
-
2026-06-07statusdays on market $88,000 Active 36 DOM
-
2026-05-18status Pending 196-char remark
Show marketing remark (196 chars)
INVESTORS SPECIAL. WITH SOME TENDER LOVE AND CARE THIS WOULD MAKE A GREAT RENTAL OR EVEN A FLIP. OR A GREAT FIRST HOME FOR BUYERS WITH IMAGINATION AND THE SKILL AND WILLINGNESS TO PUT IN THE WORK.
-
2026-05-01$88,000 Active 196-char remark
Show marketing remark (196 chars)
INVESTORS SPECIAL. WITH SOME TENDER LOVE AND CARE THIS WOULD MAKE A GREAT RENTAL OR EVEN A FLIP. OR A GREAT FIRST HOME FOR BUYERS WITH IMAGINATION AND THE SKILL AND WILLINGNESS TO PUT IN THE WORK.
-
2026-04-30$88,000 Active 196-char remark
-
2020-01-31soldstatus $14,000
Show marketing remark (182 chars)
Looking for a "FIXER - UPPER" in the county. Home selling "AS-IS". All offers require Proof of funds or prequal letter. Will not qualify for FHA or Rural Housing.
-
2018-10-16$16,900
Show marketing remark (182 chars)
Looking for a "FIXER - UPPER" in the county. Home selling "AS-IS". All offers require Proof of funds or prequal letter. Will not qualify for FHA or Rural Housing.
-
2018-09-11$36,900
-
2006-09-27soldstatus $36,889
ⓘ Source: listings_history table (triggers on properties + properties_extension) + one-shot
backfill from property_details.listing_events for pre-trigger history.
Climate risk First Street
- Flood 1/10 Low FEMA zone X (unshaded) · 0% chance over 30 yrs
- Wildfire 2/10 Low
- Heat 5/10 Major 7 d/yr ≥108°F today · 20 d/yr by 30 yrs out
- Wind 3/10 Moderate 7% chance of damaging wind over 30 yrs
- Air quality 2/10 Low 1 unhealthy d/yr today · 1 by 30 yrs out
Nearby sold comps map
Loading sold comps map…
Walkable amenities ~0.75 mi
Loading nearby amenities…
Taxation est. · year 1
- Rental income
- $21,096
- − Mortgage interest
- −$4,929
- − Property taxes
- −$1,320
- − Insurance
- −$440
- − Repairs & maintenance
- −$1,688
- − Management
- −$1,688
- − Depreciation
- −$2,560
- Taxable income
- $8,471
- Est. tax owed @ 24.0%
- −$2,033
- After-tax cash flow
- $7,335/yr
For passive investors: Depreciation is non-cash, so a rental often shows a tax loss while cash-flowing — sheltering income. Rental losses are passive: they offset passive income freely, and up to $25,000/yr can offset ordinary (W-2) income if you actively participate and your MAGI is under $100k (phasing out to $0 by $150k); unused losses carry forward. On sale, claimed depreciation is recaptured at up to 25%, and gains may owe capital-gains tax (a 1031 exchange can defer both). Figures are a year-1 estimate at your 24.0% rate — not tax advice; consult a CPA.
Schools (NCES district)
- District
- Mccracken County
- NCES district ID
- 2103960
- Math proficiency
- 41% ▼ -15.00%
- Reading proficiency
- 52% ▼ -15.00%
- Median HH income
- $49,976
- Composite
- 39.84/100
- National rank
- #3871
- State rank
- #16 of 165 in KY
Livability — Kevil
- Score
- 60/100
- State rank
- #404
- US rank
- #19269
Category grades
Schools grade is shown separately in the Schools card above.
Census & demographics
- Population (ZIP)
- 4,882
Population outlook (McCracken County) Hauer SSP2
- Today (2025)
- 64,237 people
- By 2030
- 63,468 · -1.2%
- By 2040
- 61,221 · -4.7%
- By 2050
- 58,432 · -9.0%
- By 2075
- 52,668 · -18.0%
- By 2100
- 44,517 · -30.7%
Race, ethnicity, and origin ACS 2023
- Neighborhood character
- Predominantly White (95%)
- Race & ethnicity
- White 95% Hispanic / Latino 3% Two or more races 1%
- Common ancestry
- Italian 4% Lithuanian 2% Slovak 1%
- Foreign-born
- 1% · Canada
- Languages at home
- 98% English-only · Spanish 1% Arabic 1%
Political lean MEDSL · McCracken
- 2024 margin
- Solid R (+34.9) · D 31.9% · R 66.8% · Other 1.2%
- 2008→2024 swing
- -9.7pp toward R · 2008: -25.2pp · 2024: -34.9pp
- All cycles
- 2024: R+34.9 2020: R+31.7 2016: R+37.2 2012: R+32.5 2008: R+25.2
Not yet ingested
- Civics
- —
Market trends
- HPI YoY
- ▼ -7.68%
- Current HPI
- 220.3358
- Rent YoY
- —
- Metro
- —
- State GDP YoY
- ▲ 1.81%
- F500 in state
- 4
Industry mix (Fortune 500 HQ in KY)
| Industry | F500 HQs | Revenue |
|---|---|---|
| Healthcare | 1 | $118B |
|
||
| Food / Beverage | 1 | $7B |
|
||
Price history
+116.9% since first listed10 events — show timeline
- 2026-06-10 Delisted — WKRMLS
- 2026-06-09 Sold (MLS) $80,000 WKRMLS
- 2026-06-05 Sold (MLS) $80,000 GORAMLS
- 2026-05-18 Pending — GORAMLS
- 2026-05-01 Listed $88,000 GORAMLS
- 2026-04-30 Listed $88,000 WKRMLS
- 2020-01-31 Sold (MLS) $14,000 WKRMLS
- 2018-10-16 Listed $16,900 WKRMLS
- 2018-09-11 Listed $36,900 WKRMLS
- 2006-09-27 Sold (Public Records) $36,889 Public Records
Property tax history
-11.4%/yrLatest (2025): $133 · -1.8% YoY. Source: county tax records.
Cash-flow waterfall
monthlySold comps — $/sqft
last 12 mo · ≤1 miLoading sold comps…