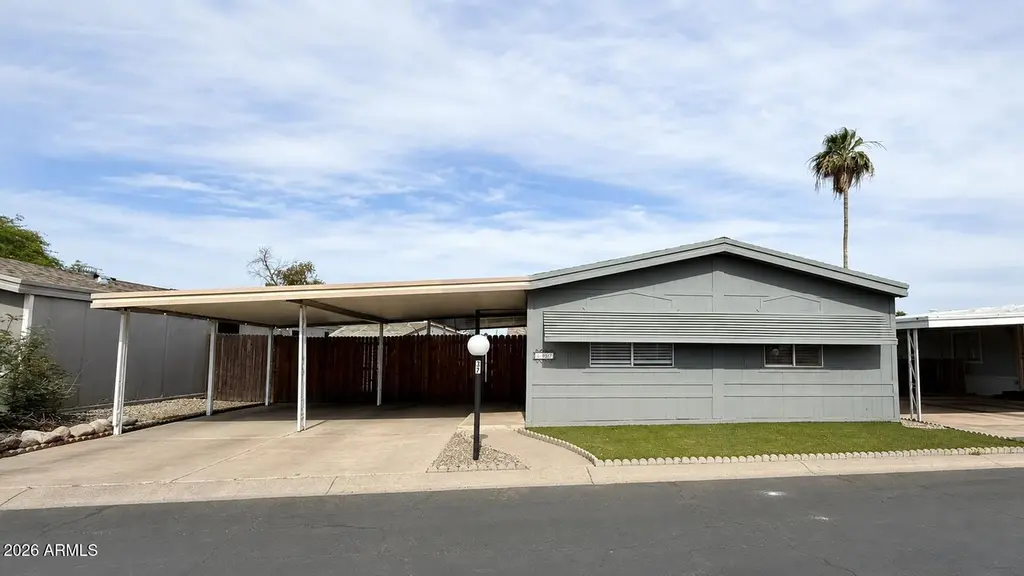
10951 N 91st Ave #37 · Peoria, AZ
Flood risk 1/10 · Minimal
- FEMA flood zone
- X (shaded)
- Chance of flooding over 30 yrs
- 0.0%
- Est. flood insurance / yr
- $507 – $1,088
Fire risk 1/10 · Minimal
- Est. fire insurance / yr
- $610 – $1,132
Heat risk 9/10 · Severe
- Hot days now (above 113°F)
- 7 days/yr
- Hot days in 30 yrs
- 19 days/yr
Wind risk 1/10 · Minimal
- Chance of severe wind over 30 yrs
- —
Air-quality risk 2/10 · Minimal
- Unhealthy air days now
- 1 days/yr
- Unhealthy air days in 30 yrs
- 1 days/yr
Risk factors via First Street. Map © Google.
Why this score? — see what drove the C+ grade
The composite is a weighted blend of 9 inputs, each scored 0–100. Each bar is that input's sub-score; the figure is the points it added to the 100-point composite (weight × sub-score).
- Cash flow +30.0/30.0
- DSCR +10.0/10.0
- 1% rule +8.5/10.0
- Livability +3.8/5.0
- Condition / age +3.8/5.0
- Schools +3.5/10.0
- Rent growth +2.7/5.0
- ARV discount +0.0/15.0
- Appreciation +0.0/10.0
$135,000
🖨 Deal sheet (PDF) 📄 Offer letter ✓ Due diligence
Listing remarks
This is the one buyers wait for and it is now available in Peoria Polynesian Village. Freshly updated, thoughtfully prepared, and loaded with the kind of big-ticket improvements that make buyers feel confident from day one, this home delivers space, function, and serious value in an all-ages Peoria community. The split floor plan is exactly what buyers love: a private primary suite tucked at the rear of the home with its own en-suite bath, while two additional bedrooms sit at the front, creating separation, flexibility, and room for guests, work, hobbies, or family. The main living area opens beautifully into the dining and kitchen spaces, giving the home an easy, comfortable flow that feel
Key facts
- 4 parking spots
- Community pool
- Built 1998
Property features AI
Finance
- HOA & community: Land lease of $740 monthly; No association fees listed; Community pool; Community spa; Playground
Exterior
- Parking: 4 covered parking spaces; 4 carport spaces
- Utilities: City water; Public sewer
- Home design: Manufactured / mobile home; Leasehold ownership
- Construction: Wood frame construction; Painted exterior; Composition roof; Builder-reported building area
- Exterior features: Private yard; Storage; Shed(s); Wood fencing; Gravel/stone in back; Synthetic grass in front; Private maintained road
Interior
- Kitchen: Refrigerator; Dishwasher
- Bedrooms: Up to 3 possible bedrooms
- Flooring: Carpet; Vinyl; Tile
- Bathrooms: 2 full bathrooms
- Heating & cooling: Heat pump and electric heating; Central air conditioning
- Interior features: No interior steps; Vaulted ceilings; Master bedroom with 3/4 bath
- Laundry & utility: Laundry inside with washer/dryer hookup only
Neighborhood map
What this means for you Summary
Snapshot
- This is a 3-bed/2.0-bath manufactured listed at $135k. Condition is rated good.
Deal economics
- At list price, monthly cash flow is $507 ($6k/yr) — positive.
- The deal already cash-flows at list — no discount required.
- Meets the 1% rule at list price ($2k rent vs $135k).
- Recommended offer: $133k (1.5% below list) — sets the bar for market timing.
- Cap rate 10.8% vs local median 3.3% in Peoria — top-decile yield for the area; either an underpriced asset or a hidden risk that comps aren't pricing in. Stress-test before assuming the spread holds.
Location & tenants
- Location reads 76/100 on livability (#14 in AZ, #3,603 nationally) — a middle-class / working-renter tenant base. Strengths: housing A+, commute A, employment A; Watch: cost of living C-, amenities D, health & safety F.
- Peoria Unified School District (4237) (suburban): math 36% / reading 42% proficiency, ranked #64 of 249 in AZ (top 26%) — families likely to look elsewhere, expect single-tenant / working-renter base with shorter leases.
- Zoned schools: Peoria Elementary School (math 21% / reading 29%, grade F, #638 of 1,109 statewide, top 58%, 554 students, 68% FRL); Peoria High School (math 18% / reading 22%, grade F, #225 of 381 statewide, top 60%, 1,566 students, 54% FRL) — zoned schools average 61% FRL vs 35% district-wide (26 pts higher); higher-poverty schools than district average — tighter screening recommended.
- Zoned-school proficiency averages 22% at this address vs 39% district-wide (-16 pts) — the specific schools serving this property underperform the Peoria Unified School District (4237) average; the district grade overstates school quality for this exact location.
- Market conditions: Rents flat; 333 active listings in the ZIP; 40 comparable units currently listed for rent nearby; rentals at typical pace (median 23d on market — plan ~3-4 weeks tenant-placement turnaround); 36,011 units permitted in Maricopa County in 2024 (12,801 in 5+ unit buildings).
- This rent runs 32% of the median local income ($67k/yr) — at the standard rent-burdened threshold; future hikes will face affordability resistance.
Forward outlook
- Local home prices are declining (-3.0%/yr); year-one equity from $933 of loan paydown is wiped out by about $4k of value loss. Plan a longer hold.
- Maricopa County population projected at +38% by 2050 — long-run rental-demand tailwind backs the buy-and-hold thesis.
- At projected returns (-3.0% appreciation + 0.6% rent growth), your $38k cash investment doubles in ~10 years — after that, you're playing with house money.
Negotiation context
- It's been on market 22 days — a 2% lower offer ($133k) is reasonable based on typical stale-listing flexibility.
Risks & watch-outs
- Climate carrying-cost: extreme-heat days projected 7→19/yr by 2055 (HVAC capex compounding) — expect insurance premiums to compound above CPI over the hold.
Questions for the listing agent
- Is there a deadline driving the sale (1031 exchange, divorce, estate, relocation)? That informs how much negotiation room exists.
- Schools are B-rated — typically a magnet for longer-tenancy family renters. What's the average tenant stay here, and is there a school-zone premium baked into asking?
- What's the average days-on-market for RENTAL listings here right now (not sales)? A rising rental-DOM trend means longer vacancies and softer asking-rent achievability than the comps imply.
- What's the recent tenant-quality profile in this submarket — average credit score on applications, eviction rate, late-payment / NSF rate, and stable-employment percentage? A property-management company in the area should have these aggregated.
- How much new for-sale + rental construction is in the pipeline within 1–3 miles? Heavy new supply typically softens prices + rents 12–24 months out; constrained supply supports both.
Investment metrics
- 1% rule
- 1.35% ✓
- Cap rate
- 10.80%
- Cash-on-cash
- 16.08%
- DSCR
- 1.72
- GRM
- 6.2
CMA / ARV
- ARV (on-the-fly)
- $92,352
- Comps found
- 12
Show comp detail 12 sales within ~0.75 mi
| Address | Dist | Beds/Ba | Sqft | Sold | Price | $/sf | Match |
|---|---|---|---|---|---|---|---|
| 10951 N 91st Ave #218 | 0.00mi | 3/2.0 | 1,168 (-6%) | 1mo | $114,000 | $98 | 88 |
| 10951 N 91st Ave #250 | 0.22mi | 3/2.0 | 1,246 (-0%) | 11mo | $164,000 | $132 | 80 |
| 11411 N 91st Ave #195 | 0.21mi | 2/2.0 (-1) | 1,232 (-1%) | 7mo | $42,000 | $34 | 77 |
| 11411 N 91st Ave #80 | 0.16mi | 3/2.0 | 1,344 (+8%) | 4mo | $43,000 | $32 | 77 |
| 10951 N 91st Ave #245 | 0.00mi | 4/2.0 (+1) | 1,344 (+8%) | 6mo | $135,000 | $100 | 77 |
| 10951 N 91st Ave #61 | 0.23mi | 3/2.0 | 1,320 (+6%) | 4mo | $79,000 | $60 | 76 |
| 10951 N 91st Ave #16 | 0.22mi | 3/2.0 | 1,344 (+8%) | 3mo | $65,000 | $48 | 74 |
| 10951 N 91 Ave #23 | 0.23mi | 3/2.0 | 1,152 (-8%) | 4mo | $85,000 | $74 | 72 |
| 11411 N 91st Ave #29 | 0.16mi | 3/2.0 | 1,344 (+8%) | 9mo | $79,500 | $59 | 72 |
| 11411 N 91st Ave #225 | 0.16mi | 2/2.0 (-1) | 1,144 (-8%) | 7mo | $88,000 | $77 | 68 |
| 11411 N 91st Ave #218 | 0.32mi | 2/2.0 (-1) | 1,344 (+8%) | 7mo | $52,000 | $39 | 61 |
| 11000 N 91st Ave #101 | 0.36mi | 2/2.0 (-1) | 1,350 (+8%) | 10mo | $120,000 | $89 | 56 |
Match score weights: distance 35% · size 25% · config 20% · recency 20%. Top-matched comps best support the ARV.
Projected returns pro-forma
-3.0% appreciation · 0.62% rent growth · sell at horizon
- IRR
- 4.3%
- Equity multiple
- 1.16×
- Total profit
- $6,155
- Equity at exit
- $20,129
- IRR
- 11.5%
- Equity multiple
- 1.80×
- Total profit
- $30,342
- Equity at exit
- $11,672
Cash invested: $37,800 (down + closing). Projections, not guarantees.
Landlord ↔ Tenant lean methodology
- Overall (STATE)
- 87 Strongly Landlord-Friendly
- State Arizona
- 87 Strongly Landlord-Friendly · R+3
- County
- — inherits STATE
- City
- — inherits STATE
ZIP-level market 85345
- Home prices YoY
- -19.8%
- Rents YoY
- 0.6%
- Active inventory
- 333
- Price-to-rent
- 6.2×
Monthly cashflow live
- Estimated rent
- $1,822 high interval (Pro) →
- Mortgage (P&I)
- −$708
- Tax est. 1.5%
- −$169 /mo · $2,025/yr
- Insurance
- −$56
- HOA
- −$0
- Vacancy / Maint / Mgmt
- −$383
- Net cashflow
- $507
Break-even live
Sensitivity live
| Price | -10% $600 | -5% $553 | +0% $507 | +5% $460 | +10% $413 |
|---|---|---|---|---|---|
| Rent | -10% $363 | -5% $435 | +0% $507 | +5% $579 | +10% $651 |
| Rate | -1.0pp $575 | -0.5pp $541 | base $507 | +0.5pp $472 | +1.0pp $436 |
UW: 25.0% down · 7.5% · 30yr · 1.5% tax · 5.0% vac · 8.0% maint · 8.0% mgmt
Financing live
Cash to close
- Down payment
- $33,750
- Closing costs
- $4,050
- Reserves months
- —
- Total cash needed
- —
Loan-product check · same deal, 3 products live
Conventional
25% down · 7.5% · 30yr
- Down + closing
- —
- Monthly P&I
- —
- Monthly cashflow
- —
- DSCR
- —
- Eligible?
- —
Personal DTI + credit; lowest rate.
DSCR
20% down · 8.5% · 30yr
- Down + closing
- —
- Monthly P&I
- —
- Monthly cashflow
- —
- DSCR
- —
- Eligible?
- —
No personal income docs; deal must DSCR.
Hard money
10% down · 12.0% · 12mo
- Down + closing
- —
- Monthly P&I
- —
- Monthly cashflow
- —
- DSCR
- —
- Eligible?
- —
Short-term bridge; refi at stabilization.
Rent comps 40 comps
| Address | Beds | Baths | Sqft | Rent | $/sqft | DOM | Units | Dist |
|---|---|---|---|---|---|---|---|---|
| 8821 W Sahuaro Dr Peoria, AZ | 3.0 | 2.0 | 1074 | $1,595 | $1.49 | 25d | 1 | 0.14mi |
| 8821 W Sahuaro Dr Peoria, AZ | 3.0 | 2.0 | 1074 | $1,595 | $1.49 | 4d | 1 | 0.14mi |
| 8821 W Sahuaro Dr Peoria, AZ | 3.0 | 2.0 | 1074 | $1,695 | $1.58 | 0d | 1 | 0.14mi |
| 11411 N 91st Ave Unit 213 Peoria, AZ | 2.0 | 2.0 | 858 | $1,399 | $1.63 | 25d | 1 | 0.15mi |
| 11411 N 91st Ave Unit 134 Peoria, AZ | 3.0 | 2.0 | 1310 | $1,599 | $1.22 | 45d | 1 | 0.31mi |
| 8650 W Peoria Ave Peoria, AZ | 1.0–2.0 | 1.0–2.0 | 836 | $1,492 | $1.78 | 0d | 18 | 0.37mi |
| 9221 W Gary Rd Peoria, AZ | 4.0 | 1.0 | 1300 | $2,000 | $1.54 | 45d | 1 | 0.41mi |
| 8930 W Monroe St Peoria, AZ | 3.0 | 2.0 | 1300 | $1,899 | $1.46 | 45d | 2 | 0.42mi |
| 8930 W Monroe St Peoria, AZ | 3.0 | 2.0 | 1300 | $2,099 | $1.61 | 25d | 1 | 0.42mi |
| 10221 N 87th Ln Peoria, AZ | 3.0 | 2.0 | 1232 | $2,059 | $1.67 | 45d | 1 | 0.44mi |
| 8560 W Peoria Ave Peoria, AZ | 2.0 | 1.0 | 888 | $1,399 | $1.58 | 0d | 8 | 0.44mi |
| 10860 N 85th Ave Peoria, AZ | 1.0–2.0 | 1.0 | 630 | $1,350 | $2.14 | 5d | 1 | 0.45mi |
| 10860 N 85th Ave Peoria, AZ | 2.0 | 1.0 | 780 | $1,225 | $1.57 | 45d | 1 | 0.45mi |
| 10860 N 85th Ave Unit 87 Peoria, AZ | 2.0 | 1.0 | 780 | $1,149 | $1.47 | 6d | 1 | 0.46mi |
| 10101 N 91st Ave #109 Peoria, AZ | 2.0 | 2.5 | 1161 | $1,395 | $1.20 | 4d | 1 | 0.58mi |
| 9002 W Malapai Dr Peoria, AZ | 3.0 | 2.0 | 1270 | $2,040 | $1.61 | 21d | 1 | 0.61mi |
| 8311 W Edwards St Peoria, AZ | 3.0 | 2.0 | 1242 | $2,100 | $1.69 | 25d | 1 | 0.72mi |
| 8834 W Purdue Ave Peoria, AZ | 3.0 | 2.0 | 1319 | $1,800 | $1.36 | 4d | 1 | 0.76mi |
| 11110 N 82nd Ln Peoria, AZ | 3.0 | 2.0 | 1350 | $1,899 | $1.41 | 25d | 1 | 0.79mi |
| 9426 W Monroe St Peoria, AZ | 3.0 | 3.5 | 1405 | $1,800 | $1.28 | 18d | 1 | 0.82mi |
| 10316 N 94th Ln Peoria, AZ | 3.0 | 2.0 | 1352 | $2,000 | $1.48 | 25d | 1 | 0.82mi |
| 8630 W Shaw Butte Dr Peoria, AZ | 3.0 | 2.0 | 1284 | $1,951 | $1.52 | 14d | 1 | 0.84mi |
| 8280 W Madison St Peoria, AZ | 2.0 | 2.0 | 800 | $1,400 | $1.75 | 45d | 1 | 0.89mi |
| 9323 W Ironwood Dr Peoria, AZ | 3.0 | 2.0 | 1306 | $1,985 | $1.52 | 25d | 1 | 0.90mi |
| 9323 W Ironwood Dr Peoria, AZ | 3.0 | 2.0 | 1306 | $2,085 | $1.60 | 45d | 1 | 0.90mi |
| 8551 W Carol Ave Peoria, AZ | 3.0 | 2.0 | 1323 | $2,095 | $1.58 | 0d | 1 | 1.00mi |
| 11014 N 81st Ave Peoria, AZ | 3.0 | 3.0 | 1133 | $1,699 | $1.50 | 0d | 1 | 1.01mi |
| 11014 N 81st Ave Peoria, AZ | 3.0 | 3.0 | 1133 | $1,699 | $1.50 | 6d | 1 | 1.01mi |
| 10701 N 99th Ave Unit 230 Peoria, AZ | 2.0 | 2.0 | 784 | $1,099 | $1.40 | 21d | 1 | 1.04mi |
| 10104 N 96th Dr Unit A Peoria, AZ | 2.0 | 2.0 | 1072 | $1,750 | $1.63 | 25d | 1 | 1.06mi |
| 8165 W Whitney Dr Peoria, AZ | 1.0–2.0 | 1.0–2.0 | 911 | $2,223 | $2.44 | 0d | 228 | 1.10mi |
| 8563 W Mission Ln Peoria, AZ | 3.0 | 2.0 | 1323 | $1,950 | $1.47 | 25d | 1 | 1.13mi |
| 9626 W Mountain View Rd Unit A Peoria, AZ | 2.0 | 2.0 | 1156 | $1,500 | $1.30 | 45d | 1 | 1.17mi |
| 10110 N 97th Dr Unit A Peoria, AZ | 2.0 | 1.5 | 1025 | $1,500 | $1.46 | 25d | 1 | 1.17mi |
| 8940 W Olive Ave Peoria, AZ | 2.0 | 2.0 | 1446 | $1,600 | $1.11 | 45d | 1 | 1.17mi |
| 8940 W Olive Ave Peoria, AZ | 2.0 | 2.0 | 897 | $1,400 | $1.56 | 18d | 1 | 1.17mi |
| 8610 W Eva St Peoria, AZ | 3.0 | 2.0 | 1208 | $2,035 | $1.68 | 23d | 1 | 1.18mi |
| 8610 W Eva St Peoria, AZ | 3.0 | 2.0 | 1208 | $1,985 | $1.64 | 5d | 1 | 1.18mi |
| 12480 N 83rd Dr Peoria, AZ | 3.0 | 2.0 | 1410 | $1,895 | $1.34 | 3d | 1 | 1.22mi |
| 9592 N 82nd Ave Peoria, AZ | 3.0 | 2.5 | 1401 | $1,775 | $1.27 | 16d | 1 | 1.23mi |
Listing history 14 events
-
2026-06-21days on market $135,000 Active 22 DOM
-
2026-06-18days on market $135,000 Active 19 DOM
-
2026-06-17days on market $135,000 Active 18 DOM
-
2026-06-16days on market $135,000 Active 17 DOM
-
2026-06-15days on market $135,000 Active 16 DOM
-
2026-06-13days on market $135,000 Active 14 DOM
-
2026-06-13days on market $135,000 Active 13 DOM
-
2026-06-09days on market $135,000 Active 10 DOM
-
2026-06-08days on market $135,000 Active 9 DOM
-
2026-06-07days on market $135,000 Active 8 DOM
-
2026-06-04days on market $135,000 Active 5 DOM
-
2026-06-03days on market $135,000 Active 4 DOM
-
2026-06-02days on market $135,000 Active 3 DOM
-
2026-06-01days on market $135,000 Active 2 DOM
ⓘ Source: listings_history table (triggers on properties + properties_extension) + one-shot
backfill from property_details.listing_events for pre-trigger history.
Climate risk First Street
- Flood 1/10 Low FEMA zone X (shaded) · 0% chance over 30 yrs
- Wildfire 1/10 Low
- Heat 9/10 Extreme 7 d/yr ≥113°F today · 19 d/yr by 30 yrs out
- Wind 1/10 Low
- Air quality 2/10 Low 1 unhealthy d/yr today · 1 by 30 yrs out
Nearby sold comps map
Loading sold comps map…
Walkable amenities ~0.75 mi
Loading nearby amenities…
Taxation est. · year 1
- Rental income
- $21,867
- − Mortgage interest
- −$7,562
- − Property taxes
- −$2,025
- − Insurance
- −$675
- − Repairs & maintenance
- −$1,749
- − Management
- −$1,749
- − Depreciation
- −$3,927
- Taxable income
- $4,179
- Est. tax owed @ 24.0%
- −$1,003
- After-tax cash flow
- $5,076/yr
For passive investors: Depreciation is non-cash, so a rental often shows a tax loss while cash-flowing — sheltering income. Rental losses are passive: they offset passive income freely, and up to $25,000/yr can offset ordinary (W-2) income if you actively participate and your MAGI is under $100k (phasing out to $0 by $150k); unused losses carry forward. On sale, claimed depreciation is recaptured at up to 25%, and gains may owe capital-gains tax (a 1031 exchange can defer both). Figures are a year-1 estimate at your 24.0% rate — not tax advice; consult a CPA.
Condition & rehab AI · 12 photos
This home is in good condition with a fresh, updated look. It offers a good balance of functionality and curb appeal, making it a solid investment opportunity.
Value-add opportunities
- Both Painting interior walls — Fresh paint can enhance the home's curb appeal and interior aesthetics.
- Both Updating ceiling fans — New ceiling fans can improve air circulation and add a modern touch.
- Both Landscaping improvements — Enhanced landscaping can increase curb appeal and property value.
- Both Reorganizing interior spaces — Improved layout can maximize functionality and increase the home's perceived value.
- Both Adding smart home features — Smart home technology can increase convenience and add value to the property.
Renovation cost estimate screening
Value-add ROI direction
- Both Painting interior walls — Fresh paint can enhance the home's curb appeal and interior aesthetics. ↑
- Both Updating ceiling fans — New ceiling fans can improve air circulation and add a modern touch. ↑
- Both Landscaping improvements — Enhanced landscaping can increase curb appeal and property value. ↑
- Both Reorganizing interior spaces — Improved layout can maximize functionality and increase the home's perceived value. ↑
- Both Adding smart home features — Smart home technology can increase convenience and add value to the property. ↑
ⓘ Cost ranges are severity-bucket heuristics (US national rule-of-thumb). Get contractor quotes + a written scope before underwriting a rehab budget.
Schools (NCES district)
- District
- Peoria Unified School District (4237)
- NCES district ID
- 0406250
- Math proficiency
- 36% ▼ -14.00%
- Reading proficiency
- 42% ▼ -8.00%
- Median HH income
- $60,171
- Composite
- 34.62/100
- National rank
- #5152
- State rank
- #64 of 249 in AZ
Livability — Peoria
- Score
- 76/100
- State rank
- #14
- US rank
- #3603
Category grades
Schools grade is shown separately in the Schools card above.
Census & demographics
- Census place
- Peoria, AZ
- County
- Maricopa County · 4,537,380 people
- City population
- 206,687
- Metro
- Phoenix-Mesa-Chandler, AZ
- Population (ZIP)
- 60,918
- Household income
- $67,380
- Rent vs Own
- Severe rent burden
- 1879.0
Population outlook (Maricopa County) Hauer SSP2
- Today (2025)
- 4,979,203 people
- By 2030
- 5,378,229 · +8.0%
- By 2040
- 6,156,598 · +23.6%
- By 2050
- 6,872,376 · +38.0%
- By 2075
- 8,401,270 · +68.7%
- By 2100
- 9,247,439 · +85.7%
Race, ethnicity, and origin ACS 2023
- Neighborhood character
- Diverse neighborhood (Simpson 0.62)
- Race & ethnicity
- White 51% Hispanic / Latino 34% Two or more races 14% Black 5% Asian 4% Native American 2%
- Hispanic origin (detail)
- Mexican 29%
- Common ancestry
- Romanian 2% Italian 2% Slovak 1%
- Foreign-born
- 13% · Canada, Vietnam
- Languages at home
- 76% English-only · Spanish 18% Other Indo-European 1% Vietnamese 1%
Political lean MEDSL · Maricopa
- 2024 margin
- Toss-up / Even · D 47.7% · R 51.2% · Other 1.1%
- 2008→2024 swing
- +7.1pp toward D · 2008: -10.6pp · 2024: -3.5pp
- All cycles
- 2024: R+3.5 2020: D+2.2 2016: R+3.5 2012: R+12.0 2008: R+10.6
Not yet ingested
- Civics
- —
Market trends
- HPI YoY
- ▼ -80.77%
- Current HPI
- 328.1069
- Rent YoY
- ▲ 0.62%
- Metro
- Phoenix-Mesa-Chandler, AZ
- State GDP YoY
- ▲ 4.54%
- F500 in state
- 20
Industry mix (Fortune 500 HQ in AZ)
| Industry | F500 HQs | Revenue |
|---|---|---|
| Technology | 2 | $13B |
|
||
| Mining / Metals | 1 | $23B |
|
||
| Environmental Services | 1 | $16B |
|
||
| Metals / Steel | 1 | $14B |
|
||
| Technology Distribution | 1 | $9B |
|
||
| Homebuilding | 1 | $8B |
|
||
Price history
1 event — show timeline
- 2026-05-30 Listed $135,000 ARMLS
Cash-flow waterfall
monthlySold comps — $/sqft
last 12 mo · ≤1 miLoading sold comps…