870 Mayson Turner Rd NW Unit 12xx · Atlanta, GA
Flood risk No data
- FEMA flood zone
- —
- Chance of flooding over 30 yrs
- —
- Est. flood insurance / yr
- —
Fire risk No data
- Est. fire insurance / yr
- —
Heat risk No data
- Hot days now (above threshold)
- —
- Hot days in 30 yrs
- —
Wind risk No data
- Chance of severe wind over 30 yrs
- —
Air-quality risk No data
- Unhealthy air days now
- —
- Unhealthy air days in 30 yrs
- —
Risk factors via First Street. Map © Google.
Why this score? — see what drove the C- grade
The composite is a weighted blend of 9 inputs, each scored 0–100. Each bar is that input's sub-score; the figure is the points it added to the 100-point composite (weight × sub-score).
- Cash flow +19.9/30.0
- ARV discount +7.5/15.0
- DSCR +6.3/10.0
- 1% rule +5.3/10.0
- Livability +4.2/5.0
- Condition / age +3.8/5.0
- Rent growth +3.1/5.0
- Schools +2.7/10.0
- Appreciation +0.0/10.0
$145,000
🖨 Deal sheet 📄 Offer letter ✓ Due diligence
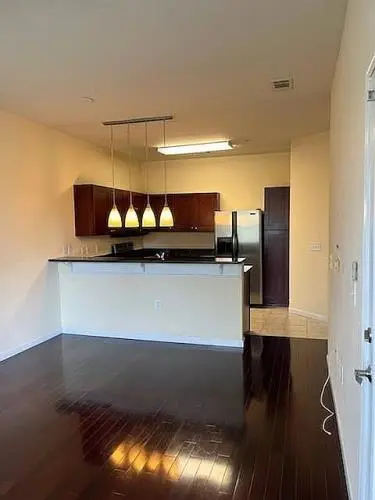
Listing remarks
Great 2nd floor Condo located in the heart of Historic Westside Village with granite countertops, hardwood floors and stainless steel appliances. Large master bedroom with walk-in closet. Huge master bath with garden tub and separate shower. Ceiling fans, Internet included. Secondary bedroom can be used as den, nursery or home office. Gated community with gym, clubhouse, pool, assigned covered parking and security. Conveniently right next to MARTA, shopping, minutes from Beltline, the Mercedes Benz stadium and downtown Atlanta. Great Opportunity. Reasonable offers considered.
Key facts
- Walk-in closet
- Separate shower
- Granite countertops
Tags
Neighborhood map
What this means for you Summary
Snapshot
- This is a 2-bed/?-bath other listed at $145k. Condition is rated good.
Deal economics
- At list price, monthly cash flow is $175 ($2k/yr) — positive.
- The deal already cash-flows at list — no discount required.
- Meets the 1% rule at list price ($1k rent vs $145k).
- Recommended offer: $141k (3.0% below list) — sets the bar for market timing.
- Cap rate 7.7% vs local median 3.1% in Atlanta — top-decile yield for the area; either an underpriced asset or a hidden risk that comps aren't pricing in. Stress-test before assuming the spread holds.
Location & tenants
- Location reads 83/100 on livability (#6 in GA, #919 nationally) — a professional / high-income tenant draw. Strengths: amenities A+, commute A+, housing A+; Watch: schools C-, cost of living C-.
- Atlanta Public Schools (urban): math 28% / reading 35% proficiency, ranked #80 of 174 in GA (top 46%) — families likely to look elsewhere, expect single-tenant / working-renter base with shorter leases; 71% free/reduced lunch — lower-income household profile, screen leases tightly.
- Market conditions: Rents rising (+2.5%/yr); 293 active listings in the ZIP; 40 comparable units currently listed for rent nearby; rentals at typical pace (median 21d on market — plan ~3-4 weeks tenant-placement turnaround); lower-income renter base — watch delinquency; 11,565 units permitted in Fulton County in 2024 (8,159 in 5+ unit buildings).
- This rent runs 42% of the median local income ($42k/yr) — at the standard rent-burdened threshold; future hikes will face affordability resistance.
Forward outlook
- Local home prices are declining (-3.0%/yr); year-one equity from $1k of loan paydown is wiped out by about $4k of value loss. Plan a longer hold.
- Fulton County population projected at +38% by 2050 — long-run rental-demand tailwind backs the buy-and-hold thesis.
Negotiation context
- It's been on market 37 days — a 3% lower offer ($141k) is reasonable based on typical stale-listing flexibility.
Questions for the listing agent
- It's been on market 37 days. Have you received any prior offers? Is the seller open to a 3% concession, seller financing, or rate buy-down credit?
- Is there a deadline driving the sale (1031 exchange, divorce, estate, relocation)? That informs how much negotiation room exists.
- What's the average days-on-market for RENTAL listings here right now (not sales)? A rising rental-DOM trend means longer vacancies and softer asking-rent achievability than the comps imply.
- What's the recent tenant-quality profile in this submarket — average credit score on applications, eviction rate, late-payment / NSF rate, and stable-employment percentage? A property-management company in the area should have these aggregated.
- How much new for-sale + rental construction is in the pipeline within 1–3 miles? Heavy new supply typically softens prices + rents 12–24 months out; constrained supply supports both.
Investment metrics
- 1% rule
- 1.03% ✓
- Cap rate
- 7.74%
- Cash-on-cash
- 5.18%
- DSCR
- 1.23
- GRM
- 8.1
CMA / ARV
No comps found within radius.
Projected returns pro-forma
-3.0% appreciation · 2.53% rent growth · sell at horizon
- IRR
- -8.8%
- Equity multiple
- 0.68×
- Total profit
- $-13,016
- Equity at exit
- $21,620
- IRR
- 0.1%
- Equity multiple
- 1.01×
- Total profit
- $274
- Equity at exit
- $12,537
Cash invested: $40,600 (down + closing). Projections, not guarantees.
Landlord ↔ Tenant lean methodology
- Overall (STATE)
- 90 Strongly Landlord-Friendly
- State Georgia
- 90 Strongly Landlord-Friendly · R+3
- County
- — inherits STATE
- City
- — inherits STATE
ZIP-level market 30314
- Home prices YoY
- -22.9%
- Rents YoY
- 2.5%
- Active inventory
- 293
- Price-to-rent
- 8.1×
Monthly cashflow live
- Estimated rent
- $1,490 high interval (Pro) →
- Mortgage (P&I)
- −$760
- Tax est. 1.5%
- −$181 /mo · $2,175/yr
- Insurance
- −$60
- HOA
- −$0
- Vacancy / Maint / Mgmt
- −$313
- Net cashflow
- $175
Break-even live
UW: 25.0% down · 7.5% · 30yr · 1.5% tax · 5.0% vac · 8.0% maint · 8.0% mgmt
Financing live
Cash to close
- Down payment
- $36,250
- Closing costs
- $4,350
- Reserves months
- —
- Total cash needed
- —
Loan-product check · same deal, 3 products live
Conventional
25% down · 7.5% · 30yr
- Down + closing
- —
- Monthly P&I
- —
- Monthly cashflow
- —
- DSCR
- —
- Eligible?
- —
Personal DTI + credit; lowest rate.
DSCR
20% down · 8.5% · 30yr
- Down + closing
- —
- Monthly P&I
- —
- Monthly cashflow
- —
- DSCR
- —
- Eligible?
- —
No personal income docs; deal must DSCR.
Hard money
10% down · 12.0% · 12mo
- Down + closing
- —
- Monthly P&I
- —
- Monthly cashflow
- —
- DSCR
- —
- Eligible?
- —
Short-term bridge; refi at stabilization.
Rent comps 40 comps
| Address | Beds | Baths | Sqft | Rent | $/sqft | DOM | Units | Dist |
|---|---|---|---|---|---|---|---|---|
| 870 Mayson Turner Rd NW #1442 Atlanta, GA | 2.0 | 2.0 | 1094 | $2,100 | $1.92 | 24d | 1 | 0.02mi |
| 60 Paschal Blvd NW Atlanta, GA | 1.0–3.0 | 1.0–2.5 | 945 | $1,163 | $1.23 | 24d | 25 | 0.14mi |
| 936 Mayson Turner Rd NW Atlanta, GA | 3.0 | 1.0–2.0 | 648 | $1,420 | $2.19 | 1d | 13 | 0.17mi |
| 961 Desoto St NW Atlanta, GA | 2.0 | 1.0 | 636 | $1,094 | $1.72 | 2d | 5 | 0.21mi |
| 18 Booker St NW Atlanta, GA | 1.0 | 1.0 | 560 | $2,000 | $3.57 | 24d | 1 | 0.21mi |
| 20 Griffin St NW Unit 1 Atlanta, GA | 2.0 | 1.0 | 800 | $1,250 | $1.56 | 24d | 1 | 0.28mi |
| 75 Griffin St NW Atlanta, GA | 2.0 | 1.0 | 1000 | $1,600 | $1.60 | 24d | 1 | 0.34mi |
| 101 Sunset Ave NW Atlanta, GA | 1.0 | 1.0 | 700 | $950 | $1.36 | 20d | 1 | 0.42mi |
| 891 Rock St NW Atlanta, GA | 2.0–3.0 | 2.0 | 1104 | $1,295 | $1.17 | 24d | 4 | 0.46mi |
| 139 Lawton St SW Atlanta, GA | 2.0 | 1.0 | 750 | $995 | $1.33 | 24d | 1 | 0.51mi |
| 147 Lawton St SW Atlanta, GA | 2.0 | 1.0 | 676 | $995 | $1.47 | 24d | 1 | 0.52mi |
| 669 Atlanta Student Movement Blvd Atlanta, GA | 2.0 | 1.0–2.0 | 803 | $2,252 | $2.80 | 24d | 12 | 0.59mi |
| 109 Vine St SW Unit A Atlanta, GA | 2.0 | 1.0 | 750 | $1,150 | $1.53 | 7d | 1 | 0.60mi |
| 109 Vine St SW Unit A Atlanta, GA | 2.0 | 1.0 | 600 | $1,250 | $2.08 | 21d | 1 | 0.60mi |
| 245 Stafford St NW Unit A Atlanta, GA | 2.0 | 1.0 | 784 | $1,300 | $1.66 | 24d | 1 | 0.60mi |
| 260 Elm St NW Unit 1 Atlanta, GA | 1.0 | 1.0 | 600 | $1,050 | $1.75 | 7d | 1 | 0.61mi |
| 5 Burbank Dr SW Unit B Atlanta, GA | 2.0 | 1.0 | 1000 | $1,300 | $1.30 | 16d | 1 | 0.66mi |
| 15 Burbank Dr SW Unit 3 Atlanta, GA | 2.0 | 1.0 | 900 | $1,350 | $1.50 | 10d | 1 | 0.67mi |
| 1097 Westview Dr SW Unit 10 Atlanta, GA | 2.0 | 1.0 | 750 | $1,095 | $1.46 | 24d | 1 | 0.70mi |
| 10 Rockmart Dr SW Atlanta, GA | 1.0 | 1.0 | 784 | $1,450 | $1.85 | 14d | 1 | 0.71mi |
| 10 Rockmart Dr NW Atlanta, GA | 1.0 | 1.0 | 784 | $1,450 | $1.85 | 14d | 1 | 0.71mi |
| 55 Maple St NW Atlanta, GA | 1.0–3.0 | 1.0–2.0 | 862 | $1,790 | $2.08 | 4d | 35 | 0.74mi |
| 1336 Sharon St NW Atlanta, GA | 2.0 | 1.0 | 800 | $1,450 | $1.81 | 24d | 1 | 0.82mi |
| 1201 Westview Dr SW Atlanta, GA | 3.0 | 2.0 | 1040 | $2,050 | $1.97 | 24d | 1 | 0.82mi |
| 1338 Sharon St NW Atlanta, GA | 2.0 | 1.0 | 800 | $1,600 | $2.00 | 19d | 1 | 0.82mi |
| 403 Elm St NW Atlanta, GA | 3.0 | 1.0 | 874 | $1,700 | $1.95 | 24d | 1 | 0.82mi |
| 600 Greensferry Ave SW Atlanta, GA | 1.0–3.0 | 1.0–2.0 | 949 | $1,262 | $1.33 | 7d | 16 | 0.86mi |
| 481 Griffin St NW Atlanta, GA | 2.0 | 2.0 | 1080 | $2,000 | $1.85 | 16d | 1 | 0.88mi |
| 170 Northside Dr SW Atlanta, GA | 1.0–2.0 | 1.0–2.0 | 955 | $1,866 | $1.95 | 1d | 11 | 0.88mi |
| 370 Northside Dr NW Atlanta, GA | 1.0–3.0 | 1.0–2.0 | 981 | $1,688 | $1.72 | 1d | 28 | 0.93mi |
| 15 Chappell Rd NW Unit A Atlanta, GA | 1.0 | 1.0 | 700 | $940 | $1.34 | 5d | 1 | 0.94mi |
| 23 Larkin Pl SW Atlanta, GA | 1.0–2.0 | 1.0–2.0 | 1011 | $2,129 | $2.10 | 1d | 14 | 0.95mi |
| 555 Paines Ave NW Atlanta, GA | 1.0 | 1.0 | 1000 | $1,150 | $1.15 | 7d | 1 | 0.97mi |
| 555 Paines Ave NW Unit 3 Atlanta, GA | 1.0 | 1.0 | 1000 | $1,400 | $1.40 | 24d | 1 | 0.97mi |
| 564 Joseph E Lowery Blvd NW Atlanta, GA | 2.0 | 1.0 | 980 | $1,100 | $1.12 | 24d | 1 | 0.98mi |
| 564 Joseph E. Lowery Blvd NW Unit 3 Atlanta, GA | 2.0 | 1.0 | 980 | $1,100 | $1.12 | 24d | 1 | 0.98mi |
| 238 Walker St SW Atlanta, GA | 1.0–2.0 | 1.0–2.5 | 1550 | $2,685 | $1.73 | 13d | 2 | 0.99mi |
| 210 Walker St SW #1 Atlanta, GA | 1.0 | 1.0 | 650 | $1,500 | $2.31 | 4d | 1 | 1.00mi |
| 1170 Greenwich St SW #3 Atlanta, GA | 2.0 | 1.0 | 900 | $1,250 | $1.39 | 18d | 1 | 1.01mi |
| 537 Sunset Ave NW Atlanta, GA | 2.0 | 1.0 | 775 | $1,750 | $2.26 | 24d | 1 | 1.01mi |
Listing history 15 events
-
2026-06-18days on market $145,000 Active 37 DOM
-
2026-06-17days on market $145,000 Active 36 DOM
-
2026-06-16days on market $145,000 Active 35 DOM
-
2026-06-15days on market $145,000 Active 34 DOM
-
2026-06-13days on market $145,000 Active 32 DOM
-
2026-06-13days on market $145,000 Active 31 DOM
-
2026-06-09days on market $145,000 Active 28 DOM
-
2026-06-08days on market $145,000 Active 27 DOM
-
2026-06-07days on market $145,000 Active 26 DOM
-
2026-06-04days on market $145,000 Active 23 DOM
-
2026-06-03days on market $145,000 Active 22 DOM
-
2026-06-02days on market $145,000 Active 21 DOM
-
2026-06-01days on market $145,000 Active 20 DOM
-
2026-05-31days on market $145,000 Active 19 DOM
-
2026-05-11$145,000 Active 582-char remark
ⓘ Source: listings_history table (triggers on properties + properties_extension) + one-shot
backfill from property_details.listing_events for pre-trigger history.
Nearby sold comps map
Loading sold comps map…
Walkable amenities ~0.75 mi
Loading nearby amenities…
Taxation est. · year 1
- Rental income
- $17,883
- − Mortgage interest
- −$8,122
- − Property taxes
- −$2,175
- − Insurance
- −$725
- − Repairs & maintenance
- −$1,431
- − Management
- −$1,431
- − Depreciation
- −$4,218
- Taxable loss
- −$219
- Est. tax savings @ 24.0%
- +$53
- After-tax cash flow
- $2,155/yr
For passive investors: Depreciation is non-cash, so a rental often shows a tax loss while cash-flowing — sheltering income. Rental losses are passive: they offset passive income freely, and up to $25,000/yr can offset ordinary (W-2) income if you actively participate and your MAGI is under $100k (phasing out to $0 by $150k); unused losses carry forward. On sale, claimed depreciation is recaptured at up to 25%, and gains may owe capital-gains tax (a 1031 exchange can defer both). Figures are a year-1 estimate at your 24.0% rate — not tax advice; consult a CPA.
Condition & rehab AI · 10 photos
This 2nd floor condo in the heart of Historic Westside Village is in good condition with granite countertops, hardwood floors, and stainless steel appliances. It offers a walk-in closet, garden tub, and separate shower. The gated community includes a gym, clubhouse, pool, and assigned covered parking. The home is conveniently located near MARTA, shopping, the Beltline, Mercedes Benz stadium, and downtown Atlanta.
Value-add opportunities
- Both Paint interior walls — Fresh paint enhances curb appeal and interior aesthetics
- Both Replace ceiling fans with energy-efficient models — Energy-efficient fans reduce energy costs and improve air circulation
- Both Install smart home devices — Smart home devices can increase home value and attract tech-savvy buyers/renters
Renovation cost estimate screening
Value-add ROI direction
- Both Paint interior walls — Fresh paint enhances curb appeal and interior aesthetics ↑
- Both Replace ceiling fans with energy-efficient models — Energy-efficient fans reduce energy costs and improve air circulation ↑
- Both Install smart home devices — Smart home devices can increase home value and attract tech-savvy buyers/renters ↑
ⓘ Cost ranges are severity-bucket heuristics (US national rule-of-thumb). Get contractor quotes + a written scope before underwriting a rehab budget.
Schools (NCES district)
- District
- Atlanta Public Schools
- NCES district ID
- 1300120
- Math proficiency
- 28% ▼ -6.00%
- Reading proficiency
- 35% ▼ -2.00%
- Median HH income
- $48,306
- Composite
- 27.27/100
- National rank
- #7006
- State rank
- #80 of 174 in GA
Livability — Atlanta
- Score
- 83/100
- State rank
- #6
- US rank
- #919
Category grades
Schools grade is shown separately in the Schools card above.
Census & demographics
- Census place
- Atlanta, GA
- County
- Fulton County · 1,094,430 people
- City population
- 629,525
- Metro
- Atlanta-Sandy Springs-Alpharetta, GA
- Population (ZIP)
- 23,333
- Household income
- $42,089
- Rent vs Own
- Severe rent burden
- 1293.0
Population outlook (Fulton County) Hauer SSP2
- Today (2025)
- 1,203,707 people
- By 2030
- 1,299,706 · +8.0%
- By 2040
- 1,488,256 · +23.6%
- By 2050
- 1,664,580 · +38.3%
- By 2075
- 2,036,072 · +69.2%
- By 2100
- 2,222,402 · +84.6%
Race, ethnicity, and origin ACS 2023
- Neighborhood character
- Predominantly Black (76%)
- Race & ethnicity
- Black 76% White 11% Hispanic / Latino 7% Asian 4% Two or more races 3%
- Hispanic origin (detail)
- Mexican 4% Dominican 1%
- Common ancestry
- Lithuanian 1%
- Foreign-born
- 6% · Canada, China, South Korea
- Languages at home
- 89% English-only · Spanish 5% Other Indo-European 1% Chinese 1%
Political lean MEDSL · Fulton
- 2024 margin
- Solid D (+44.9) · D 71.9% · R 27.0% · Other 1.1%
- 2008→2024 swing
- +9.8pp toward D · 2008: 35.0pp · 2024: 44.9pp
- All cycles
- 2024: D+44.9 2020: D+46.4 2016: D+42.1 2012: D+29.6 2008: D+35.0
Not yet ingested
- Civics
- —
Market trends
- HPI YoY
- ▼ -95.32%
- Current HPI
- 321.4626
- Rent YoY
- ▲ 2.53%
- Metro
- Atlanta-Sandy Springs-Alpharetta, GA
- State GDP YoY
- ▲ 2.66%
- F500 in state
- 28
Industry mix (Fortune 500 HQ in GA)
| Industry | F500 HQs | Revenue |
|---|---|---|
| Paper / Packaging | 2 | $29B |
|
||
| Retail | 1 | $160B |
|
||
| Transportation / Logistics | 1 | $91B |
|
||
| Airlines | 1 | $62B |
|
||
| Consumer Goods | 1 | $47B |
|
||
| Utilities | 1 | $25B |
|
||
Price history
1 event — show timeline
- 2026-05-11 Listed $145,000 Fizber.com
Cash-flow waterfall
monthlySold comps — $/sqft
last 12 mo · ≤1 miLoading sold comps…