 🏷️ Likely Rental
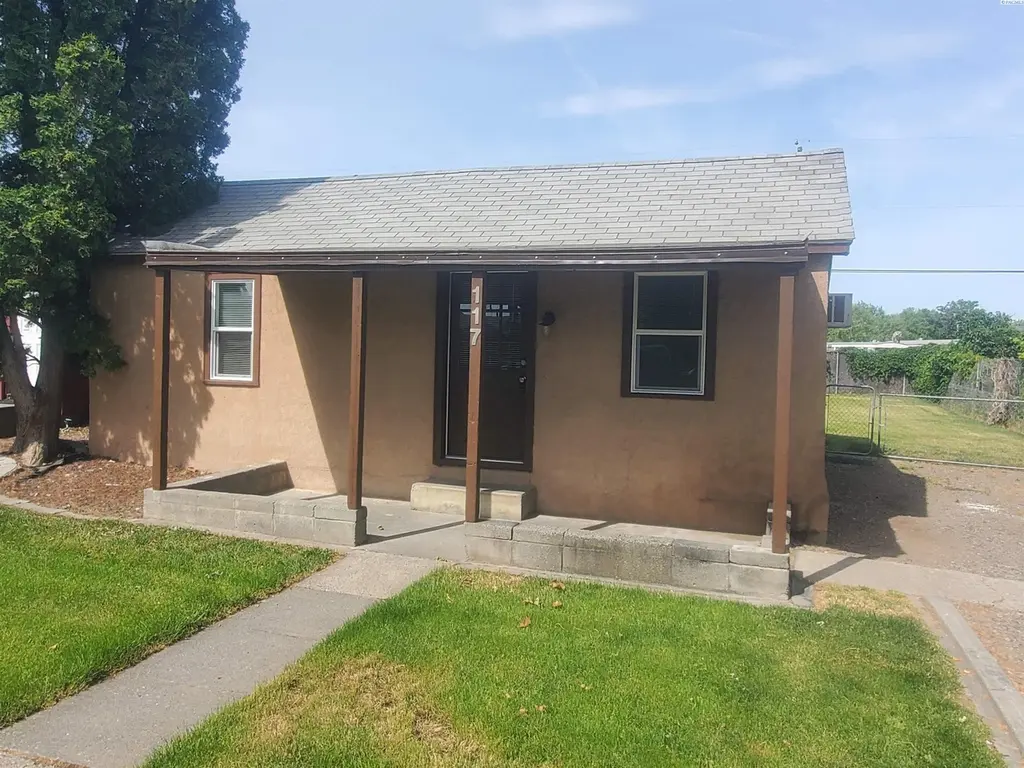
117 N Yost · Kennewick, WA
Flood risk 1/10 · Minimal
- FEMA flood zone
- X
- Chance of flooding over 30 yrs
- 0.0%
- Est. flood insurance / yr
- $507 – $1,088
Fire risk 1/10 · Minimal
- Est. fire insurance / yr
- $604 – $1,122
Heat risk 4/10 · Minor
- Hot days now (above 98°F)
- 6 days/yr
- Hot days in 30 yrs
- 13 days/yr
Wind risk 1/10 · Minimal
- Chance of severe wind over 30 yrs
- —
Air-quality risk 8/10 · Major
- Unhealthy air days now
- 14 days/yr
- Unhealthy air days in 30 yrs
- 15 days/yr
Risk factors via First Street. Map © Google.
Why this score? — see what drove the D grade
The composite is a weighted blend of 9 inputs, each scored 0–100. Each bar is that input's sub-score; the figure is the points it added to the 100-point composite (weight × sub-score).
- Cash flow +15.0/30.0
- 1% rule +5.0/10.0
- DSCR +5.0/10.0
- Schools +4.6/10.0
- Livability +3.9/5.0
- Rent growth +3.3/5.0
- ARV discount +3.2/15.0
- Condition / age +2.5/5.0
- Appreciation +0.0/10.0
$1,350
🖨 Deal sheet (PDF) 📄 Offer letter ✓ Due diligence
Listing remarks
FOR RENT: MLS#293261 Newly updated interior, 2 bed, 1 bath, central Kennewick near shopping, convenient location. Baseboard heat and wall air conditioning. No pets, No smoking please. Move in fees may include, but may not be limited to first month's rent, security dep same as rent. Tenants 18 and over shall apply through SVN's 3rd party screening company AcraNet. Landlord will not accept comprehensive reusable tenant screening report from another company. 12 mo lease. Tenant pays all utilities, home is on a septic system. Lot size includes disclosed includes neighboring units on the same parcel, but are excluded from this listing.
Key facts
- Updated interior
- Convenient location
- Baseboard heat
Tags
Property features AI
Finance
- Other: Information not provided
- Financial info: Information not provided
- HOA & community: Information not provided
Exterior
- Parking: No garage
- Security: Information not provided
- Utilities: Information not provided
- Home design: Single-family residence; Site-built on an owned lot; Single-story (one level); New construction
- Construction: Information not provided
- Exterior features: Lot approximately 0.4 acres (about 17,424 sq ft); Zoned for single-family residential
Interior
- Kitchen: Information not provided
- Bedrooms: Information not provided
- Flooring: Information not provided
- Bathrooms: One full bathroom
- Heating & cooling: Information not provided
- Interior features: No basement
- Laundry & utility: Information not provided
Neighborhood map
What this means for you Summary
Snapshot
- This is a 2-bed/1.0-bath single-family listed at $1k.
Deal economics
- At list price, monthly cash flow is $1k ($13k/yr) — positive.
- The deal already cash-flows at list — no discount required.
- Meets the 1% rule at list price ($1k rent vs $1k).
- Recommended offer: $1k (1.6% below list) — sets the bar for market timing.
- Cap rate 994.5% vs local median 3.3% in Kennewick — top-decile yield for the area; either an underpriced asset or a hidden risk that comps aren't pricing in. Stress-test before assuming the spread holds.
Location & tenants
- Location reads 78/100 on livability (#131 in WA, #2,599 nationally) — a middle-class / working-renter tenant base. Strengths: commute A+, housing A+, health & safety A; Watch: amenities D+, crime F.
- Kennewick School District (urban): math 43% / reading 58% proficiency, ranked #141 of 291 in WA (top 48%) — acceptable for families but not a draw, mixed tenant base, ~2y average lease.
- Zoned schools: Edison Elementary School (325 students, 81% FRL); Highlands Middle School (750 students, 84% FRL); Kamiakin High School (1,884 students, 43% FRL) — zoned schools average 69% FRL vs 48% district-wide (21 pts higher); higher-poverty schools than district average — tighter screening recommended.
- Market conditions: Rents rising (+3.4%/yr); 292 active listings in the ZIP; 13 comparable units currently listed for rent nearby; rentals at typical pace (median 24d on market — plan ~3-4 weeks tenant-placement turnaround); 1,532 units permitted in Benton County in 2024 (389 in 5+ unit buildings).
Forward outlook
- Local home prices are declining (-3.0%/yr); year-one equity from $10 of loan paydown is wiped out by about $40 of value loss. Plan a longer hold.
- Benton County population projected at +32% by 2050 — long-run rental-demand tailwind backs the buy-and-hold thesis.
- At projected returns (-3.0% appreciation + 3.4% rent growth), your $378 cash investment doubles in ~1 year — after that, you're playing with house money.
Negotiation context
- It's been on market 25 days — a 2% lower offer ($1k) is reasonable based on typical stale-listing flexibility.
Risks & watch-outs
- Watch-outs: built in 1948 — expect roof / HVAC / electrical / plumbing capex.
Questions for the listing agent
- Built in 1948 — when were the roof, HVAC, electrical panel, plumbing, and water heater last replaced?
- Is there a deadline driving the sale (1031 exchange, divorce, estate, relocation)? That informs how much negotiation room exists.
- Schools are D-rated, which usually means shorter tenancies and higher turnover. Who's the typical renter profile here, and what's been the actual vacancy rate?
- Crime grade is F in this area — have there been break-ins, vandalism, or insurance claims at this property in the last 3 years? What carrier currently insures it and at what premium?
- The area grade is low — what's the realistic commute time and amenity access for the typical tenant pool here? Any planned neighborhood developments (good or bad) we should know about?
- What's the average days-on-market for RENTAL listings here right now (not sales)? A rising rental-DOM trend means longer vacancies and softer asking-rent achievability than the comps imply.
- What's the recent tenant-quality profile in this submarket — average credit score on applications, eviction rate, late-payment / NSF rate, and stable-employment percentage? A property-management company in the area should have these aggregated.
- How much new for-sale + rental construction is in the pipeline within 1–3 miles? Heavy new supply typically softens prices + rents 12–24 months out; constrained supply supports both.
Investment metrics
- 1% rule
- 105.11% ✓
- Cap rate
- 994.47%
- Cash-on-cash
- 3529.19%
- DSCR
- 158.03
- GRM
- 0.1
CMA / ARV
- ARV (on-the-fly)
- $1,232
- Comps found
- 1
Show comp detail 1 sale within ~0.75 mi
| Address | Dist | Beds/Ba | Sqft | Sold | Price | $/sf | Match |
|---|---|---|---|---|---|---|---|
| 109 Yost | 0.01mi | 2/1.0 | 700 (+14%) | 21mo | $1,150 | $2 | 60 |
Match score weights: distance 35% · size 25% · config 20% · recency 20%. Top-matched comps best support the ARV.
Projected returns pro-forma
-3.0% appreciation · 3.39% rent growth · sell at horizon
- IRR
- —
- Equity multiple
- 189.27×
- Total profit
- $71,166
- Equity at exit
- $201
- IRR
- —
- Equity multiple
- 412.49×
- Total profit
- $155,541
- Equity at exit
- $117
Cash invested: $378 (down + closing). Projections, not guarantees.
Landlord ↔ Tenant lean methodology
- Overall (STATE)
- 28 Tenant-Leaning
- State Washington
- 28 Tenant-Leaning · D+8
- County
- — inherits STATE
- City
- — inherits STATE
ZIP-level market 99336
- Rents YoY
- 3.4%
- Active inventory
- 292
- Price-to-rent
- 0.1×
Monthly cashflow live
- Estimated rent
- $1,419 high interval (Pro) →
- Mortgage (P&I)
- −$7
- Tax est. 1.5%
- −$2 /mo · $20/yr
- Insurance
- −$1
- HOA
- −$0
- Lot rent
- −$0
- Vacancy / Maint / Mgmt
- −$298
- Net cashflow
- $1,112
Break-even live
Sensitivity live
| Price | -10% $1,113 | -5% $1,112 | +0% $1,112 | +5% $1,111 | +10% $1,111 |
|---|---|---|---|---|---|
| Rent | -10% $1,000 | -5% $1,056 | +0% $1,112 | +5% $1,168 | +10% $1,224 |
| Rate | -1.0pp $1,112 | -0.5pp $1,112 | base $1,112 | +0.5pp $1,111 | +1.0pp $1,111 |
UW: 25.0% down · 7.5% · 30yr · 1.5% tax · 5.0% vac · 8.0% maint · 8.0% mgmt
Financing live
Cash to close
- Down payment
- $338
- Closing costs
- $40
- Reserves months
- —
- Total cash needed
- —
Loan-product check · same deal, 3 products live
Conventional
25% down · 7.5% · 30yr
- Down + closing
- —
- Monthly P&I
- —
- Monthly cashflow
- —
- DSCR
- —
- Eligible?
- —
Personal DTI + credit; lowest rate.
DSCR
20% down · 8.5% · 30yr
- Down + closing
- —
- Monthly P&I
- —
- Monthly cashflow
- —
- DSCR
- —
- Eligible?
- —
No personal income docs; deal must DSCR.
Hard money
10% down · 12.0% · 12mo
- Down + closing
- —
- Monthly P&I
- —
- Monthly cashflow
- —
- DSCR
- —
- Eligible?
- —
Short-term bridge; refi at stabilization.
Rent comps 13 comps
| Address | Beds | Baths | Sqft | Rent | $/sqft | DOM | Units | Dist |
|---|---|---|---|---|---|---|---|---|
| 460 N Arthur St Kennewick, WA | 2.0 | 1.0–2.0 | 749 | $1,700 | $2.27 | 16d | 7 | 0.26mi |
| 445 N Volland St Kennewick, WA | 1.0–2.0 | 1.0 | 735 | $1,294 | $1.76 | 16d | 7 | 0.27mi |
| 465 N Arthur St Kennewick, WA | 2.0 | 1.0 | 717 | $1,550 | $2.16 | 46d | 1 | 0.35mi |
| 465 N Arthur St Kennewick, WA | 1.0 | 1.0 | 675 | $1,350 | $2.00 | 23d | 3 | 0.35mi |
| 530 N Edison St Kennewick, WA | 1.0–2.0 | 1.0 | 700 | $1,657 | $2.37 | 16d | 11 | 0.43mi |
| 632 N Arthur St Kennewick, WA | 1.0 | 1.0 | 575 | $1,036 | $1.80 | 16d | 1 | 0.44mi |
| 4711 W Metaline Ave Kennewick, WA | 1.0–2.0 | 1.0 | 777 | $1,525 | $1.96 | 23d | 7 | 0.56mi |
| 801 N Tweedt St Kennewick, WA | 1.0–2.0 | 1.0 | 779 | $1,350 | $1.73 | 23d | 3 | 0.59mi |
| 3703 W Kennewick Ave Kennewick, WA | 1.0–2.0 | 1.0 | 782 | $1,594 | $2.04 | 16d | 8 | 0.61mi |
| 12 S Morain St Kennewick, WA | 1.0–3.0 | 1.0 | 604 | $1,249 | $2.07 | 16d | 3 | 0.69mi |
| 337 S Johnson St Unit A Kennewick, WA | 1.0 | 1.0 | 550 | $975 | $1.77 | 46d | 1 | 0.94mi |
| 337 S Johnson St Unit F Kennewick, WA | 1.0 | 1.0 | 550 | $875 | $1.59 | 23d | 1 | 0.94mi |
| 119 S Conway Pl Kennewick, WA | 2.0 | 1.0 | 711 | $1,200 | $1.69 | 23d | 1 | 1.35mi |
Listing history 19 events
-
2026-06-21days on market $1,350 Active 25 DOM
-
2026-06-18days on market $1,350 Active 22 DOM
-
2026-06-17days on market $1,350 Active 21 DOM
-
2026-06-16days on market $1,350 Active 20 DOM
-
2026-06-15days on market $1,350 Active 19 DOM
-
2026-06-14days on market $1,350 Active 17 DOM
-
2026-06-13days on market $1,350 Active 16 DOM
-
2026-06-10days on market $1,350 Active 14 DOM
-
2026-06-09days on market $1,350 Active 13 DOM
-
2026-06-09price $1,350 Active 12 DOM
-
2026-06-08days on market $1,395 Active 12 DOM
-
2026-06-07days on market $1,395 Active 11 DOM
-
2026-06-05days on market $1,395 Active 8 DOM
-
2026-06-03days on market $1,395 Active 7 DOM
-
2026-06-02days on market $1,395 Active 6 DOM
-
2026-06-01days on market $1,395 Active 5 DOM
-
2026-05-31days on market $1,395 Active 4 DOM
-
2026-05-30days on market $1,395 Active 3 DOM
-
2026-05-27$1,395 Active
ⓘ Source: listings_history table (triggers on properties + properties_extension) + one-shot
backfill from property_details.listing_events for pre-trigger history.
Climate risk First Street
- Flood 1/10 Low FEMA zone X · 0% chance over 30 yrs
- Wildfire 1/10 Low
- Heat 4/10 Moderate 6 d/yr ≥98°F today · 13 d/yr by 30 yrs out
- Wind 1/10 Low
- Air quality 8/10 Severe 14 unhealthy d/yr today · 15 by 30 yrs out
Nearby sold comps map
Loading sold comps map…
Walkable amenities ~0.75 mi
Loading nearby amenities…
Taxation est. · year 1
- Rental income
- $17,028
- − Mortgage interest
- −$76
- − Property taxes
- −$20
- − Insurance
- −$7
- − Repairs & maintenance
- −$1,362
- − Management
- −$1,362
- − Depreciation
- −$39
- Taxable income
- $14,162
- Est. tax owed @ 24.0%
- −$3,399
- After-tax cash flow
- $9,942/yr
For passive investors: Depreciation is non-cash, so a rental often shows a tax loss while cash-flowing — sheltering income. Rental losses are passive: they offset passive income freely, and up to $25,000/yr can offset ordinary (W-2) income if you actively participate and your MAGI is under $100k (phasing out to $0 by $150k); unused losses carry forward. On sale, claimed depreciation is recaptured at up to 25%, and gains may owe capital-gains tax (a 1031 exchange can defer both). Figures are a year-1 estimate at your 24.0% rate — not tax advice; consult a CPA.
Schools (NCES district)
- District
- Kennewick School District
- NCES district ID
- 5303930
- Math proficiency
- 43% ▼ -1.00%
- Reading proficiency
- 58% ▬ 0.00%
- Median HH income
- $54,191
- Composite
- 45.56/100
- National rank
- #5667
- State rank
- #141 of 291 in WA
Livability — Kennewick
- Score
- 78/100
- State rank
- #131
- US rank
- #2599
Category grades
Schools grade is shown separately in the Schools card above.
Census & demographics
- Census place
- Kennewick, WA
- County
- Benton County · 186,895 people
- City population
- 104,655
- Metro
- Kennewick-Richland, WA
- Population (ZIP)
- 50,735
- Household income
- $62,527
- Rent vs Own
- Severe rent burden
- 2605.0
Population outlook (Benton County) Hauer SSP2
- Today (2025)
- 219,421 people
- By 2030
- 233,813 · +6.6%
- By 2040
- 262,134 · +19.5%
- By 2050
- 290,100 · +32.2%
- By 2075
- 363,525 · +65.7%
- By 2100
- 418,667 · +90.8%
Race, ethnicity, and origin ACS 2023
- Neighborhood character
- Diverse neighborhood (Simpson 0.56)
- Race & ethnicity
- White 55% Hispanic / Latino 37% Two or more races 15% Black 3% Asian 2% Native American 1%
- Hispanic origin (detail)
- Mexican 31% Cuban 2%
- Common ancestry
- Portuguese 4% Slovak 3% Romanian 1%
- Foreign-born
- 16% · Canada, Jamaica
- Languages at home
- 68% English-only · Spanish 29% Arabic 1%
Political lean MEDSL · Benton
- 2024 margin
- Strong R (+21.9) · D 37.7% · R 59.6% · Other 2.7%
- 2008→2024 swing
- +4.2pp toward D · 2008: -26.1pp · 2024: -21.9pp
- All cycles
- 2024: R+21.9 2020: R+21.0 2016: R+26.6 2012: R+27.0 2008: R+26.1
Not yet ingested
- Civics
- —
Market trends
- HPI YoY
- ▼ -408.26%
- Current HPI
- 256.1143
- Rent YoY
- ▲ 3.39%
- Metro
- Kennewick-Richland, WA
- State GDP YoY
- ▲ 4.65%
- F500 in state
- 22
Industry mix (Fortune 500 HQ in WA)
| Industry | F500 HQs | Revenue |
|---|---|---|
| Retail | 2 | $269B |
|
||
| Technology / Retail | 1 | $638B |
|
||
| Technology | 1 | $245B |
|
||
| Telecommunications | 1 | $38B |
|
||
| Food / Beverage | 1 | $36B |
|
||
| Automotive / Trucks | 1 | $34B |
|
||
Price history
1 event — show timeline
- 2026-05-27 Listed $1,395 PACMLS
Cash-flow waterfall
monthlySold comps — $/sqft
last 12 mo · ≤1 miLoading sold comps…