224 County Road 3525 · Hawkins, TX
Flood risk 1/10 · Minimal
- FEMA flood zone
- X (unshaded)
- Chance of flooding over 30 yrs
- 0.0%
- Est. flood insurance / yr
- $507 – $1,088
Fire risk 5/10 · Moderate
- Est. fire insurance / yr
- $1,222 – $2,270
Heat risk 7/10 · Major
- Hot days now (above 110°F)
- 7 days/yr
- Hot days in 30 yrs
- 25 days/yr
Wind risk 6/10 · Moderate
- Chance of severe wind over 30 yrs
- 50.0%
Air-quality risk 2/10 · Minimal
- Unhealthy air days now
- 1 days/yr
- Unhealthy air days in 30 yrs
- 1 days/yr
Risk factors via First Street. Map © Google.
Why this score? — see what drove the B grade
The composite is a weighted blend of 9 inputs, each scored 0–100. Each bar is that input's sub-score; the figure is the points it added to the 100-point composite (weight × sub-score).
- Cash flow +30.0/30.0
- 1% rule +10.0/10.0
- DSCR +10.0/10.0
- ARV discount +7.5/15.0
- Appreciation +6.5/10.0
- Livability +3.7/5.0
- Schools +3.6/10.0
- Rent growth +2.5/5.0
- Condition / age +1.0/5.0
$120,000
🖨 Deal sheet 📄 Offer letter ✓ Due diligence
Listing remarks
Home is sitting on property owned by seller, which is secluded and very private. Property is included with the sale of home or home can be moved if desired.
Key facts
- Built 2022
- Listed 18 days
Neighborhood map
What this means for you Summary
Snapshot
- This is a 3-bed/2.0-bath single-family listed at $120k. Condition is rated poor.
Deal economics
- At list price, monthly cash flow is $811 ($10k/yr) — positive.
- The deal already cash-flows at list — no discount required.
- Meets the 1% rule at list price ($2k rent vs $120k).
- Recommended offer: $118k (1.5% below list) — sets the bar for market timing.
Location & tenants
- Location reads 73/100 on livability (#196 in TX, #4,982 nationally) — a middle-class / working-renter tenant base. Strengths: cost of living A+, health & safety A+, crime A-; Watch: schools D+, amenities F, commute F.
- Hawkins ISD (rural): math 42% / reading 43% proficiency, ranked #339 of 826 in TX (top 41%) — families likely to look elsewhere, expect single-tenant / working-renter base with shorter leases.
- Market conditions: 216 active listings in the ZIP; 1 comparable units currently listed for rent nearby; 72 units permitted in Wood County in 2024 (29 in 5+ unit buildings).
Forward outlook
- In year one you build about $5k of equity ($830 loan paydown + $4k appreciation (3.1% local appreciation)).
- Wood County population projected at +12% by 2050 — modest demand growth; plan on rents tracking national, not racing it.
- At projected returns (3.1% appreciation + 3.0% rent growth), your $34k cash investment doubles in ~3 years — after that, you're playing with house money.
- By year 8, paydown + projected appreciation supports a ~$34k cash-out refi (75% LTV) — recoverable capital for the next deal without selling this one.
Negotiation context
- It's been on market 19 days — a 2% lower offer ($118k) is reasonable based on typical stale-listing flexibility.
Risks & watch-outs
- Climate carrying-cost: major wind risk, 50% chance of damaging wind over 30y; moderate wildfire risk; extreme-heat days projected 7→25/yr by 2055 (HVAC capex compounding) — expect insurance premiums to compound above CPI over the hold.
Questions for the listing agent
- Have any recent inspections been done? Can we get a copy of the seller's disclosures and any deferred-maintenance estimates?
- Is there a deadline driving the sale (1031 exchange, divorce, estate, relocation)? That informs how much negotiation room exists.
- Schools are D-rated, which usually means shorter tenancies and higher turnover. Who's the typical renter profile here, and what's been the actual vacancy rate?
- What's the average days-on-market for RENTAL listings here right now (not sales)? A rising rental-DOM trend means longer vacancies and softer asking-rent achievability than the comps imply.
- What's the recent tenant-quality profile in this submarket — average credit score on applications, eviction rate, late-payment / NSF rate, and stable-employment percentage? A property-management company in the area should have these aggregated.
- How much new for-sale + rental construction is in the pipeline within 1–3 miles? Heavy new supply typically softens prices + rents 12–24 months out; constrained supply supports both.
Investment metrics
- 1% rule
- 1.67% ✓
- Cap rate
- 14.40%
- Cash-on-cash
- 28.97%
- DSCR
- 2.29
- GRM
- 5.0
CMA / ARV
No comps found within radius.
Projected returns pro-forma
3.1% appreciation · 3.0% rent growth · sell at horizon
- IRR
- 35.0%
- Equity multiple
- 2.99×
- Total profit
- $66,720
- Equity at exit
- $54,610
- IRR
- 35.1%
- Equity multiple
- 5.89×
- Total profit
- $164,372
- Equity at exit
- $84,672
Cash invested: $33,600 (down + closing). Projections, not guarantees.
Landlord ↔ Tenant lean methodology
- Overall (STATE)
- 87 Strongly Landlord-Friendly
- State Texas
- 87 Strongly Landlord-Friendly · R+5
- County
- — inherits STATE
- City
- — inherits STATE
ZIP-level market 75765
- Home prices YoY
- 1.3%
- Active inventory
- 216
- Price-to-rent
- 5.0×
Monthly cashflow live
- Estimated rent
- $2,000 medium interval (Pro) →
- Mortgage (P&I)
- −$629
- Tax from tax record
- −$90 /mo · $1,076/yr
- Insurance
- −$50
- HOA
- −$0
- Vacancy / Maint / Mgmt
- −$420
- Net cashflow
- $811
Break-even live
UW: 25.0% down · 7.5% · 30yr · 1.5% tax · 5.0% vac · 8.0% maint · 8.0% mgmt
Financing live
Cash to close
- Down payment
- $30,000
- Closing costs
- $3,600
- Reserves months
- —
- Total cash needed
- —
Loan-product check · same deal, 3 products live
Conventional
25% down · 7.5% · 30yr
- Down + closing
- —
- Monthly P&I
- —
- Monthly cashflow
- —
- DSCR
- —
- Eligible?
- —
Personal DTI + credit; lowest rate.
DSCR
20% down · 8.5% · 30yr
- Down + closing
- —
- Monthly P&I
- —
- Monthly cashflow
- —
- DSCR
- —
- Eligible?
- —
No personal income docs; deal must DSCR.
Hard money
10% down · 12.0% · 12mo
- Down + closing
- —
- Monthly P&I
- —
- Monthly cashflow
- —
- DSCR
- —
- Eligible?
- —
Short-term bridge; refi at stabilization.
Rent comps 1 comps
| Address | Beds | Baths | Sqft | Rent | $/sqft | DOM | Units | Dist |
|---|---|---|---|---|---|---|---|---|
| 230 Private Road 7422 Unit 7422 Hawkins, TX | 3.0 | 2.0 | 1200 | $2,000 | $1.67 | 43d | 1 | 1.25mi |
Listing history 14 events
-
2026-06-15days on market $120,000 Active 19 DOM
-
2026-06-14days on market $120,000 Active 17 DOM
-
2026-06-13days on market $120,000 Active 16 DOM
-
2026-06-10days on market $120,000 Active 14 DOM
-
2026-06-09days on market $120,000 Active 13 DOM
-
2026-06-08days on market $120,000 Active 12 DOM
-
2026-06-07days on market $120,000 Active 11 DOM
-
2026-06-05days on market $120,000 Active 8 DOM
-
2026-06-03days on market $120,000 Active 7 DOM
-
2026-06-02days on market $120,000 Active 6 DOM
-
2026-06-01days on market $120,000 Active 5 DOM
-
2026-05-31days on market $120,000 Active 4 DOM
-
2026-05-30days on market $120,000 Active 3 DOM
-
2026-05-28$120,000 Active
ⓘ Source: listings_history table (triggers on properties + properties_extension) + one-shot
backfill from property_details.listing_events for pre-trigger history.
Tax reassessment forecast TX · Resets to sale price
- Current annual tax
- $1,076 · $90/mo
- Projected year-2 tax
- $2,196 · $183/mo
- Expected delta
- +$1,120/yr (+$93/mo · 104.2%)
ⓘ Screening estimate from a state-policy table — verify with the county assessor before closing.
Climate risk First Street
- Flood 1/10 Low FEMA zone X (unshaded) · 0% chance over 30 yrs
- Wildfire 5/10 Major
- Heat 7/10 Severe 7 d/yr ≥110°F today · 25 d/yr by 30 yrs out
- Wind 6/10 Major 50% chance of damaging wind over 30 yrs
- Air quality 2/10 Low 1 unhealthy d/yr today · 1 by 30 yrs out
Nearby sold comps map
Loading sold comps map…
Walkable amenities ~0.75 mi
Loading nearby amenities…
Taxation est. · year 1
- Rental income
- $24,000
- − Mortgage interest
- −$6,722
- − Property taxes
- −$1,076
- − Insurance
- −$600
- − Repairs & maintenance
- −$1,920
- − Management
- −$1,920
- − Depreciation
- −$3,491
- Taxable income
- $8,272
- Est. tax owed @ 24.0%
- −$1,985
- After-tax cash flow
- $7,748/yr
For passive investors: Depreciation is non-cash, so a rental often shows a tax loss while cash-flowing — sheltering income. Rental losses are passive: they offset passive income freely, and up to $25,000/yr can offset ordinary (W-2) income if you actively participate and your MAGI is under $100k (phasing out to $0 by $150k); unused losses carry forward. On sale, claimed depreciation is recaptured at up to 25%, and gains may owe capital-gains tax (a 1031 exchange can defer both). Figures are a year-1 estimate at your 24.0% rate — not tax advice; consult a CPA.
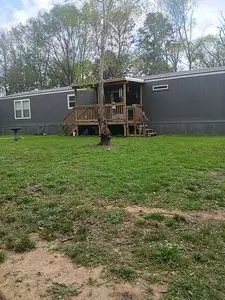
Condition & rehab AI · 1 photo
This property requires extensive repairs and maintenance, including trimming the overgrown grass, painting the exterior, and improving the landscaping. These improvements will significantly enhance the property's curb appeal and value.
Repairs flagged
- Major Grass trimming — The grass is overgrown and uneven, indicating a major need for trimming.
- Major Roof inspection — The roof appears aged and may need inspection for potential damage.
- Major Exterior painting — The exterior suggests a lack of maintenance, indicating a need for painting.
- Major Landscaping — The overgrown grass and lack of landscaping indicate a need for landscaping improvements.
- Major Foundation inspection — The foundation is not visible, but the exterior suggests a need for inspection for potential issues.
- Major HVAC inspection and maintenance — The HVAC is not visible, but the exterior suggests a need for inspection and maintenance for potential issues.
- Major Interior painting — The interior is not visible, but the exterior suggests a need for painting for potential issues.
- Major Window cleaning — The windows are not visible, but the exterior suggests a need for cleaning for potential issues.
Value-add opportunities
- Both Grass trimming — Improving the curb appeal and making the property more presentable for potential buyers or renters.
- Both Exterior painting — Refreshing the exterior to make the property more attractive and potentially increase its value.
- Both Landscaping — Creating a well-maintained yard can significantly improve the property's curb appeal and value.
- Both HVAC inspection and maintenance — Ensuring the HVAC system is in good working condition can improve the comfort of the property and its value.
- Both Interior painting — Refreshing the interior can make the property more attractive and potentially increase its value.
- Both Window cleaning — Cleaning the windows can improve the property's curb appeal and make it more attractive to potential buyers or renters.
Renovation cost estimate screening
| Repair item | Severity | Est. cost |
|---|---|---|
| Grass trimming · The grass is overgrown and uneven, indicating a major need for trimming. | Major | $15,000–50,000 |
| Roof inspection · The roof appears aged and may need inspection for potential damage. | Major | $15,000–50,000 |
| Exterior painting · The exterior suggests a lack of maintenance, indicating a need for painting. | Major | $15,000–50,000 |
| Landscaping · The overgrown grass and lack of landscaping indicate a need for landscaping improvements. | Major | $15,000–50,000 |
| Foundation inspection · The foundation is not visible, but the exterior suggests a need for inspection for potential issues. | Major | $15,000–50,000 |
| HVAC inspection and maintenance · The HVAC is not visible, but the exterior suggests a need for inspection and maintenance for potential issues. | Major | $15,000–50,000 |
| Interior painting · The interior is not visible, but the exterior suggests a need for painting for potential issues. | Major | $15,000–50,000 |
| Window cleaning · The windows are not visible, but the exterior suggests a need for cleaning for potential issues. | Major | $15,000–50,000 |
| Total estimated repair cost · 8 items | $120,000–400,000 |
Value-add ROI direction
- Both Grass trimming — Improving the curb appeal and making the property more presentable for potential buyers or renters. ↑
- Both Exterior painting — Refreshing the exterior to make the property more attractive and potentially increase its value. ↑
- Both Landscaping — Creating a well-maintained yard can significantly improve the property's curb appeal and value. ↑
- Both HVAC inspection and maintenance — Ensuring the HVAC system is in good working condition can improve the comfort of the property and its value. ↑
- Both Interior painting — Refreshing the interior can make the property more attractive and potentially increase its value. ↑
- Both Window cleaning — Cleaning the windows can improve the property's curb appeal and make it more attractive to potential buyers or renters. ↑
ⓘ Cost ranges are severity-bucket heuristics (US national rule-of-thumb). Get contractor quotes + a written scope before underwriting a rehab budget.
Schools (NCES district)
- District
- Hawkins ISD
- NCES district ID
- 4822770
- Math proficiency
- 42% ▼ -12.00%
- Reading proficiency
- 43% ▼ -6.00%
- Median HH income
- $43,119
- Composite
- 35.91/100
- National rank
- #4809
- State rank
- #339 of 826 in TX
Livability — Hawkins
- Score
- 73/100
- State rank
- #196
- US rank
- #4982
Category grades
Schools grade is shown separately in the Schools card above.
Census & demographics
- Population (ZIP)
- 8,195
Population outlook (Wood County) Hauer SSP2
- Today (2025)
- 46,480 people
- By 2030
- 47,796 · +2.8%
- By 2040
- 50,142 · +7.9%
- By 2050
- 52,122 · +12.1%
- By 2075
- 57,033 · +22.7%
- By 2100
- 56,418 · +21.4%
Race, ethnicity, and origin ACS 2023
- Neighborhood character
- Predominantly White (79%)
- Race & ethnicity
- White 79% Black 12% Hispanic / Latino 6% Two or more races 5%
- Hispanic origin (detail)
- Mexican 5%
- Common ancestry
- Lithuanian 2% Slovak 2% Serbian 1%
- Foreign-born
- 1% · Canada
- Languages at home
- 95% English-only · Spanish 4%
Political lean MEDSL · Wood
- 2024 margin
- Solid R (+69.7) · D 14.8% · R 84.6%
- 2008→2024 swing
- -15.5pp toward R · 2008: -54.2pp · 2024: -69.7pp
- All cycles
- 2024: R+69.7 2020: R+68.2 2016: R+70.0 2012: R+64.2 2008: R+54.2
Not yet ingested
- Civics
- —
Market trends
- HPI YoY
- ▲ 3.10%
- Current HPI
- 236.7688
- Rent YoY
- —
- Metro
- —
- State GDP YoY
- ▲ 3.95%
- F500 in state
- 110
Industry mix (Fortune 500 HQ in TX)
| Industry | F500 HQs | Revenue |
|---|---|---|
| Energy | 16 | $1,198B |
|
||
| Technology | 5 | $198B |
|
||
| Engineering / Construction | 4 | $72B |
|
||
| Energy Services | 3 | $60B |
|
||
| Utilities | 3 | $41B |
|
||
| Healthcare | 2 | $330B |
|
||
Price history
1 event — show timeline
- 2026-05-28 Listed $120,000 FSBO.com
Cash-flow waterfall
monthlySold comps — $/sqft
last 12 mo · ≤1 miLoading sold comps…