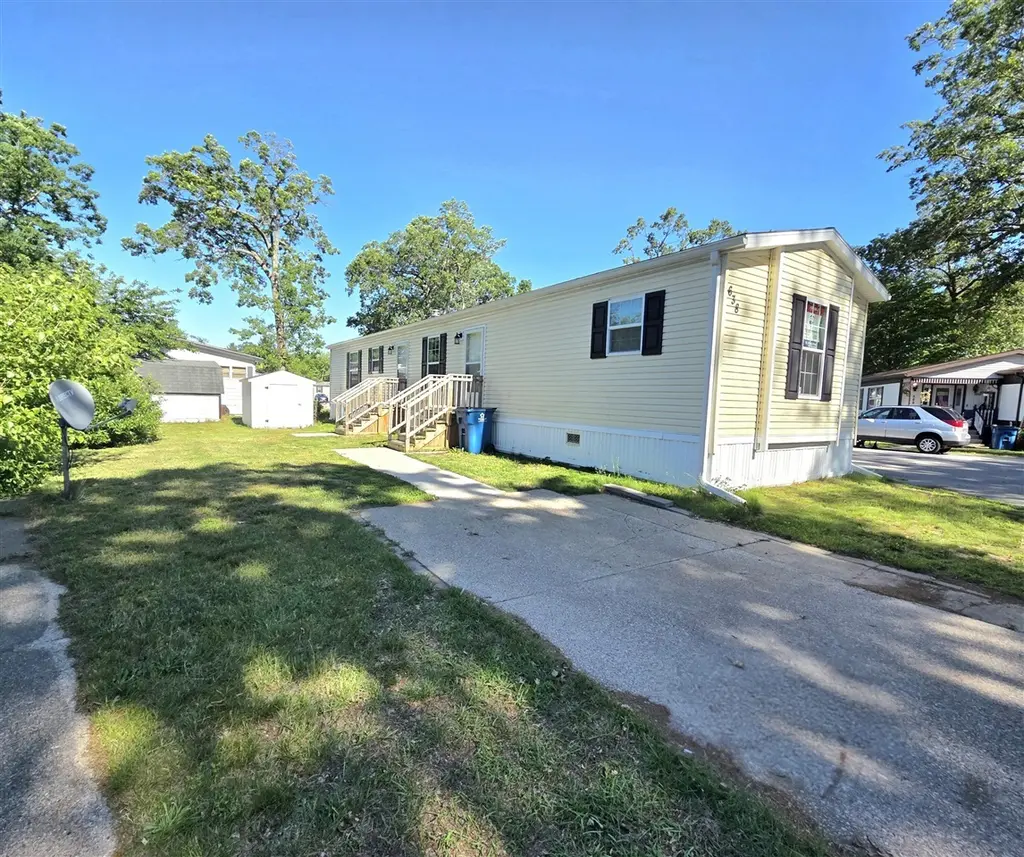
638 Courtland Ln · Wolf Lake, MI
Flood risk No data
- FEMA flood zone
- —
- Chance of flooding over 30 yrs
- —
- Est. flood insurance / yr
- —
Fire risk No data
- Est. fire insurance / yr
- —
Heat risk No data
- Hot days now (above threshold)
- —
- Hot days in 30 yrs
- —
Wind risk No data
- Chance of severe wind over 30 yrs
- —
Air-quality risk No data
- Unhealthy air days now
- —
- Unhealthy air days in 30 yrs
- —
Risk factors via First Street. Map © Google.
Why this score? — see what drove the B grade
The composite is a weighted blend of 9 inputs, each scored 0–100. Each bar is that input's sub-score; the figure is the points it added to the 100-point composite (weight × sub-score).
- Cash flow +30.0/30.0
- 1% rule +10.0/10.0
- DSCR +10.0/10.0
- ARV discount +7.5/15.0
- Rent growth +4.6/5.0
- Condition / age +4.0/5.0
- Livability +3.0/5.0
- Schools +2.4/10.0
- Appreciation +0.0/10.0
$74,000
🖨 Deal sheet 📄 Offer letter ✓ Due diligence
Listing remarks MLS
Check out this move in ready home in Apple Carr Village with easy access off the main entrance to the park and near the office, common room, gym, pool and playground. This 2022 3 bedroom, 2 full bath home with large kitchen and convenient laundry is ready for you to make it your own. Corner lot with a nice shed for all of your yard tools.
Key facts
- Convenient laundry
- Nice shed
- Large kitchen
Tags
Property features AI
Finance
- HOA & community: Has association with clubhouse, pool, playground, storage; pets allowed
Exterior
- Utilities: Public water; Natural gas available and connected; Electricity available
- Home design: Ranch-style home; Residential property; 990 sq. ft. living area
- Construction: Built in 2022; Vinyl siding; Composition roof
- Exterior features: Leased land; Shed(s) on property; Paved road access
Interior
- Kitchen: Kitchen (approx. 14.1 x 7.9); Dishwasher; Microwave; Range; Refrigerator
- Bedrooms: Primary bedroom (approx. 11.4 x 14.5); Bedroom 2 (approx. 11 x 7.8); Bedroom 3 (approx. 8.9 x 9.3)
- Bathrooms: 2 full bathrooms; Primary bathroom (approx. 4.11 x 5.5); Second bathroom (approx. 7.1 x 4.11)
- Heating & cooling: Forced air heating; Has heating; Has cooling
- Interior features: 6 total rooms; Crawl space and slab foundation/basement
- Laundry & utility: Dedicated laundry room (approx. 3.9 x 8.1); Washer included
Neighborhood map
What this means for you Summary
Snapshot
- This is a 3-bed/2.0-bath manufactured listed at $74k. Condition is rated good.
Deal economics
- At list price, monthly cash flow is $632 ($8k/yr) — positive.
- The deal already cash-flows at list — no discount required.
- Meets the 1% rule at list price ($1k rent vs $74k).
- Cap rate 16.5% vs local median 3.6% in Wolf Lake — top-decile yield for the area; either an underpriced asset or a hidden risk that comps aren't pricing in. Stress-test before assuming the spread holds.
Location & tenants
- Location reads 60/100 on livability (#594 in MI) — a middle-class / working-renter tenant base. Strengths: cost of living A+, housing A+, crime B+; Watch: schools F, amenities F, commute F.
- Oakridge Public Schools (suburban): math 17% / reading 40% proficiency, ranked #389 of 540 in MI (top 72%) — low school quality limits family demand, transient renter base, plan for 1-2y turnover.
- Market conditions: Rents rising fast (+8.2%/yr); 289 active listings in the ZIP; 1 comparable units currently listed for rent nearby; 438 units permitted in Muskegon County in 2024 (115 in 5+ unit buildings).
- This rent runs 36% of the median local income ($49k/yr) — at the standard rent-burdened threshold; future hikes will face affordability resistance.
Forward outlook
- Local home prices are declining (-3.0%/yr); year-one equity from $512 of loan paydown is wiped out by about $2k of value loss. Plan a longer hold.
- Muskegon County population projected to shrink 8% by 2050 — rents likely to lag national; underwrite the cash flow, not the appreciation.
- At projected returns (-3.0% appreciation + 8.0% rent growth), your $21k cash investment doubles in ~3 years — after that, you're playing with house money.
Negotiation context
- Only 7 days on market — expect competitive offers; lowballing is unlikely to land.
- 2 sale attempts with the ask held roughly flat each time — persistent listings suggest the price (not the market) is what's stuck; bring a comps-based counter.
Questions for the listing agent
- Is there a deadline driving the sale (1031 exchange, divorce, estate, relocation)? That informs how much negotiation room exists.
- Schools are F-rated, which usually means shorter tenancies and higher turnover. Who's the typical renter profile here, and what's been the actual vacancy rate?
- What's the average days-on-market for RENTAL listings here right now (not sales)? A rising rental-DOM trend means longer vacancies and softer asking-rent achievability than the comps imply.
- What's the recent tenant-quality profile in this submarket — average credit score on applications, eviction rate, late-payment / NSF rate, and stable-employment percentage? A property-management company in the area should have these aggregated.
- How much new for-sale + rental construction is in the pipeline within 1–3 miles? Heavy new supply typically softens prices + rents 12–24 months out; constrained supply supports both.
Investment metrics
- 1% rule
- 1.96% ✓
- Cap rate
- 16.54%
- Cash-on-cash
- 36.60%
- DSCR
- 2.63
- GRM
- 4.3
CMA / ARV
- ARV (on-the-fly)
- $29,700
- Comps found
- 3
Show comp detail 3 sales within ~0.75 mi
| Address | Dist | Beds/Ba | Sqft | Sold | Price | $/sf | Match |
|---|---|---|---|---|---|---|---|
| 583 S Mcintosh Ln | 0.08mi | 3/2.0 | 980 (-1%) | 1mo | $25,000 | $26 | 94 |
| 4927 Winesap Dr | 0.24mi | 2/2.0 (-1) | 987 (-0%) | 7mo | $30,000 | $30 | 77 |
| 567 Harvest Ln | 0.16mi | 3/2.0 | 1,056 (+7%) | 10mo | $40,000 | $38 | 73 |
Match score weights: distance 35% · size 25% · config 20% · recency 20%. Top-matched comps best support the ARV.
Projected returns pro-forma
-3.0% appreciation · 8.0% rent growth · sell at horizon
- IRR
- 38.0%
- Equity multiple
- 2.73×
- Total profit
- $35,933
- Equity at exit
- $11,034
- IRR
- 47.0%
- Equity multiple
- 6.70×
- Total profit
- $118,025
- Equity at exit
- $6,398
Cash invested: $20,720 (down + closing). Projections, not guarantees.
Landlord ↔ Tenant lean methodology
- Overall (STATE)
- 62 Landlord-Friendly
- State Michigan
- 62 Landlord-Friendly · EVEN
- County
- — inherits STATE
- City
- — inherits STATE
ZIP-level market 49442
- Rents YoY
- 8.2%
- Active inventory
- 289
- Price-to-rent
- 4.3×
Monthly cashflow live
- Estimated rent
- $1,447 medium interval (Pro) →
- Mortgage (P&I)
- −$388
- Tax est. 1.5%
- −$92 /mo · $1,110/yr
- Insurance
- −$31
- HOA
- −$0
- Vacancy / Maint / Mgmt
- −$304
- Net cashflow
- $632
Break-even live
UW: 25.0% down · 7.5% · 30yr · 1.5% tax · 5.0% vac · 8.0% maint · 8.0% mgmt
Financing live
Cash to close
- Down payment
- $18,500
- Closing costs
- $2,220
- Reserves months
- —
- Total cash needed
- —
Loan-product check · same deal, 3 products live
Conventional
25% down · 7.5% · 30yr
- Down + closing
- —
- Monthly P&I
- —
- Monthly cashflow
- —
- DSCR
- —
- Eligible?
- —
Personal DTI + credit; lowest rate.
DSCR
20% down · 8.5% · 30yr
- Down + closing
- —
- Monthly P&I
- —
- Monthly cashflow
- —
- DSCR
- —
- Eligible?
- —
No personal income docs; deal must DSCR.
Hard money
10% down · 12.0% · 12mo
- Down + closing
- —
- Monthly P&I
- —
- Monthly cashflow
- —
- DSCR
- —
- Eligible?
- —
Short-term bridge; refi at stabilization.
Rent comps 1 comps
| Address | Beds | Baths | Sqft | Rent | $/sqft | DOM | Units | Dist |
|---|---|---|---|---|---|---|---|---|
| 516 Courtland Ln Muskegon, MI | 3.0 | 2.0 | 1223 | $1,414 | $1.16 | 3d | 1 | 0.12mi |
Listing history 7 events
-
2026-06-19days on market $74,000 Active 7 DOM
-
2026-06-18days on market $74,000 Active 6 DOM
-
2026-06-17days on market $74,000 Active 5 DOM
-
2026-06-16days on market $74,000 Active 4 DOM
-
2026-06-15days on market $74,000 Active 3 DOM
-
2026-06-13remarks 340-char remark
-
2026-06-13$74,000 Active 1 DOM
ⓘ Source: listings_history table (triggers on properties + properties_extension) + one-shot
backfill from property_details.listing_events for pre-trigger history.
Nearby sold comps map
Loading sold comps map…
Walkable amenities ~0.75 mi
Loading nearby amenities…
Taxation est. · year 1
- Rental income
- $17,368
- − Mortgage interest
- −$4,145
- − Property taxes
- −$1,110
- − Insurance
- −$370
- − Repairs & maintenance
- −$1,389
- − Management
- −$1,389
- − Depreciation
- −$2,153
- Taxable income
- $6,812
- Est. tax owed @ 24.0%
- −$1,635
- After-tax cash flow
- $5,949/yr
For passive investors: Depreciation is non-cash, so a rental often shows a tax loss while cash-flowing — sheltering income. Rental losses are passive: they offset passive income freely, and up to $25,000/yr can offset ordinary (W-2) income if you actively participate and your MAGI is under $100k (phasing out to $0 by $150k); unused losses carry forward. On sale, claimed depreciation is recaptured at up to 25%, and gains may owe capital-gains tax (a 1031 exchange can defer both). Figures are a year-1 estimate at your 24.0% rate — not tax advice; consult a CPA.
Condition & rehab AI · 12 photos
This move-in ready mobile home is in good condition with modern updates and a good curb appeal. It has the potential to be further enhanced with some exterior and interior updates to increase its value.
Value-add opportunities
- Both Paint the exterior siding — Enhances curb appeal and can increase both resale and rental value
- Both Replace the carpet with hardwood or tile flooring — Improves aesthetics and can increase both resale and rental value
- Both Install new windows — Can increase natural light and reduce energy costs, enhancing both resale and rental value
Renovation cost estimate screening
Value-add ROI direction
- Both Paint the exterior siding — Enhances curb appeal and can increase both resale and rental value ↑
- Both Replace the carpet with hardwood or tile flooring — Improves aesthetics and can increase both resale and rental value ↑
- Both Install new windows — Can increase natural light and reduce energy costs, enhancing both resale and rental value ↑
ⓘ Cost ranges are severity-bucket heuristics (US national rule-of-thumb). Get contractor quotes + a written scope before underwriting a rehab budget.
Schools (NCES district)
- District
- Oakridge Public Schools
- NCES district ID
- 2626220
- Math proficiency
- 17% ▼ -8.00%
- Reading proficiency
- 40% ▼ -4.00%
- Median HH income
- $41,553
- Composite
- 24.06/100
- National rank
- #7762
- State rank
- #389 of 540 in MI
Livability — Wolf Lake
- Score
- 60/100
- State rank
- #594
- US rank
- #19391
Category grades
Schools grade is shown separately in the Schools card above.
Census & demographics
- Census place
- Wolf Lake, MI
- County
- Muskegon County · 107,917 people
- Metro
- Muskegon, MI
- Population (ZIP)
- 44,766
- Household income
- $48,563
- Rent vs Own
- Severe rent burden
- 1598.0
Population outlook (Muskegon County) Hauer SSP2
- Today (2025)
- 174,032 people
- By 2030
- 173,365 · -0.4%
- By 2040
- 168,877 · -3.0%
- By 2050
- 160,306 · -7.9%
- By 2075
- 134,426 · -22.8%
- By 2100
- 98,836 · -43.2%
Race, ethnicity, and origin ACS 2023
- Neighborhood character
- Diverse neighborhood (Simpson 0.56)
- Race & ethnicity
- White 63% Black 22% Two or more races 10% Hispanic / Latino 8%
- Hispanic origin (detail)
- Mexican 7%
- Common ancestry
- Iranian 5% Romanian 4% Lithuanian 3%
- Foreign-born
- 3% · Canada, South Korea
- Languages at home
- 95% English-only · Spanish 3%
Political lean MEDSL · Muskegon
- 2024 margin
- Toss-up / Even · D 48.4% · R 50.2% · Other 1.5%
- 2008→2024 swing
- -31.1pp toward R · 2008: 29.3pp · 2024: -1.8pp
- All cycles
- 2024: R+1.8 2020: D+0.6 2016: D+0.9 2012: D+17.8 2008: D+29.3
Not yet ingested
- Civics
- —
Market trends
- HPI YoY
- ▼ -174.87%
- Current HPI
- 287.0558
- Rent YoY
- ▲ 8.21%
- Metro
- Muskegon, MI
- State GDP YoY
- ▲ 1.37%
- F500 in state
- 28
Industry mix (Fortune 500 HQ in MI)
| Industry | F500 HQs | Revenue |
|---|---|---|
| Automotive Parts | 3 | $48B |
|
||
| Automotive | 2 | $372B |
|
||
| Chemicals | 1 | $45B |
|
||
| Automotive Retail | 1 | $29B |
|
||
| Healthcare / Medical Devices | 1 | $23B |
|
||
| Automotive Technology | 1 | $20B |
|
||
Price history
+0.0% since first listed2 events — show timeline
- 2026-06-11 Listed $74,000 MiRealSource-MiMLS
- 2026-06-11 Listed $74,000 SW Michigan MLS
Cash-flow waterfall
monthlySold comps — $/sqft
last 12 mo · ≤1 miLoading sold comps…