10 Garden St · Tequesta, FL
Flood risk 3/10 · Minor
- FEMA flood zone
- X (unshaded)
- Chance of flooding over 30 yrs
- 0.1%
- Est. flood insurance / yr
- $507 – $1,088
Fire risk 2/10 · Minimal
- Est. fire insurance / yr
- $947 – $1,759
Heat risk 10/10 · Severe
- Hot days now (above 106°F)
- 7 days/yr
- Hot days in 30 yrs
- 25 days/yr
Wind risk 10/10 · Severe
- Chance of severe wind over 30 yrs
- 99.0%
Air-quality risk 2/10 · Minimal
- Unhealthy air days now
- 1 days/yr
- Unhealthy air days in 30 yrs
- 1 days/yr
Risk factors via First Street. Map © Google.
Why this score? — see what drove the D+ grade
The composite is a weighted blend of 9 inputs, each scored 0–100. Each bar is that input's sub-score; the figure is the points it added to the 100-point composite (weight × sub-score).
- ARV discount +15.0/15.0
- Cash flow +12.7/30.0
- Schools +4.3/10.0
- DSCR +3.8/10.0
- Condition / age +3.8/5.0
- 1% rule +3.6/10.0
- Rent growth +3.5/5.0
- Livability +3.1/5.0
- Appreciation +0.0/10.0
$310,000
🖨 Deal sheet 📄 Offer letter ✓ Due diligence
Listing remarks
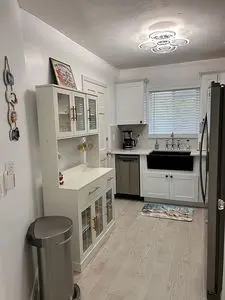
Beautifully renovated 2bedroom, 2 bathroom with walk in closet and washer/dryer. Located in the best building in Tequesta Garden super quiet with garden views. Comes fully furnished turn key just bring your clothes and you are enjoying everything Jupiter has to offer. Ride your bike to the beach!
Key facts
- Bike to the beach
- Garden views
- Walk in closet
Tags
Neighborhood map
What this means for you Summary
Snapshot
- This is a 2-bed/2.0-bath single-family listed at $310k. Condition is rated good.
Deal economics
- At list price, monthly cash flow is $-34 ($-409/yr) — negative.
- To cash-flow at today's rent, offer at most $305k (1.6% below list).
- To meet the 1% rule (rent ≥ 1% of price), the offer needs to be $267k (13.9% below list).
- Recommended offer: $267k (13.9% below list) — sets the bar for 1% rule.
- Cap rate 6.2% vs local median 2.5% in Tequesta — top-decile yield for the area; either an underpriced asset or a hidden risk that comps aren't pricing in. Stress-test before assuming the spread holds.
Location & tenants
- Location reads 62/100 on livability (#764 in FL) — a middle-class / working-renter tenant base. Strengths: crime A+, employment A+, housing A; Watch: schools F, amenities F, commute F.
- Palm Beach (suburban): math 46% / reading 53% proficiency, ranked #34 of 73 in FL (top 47%) — families likely to look elsewhere, expect single-tenant / working-renter base with shorter leases.
- Market conditions: Rents rising (+3.9%/yr); 206 active listings in the ZIP; 20 comparable units currently listed for rent nearby; rentals at typical pace (median 21d on market — plan ~3-4 weeks tenant-placement turnaround); solid renter incomes; 3,974 units permitted in Palm Beach County in 2024 (1,012 in 5+ unit buildings).
- This rent runs 30% of the median local income ($106k/yr) — at the standard rent-burdened threshold; future hikes will face affordability resistance.
Forward outlook
- Local home prices are declining (-3.0%/yr); year-one equity from $2k of loan paydown is wiped out by about $9k of value loss. Plan a longer hold.
- Palm Beach County population projected at +30% by 2050 — long-run rental-demand tailwind backs the buy-and-hold thesis.
Negotiation context
- It's been on market 23 days — a 2% lower offer ($305k) is reasonable based on typical stale-listing flexibility.
Risks & watch-outs
- Climate carrying-cost: severe wind risk, 99% chance of damaging wind over 30y; extreme-heat days projected 7→25/yr by 2055 (HVAC capex compounding) — expect insurance premiums to compound above CPI over the hold.
Questions for the listing agent
- What do current leases actually rent for vs. the listed asking? Can we see a recent rent roll and the last 12 months of T-12 income?
- Built in 1970 — when were the roof, HVAC, electrical panel, plumbing, and water heater last replaced?
- Is there a deadline driving the sale (1031 exchange, divorce, estate, relocation)? That informs how much negotiation room exists.
- Schools are F-rated, which usually means shorter tenancies and higher turnover. Who's the typical renter profile here, and what's been the actual vacancy rate?
- The area grade is low — what's the realistic commute time and amenity access for the typical tenant pool here? Any planned neighborhood developments (good or bad) we should know about?
- What's the average days-on-market for RENTAL listings here right now (not sales)? A rising rental-DOM trend means longer vacancies and softer asking-rent achievability than the comps imply.
- What's the recent tenant-quality profile in this submarket — average credit score on applications, eviction rate, late-payment / NSF rate, and stable-employment percentage? A property-management company in the area should have these aggregated.
- How much new for-sale + rental construction is in the pipeline within 1–3 miles? Heavy new supply typically softens prices + rents 12–24 months out; constrained supply supports both.
Investment metrics
- 1% rule
- 0.86% ✗
- Cap rate
- 6.16%
- Cash-on-cash
- -0.47%
- DSCR
- 0.98
- GRM
- 9.7
CMA / ARV
- ARV (on-the-fly)
- $394,270
- Comps found
- 1
Show comp detail 1 sale within ~0.75 mi
| Address | Dist | Beds/Ba | Sqft | Sold | Price | $/sf | Match |
|---|---|---|---|---|---|---|---|
| 19121 SE Barus Dr | 0.61mi | 3/1.0 (+1) | 1,012 (+14%) | 23mo | $450,000 | $445 | 19 |
Match score weights: distance 35% · size 25% · config 20% · recency 20%. Top-matched comps best support the ARV.
Projected returns pro-forma
-3.0% appreciation · 3.88% rent growth · sell at horizon
- IRR
- -16.1%
- Equity multiple
- 0.42×
- Total profit
- $-49,979
- Equity at exit
- $46,222
- IRR
- -6.2%
- Equity multiple
- 0.58×
- Total profit
- $-36,194
- Equity at exit
- $26,803
Cash invested: $86,800 (down + closing). Projections, not guarantees.
Landlord ↔ Tenant lean methodology
- Overall (STATE)
- 87 Strongly Landlord-Friendly
- State Florida
- 87 Strongly Landlord-Friendly · R+3
- County
- — inherits STATE
- City
- — inherits STATE
ZIP-level market 33469
- Home prices YoY
- -30.4%
- Rents YoY
- 3.9%
- Active inventory
- 206
- Price-to-rent
- 9.7×
Monthly cashflow live
- Estimated rent
- $2,669 high interval (Pro) →
- Mortgage (P&I)
- −$1,626
- Tax est. 1.5%
- −$388 /mo · $4,650/yr
- Insurance
- −$129
- HOA
- −$0
- Vacancy / Maint / Mgmt
- −$560
- Net cashflow
- $-34
Break-even live
UW: 25.0% down · 7.5% · 30yr · 1.5% tax · 5.0% vac · 8.0% maint · 8.0% mgmt
Financing live
Cash to close
- Down payment
- $77,500
- Closing costs
- $9,300
- Reserves months
- —
- Total cash needed
- —
Loan-product check · same deal, 3 products live
Conventional
25% down · 7.5% · 30yr
- Down + closing
- —
- Monthly P&I
- —
- Monthly cashflow
- —
- DSCR
- —
- Eligible?
- —
Personal DTI + credit; lowest rate.
DSCR
20% down · 8.5% · 30yr
- Down + closing
- —
- Monthly P&I
- —
- Monthly cashflow
- —
- DSCR
- —
- Eligible?
- —
No personal income docs; deal must DSCR.
Hard money
10% down · 12.0% · 12mo
- Down + closing
- —
- Monthly P&I
- —
- Monthly cashflow
- —
- DSCR
- —
- Eligible?
- —
Short-term bridge; refi at stabilization.
Rent comps 20 comps
| Address | Beds | Baths | Sqft | Rent | $/sqft | DOM | Units | Dist |
|---|---|---|---|---|---|---|---|---|
| 11 Westwood Ave Unit 103A Jupiter, FL | 2.0 | 2.0 | 886 | $2,350 | $2.65 | 24d | 1 | 0.11mi |
| 6 Garden St Unit 204P Jupiter, FL | 2.0 | 2.0 | 886 | $2,400 | $2.71 | 24d | 1 | 0.12mi |
| 4 Westwood Ave Unit 204 Jupiter, FL | 2.0 | 2.0 | 980 | $2,000 | $2.04 | 15d | 1 | 0.19mi |
| 284 Village Blvd Tequesta, FL | 2.0–3.0 | 2.0 | 1182 | $3,100 | $2.62 | 11d | 2 | 0.48mi |
| 284 Village Blvd Tequesta, FL | 1.0–3.0 | 1.0–2.0 | 1087 | $2,600 | $2.39 | 24d | 3 | 0.48mi |
| 284 Village Blvd Tequesta, FL | 1.0–3.0 | 1.0–2.0 | 1087 | $2,600 | $2.39 | 10d | 2 | 0.48mi |
| 413 N Cypress Dr Jupiter, FL | 2.0 | 1.5 | 1024 | $2,450 | $2.39 | 20d | 1 | 0.48mi |
| 331 Tequesta Dr Tequesta, FL | 2.0 | 2.0 | 793 | $2,150 | $2.71 | 19d | 2 | 0.49mi |
| 331 Tequesta Dr Tequesta, FL | 2.0 | 2.0 | 717 | $2,250 | $3.14 | 5d | 2 | 0.49mi |
| 331 Tequesta Dr #118 Jupiter, FL | 2.0 | 2.0 | 717 | $2,500 | $3.49 | 5d | 1 | 0.49mi |
| 272 Village Blvd #7305 Tequesta, FL | 2.0 | 2.0 | 991 | $2,200 | $2.22 | 5d | 1 | 0.50mi |
| 242 Village Blvd Tequesta, FL | 2.0 | 2.0 | 991 | $3,150 | $3.18 | 20d | 2 | 0.54mi |
| 405 N Cypress Dr #3 Jupiter, FL | 2.0 | 1.5 | 960 | $1,950 | $2.03 | 15d | 1 | 0.54mi |
| 91 Willow Rd #107 Jupiter, FL | 2.0 | 1.0 | 864 | $2,100 | $2.43 | 24d | 1 | 0.56mi |
| 242 Village Blvd #2304 Tequesta, FL | 2.0 | 2.0 | 991 | $3,800 | $3.83 | 24d | 1 | 0.57mi |
| 254 Village Blvd #4306 Tequesta, FL | 2.0 | 2.0 | 991 | $3,000 | $3.03 | 24d | 1 | 0.59mi |
| 114 Lighthouse Cir Unit J Jupiter, FL | 2.0 | 2.0 | 981 | $2,350 | $2.40 | 24d | 1 | 0.65mi |
| 1519 Treemont Ave Jupiter, FL | 3.0 | 2.0 | 888 | $3,200 | $3.60 | 24d | 1 | 0.75mi |
| 150 Pineview Rd Jupiter, FL | 1.0–2.0 | 1.0–2.0 | 982 | $2,800 | $2.85 | 3d | 5 | 0.82mi |
| 249 Center St Unit 2C Jupiter, FL | 2.0 | 2.0 | 1040 | $2,950 | $2.84 | 24d | 1 | 1.46mi |
Listing history 12 events
-
2026-06-18days on market $310,000 Active 23 DOM
-
2026-06-17days on market $310,000 Active 22 DOM
-
2026-06-16days on market $310,000 Active 21 DOM
-
2026-06-15days on market $310,000 Active 20 DOM
-
2026-06-13days on market $310,000 Active 18 DOM
-
2026-06-09days on market $310,000 Active 14 DOM
-
2026-06-07days on market $310,000 Active 12 DOM
-
2026-06-04days on market $310,000 Active 9 DOM
-
2026-06-03days on market $310,000 Active 8 DOM
-
2026-06-01days on market $310,000 Active 6 DOM
-
2026-05-31days on market $310,000 Active 5 DOM
-
2026-05-26$310,000 Active
ⓘ Source: listings_history table (triggers on properties + properties_extension) + one-shot
backfill from property_details.listing_events for pre-trigger history.
Climate risk First Street
- Flood 3/10 Moderate FEMA zone X (unshaded) · 10% chance over 30 yrs
- Wildfire 2/10 Low
- Heat 10/10 Extreme 7 d/yr ≥106°F today · 25 d/yr by 30 yrs out
- Wind 10/10 Extreme 99% chance of damaging wind over 30 yrs
- Air quality 2/10 Low 1 unhealthy d/yr today · 1 by 30 yrs out
Nearby sold comps map
Loading sold comps map…
Walkable amenities ~0.75 mi
Loading nearby amenities…
Taxation est. · year 1
- Rental income
- $32,024
- − Mortgage interest
- −$17,365
- − Property taxes
- −$4,650
- − Insurance
- −$1,550
- − Repairs & maintenance
- −$2,562
- − Management
- −$2,562
- − Depreciation
- −$9,018
- Taxable loss
- −$5,683
- Est. tax savings @ 24.0%
- +$1,364
- After-tax cash flow
- $955/yr
For passive investors: Depreciation is non-cash, so a rental often shows a tax loss while cash-flowing — sheltering income. Rental losses are passive: they offset passive income freely, and up to $25,000/yr can offset ordinary (W-2) income if you actively participate and your MAGI is under $100k (phasing out to $0 by $150k); unused losses carry forward. On sale, claimed depreciation is recaptured at up to 25%, and gains may owe capital-gains tax (a 1031 exchange can defer both). Figures are a year-1 estimate at your 24.0% rate — not tax advice; consult a CPA.
Condition & rehab AI · 1 photo
This property is in good condition with cosmetic updates needed. It offers a good investment opportunity with potential for both resale and rental value.
Value-add opportunities
- Both Paint the exterior and landscaping — Enhances curb appeal and property value
- Resale Replace the kitchen faucet — Improves functionality and aesthetics
- Both Install smart home devices — Enhances convenience and marketability
Renovation cost estimate screening
Value-add ROI direction
- Both Paint the exterior and landscaping — Enhances curb appeal and property value ↑
- Resale Replace the kitchen faucet — Improves functionality and aesthetics ↑
- Both Install smart home devices — Enhances convenience and marketability ↑
ⓘ Cost ranges are severity-bucket heuristics (US national rule-of-thumb). Get contractor quotes + a written scope before underwriting a rehab budget.
Schools (NCES district)
- District
- Palm Beach
- NCES district ID
- 1201500
- Math proficiency
- 46% ▼ -16.00%
- Reading proficiency
- 53% ▼ -4.00%
- Median HH income
- $53,943
- Composite
- 42.72/100
- National rank
- #3160
- State rank
- #34 of 73 in FL
Livability — Tequesta
- Score
- 62/100
- State rank
- #764
- US rank
- #16907
Category grades
Schools grade is shown separately in the Schools card above.
Census & demographics
- Census place
- Tequesta, FL
- County
- Martin County · 165,223 people
- City population
- 14,686
- Metro
- Port St. Lucie, FL
- Population (ZIP)
- 14,686
- Household income
- $106,265
- Rent vs Own
- Severe rent burden
- 404.0
Population outlook (Palm Beach County) Hauer SSP2
- Today (2025)
- 1,637,487 people
- By 2030
- 1,743,255 · +6.5%
- By 2040
- 1,948,712 · +19.0%
- By 2050
- 2,132,979 · +30.3%
- By 2075
- 2,530,027 · +54.5%
- By 2100
- 2,706,979 · +65.3%
Race, ethnicity, and origin ACS 2023
- Neighborhood character
- Predominantly White (87%)
- Race & ethnicity
- White 87% Hispanic / Latino 9% Two or more races 7% Asian 1%
- Hispanic origin (detail)
- Puerto Rican 2% Cuban 3%
- Common ancestry
- Lithuanian 6% Slovak 4% Romanian 3%
- Foreign-born
- 7% · Canada, China
- Languages at home
- 90% English-only · Spanish 5% Other Indo-European 3% Russian/Polish/Slavic 1%
Political lean MEDSL · Palm Beach
- 2024 margin
- Toss-up / Even · D 50.0% · R 49.2%
- 2008→2024 swing
- -22.1pp toward R · 2008: 22.9pp · 2024: 0.8pp
- All cycles
- 2024: D+0.8 2020: D+12.8 2016: D+15.3 2012: D+17.0 2008: D+22.9
Not yet ingested
- Civics
- —
Market trends
- HPI YoY
- ▼ -183.36%
- Current HPI
- 419.948
- Rent YoY
- ▲ 3.88%
- Metro
- Port St. Lucie, FL
- State GDP YoY
- ▲ 3.28%
- F500 in state
- 36
Industry mix (Fortune 500 HQ in FL)
| Industry | F500 HQs | Revenue |
|---|---|---|
| Industrial Technology | 2 | $29B |
|
||
| Insurance | 2 | $17B |
|
||
| Retail | 1 | $60B |
|
||
| Technology Distribution | 1 | $58B |
|
||
| Homebuilding | 1 | $35B |
|
||
| Technology Manufacturing | 1 | $35B |
|
||
Price history
1 event — show timeline
- 2026-05-26 Listed $310,000 FSBO.com
Cash-flow waterfall
monthlySold comps — $/sqft
last 12 mo · ≤1 miLoading sold comps…