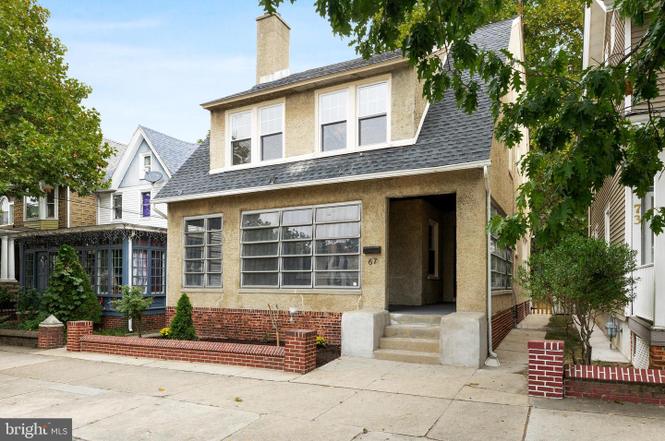
67 Washington St · Bridgeton, NJ
Flood risk 1/10 · Minimal
- FEMA flood zone
- X (unshaded)
- Chance of flooding over 30 yrs
- 0.0%
- Est. flood insurance / yr
- $507 – $1,088
Fire risk 4/10 · Minor
- Est. fire insurance / yr
- $526 – $976
Heat risk 8/10 · Major
- Hot days now (above 102°F)
- 7 days/yr
- Hot days in 30 yrs
- 15 days/yr
Wind risk 6/10 · Moderate
- Chance of severe wind over 30 yrs
- 67.0%
Air-quality risk 3/10 · Minor
- Unhealthy air days now
- 2 days/yr
- Unhealthy air days in 30 yrs
- 3 days/yr
Risk factors via First Street. Map © Google.
Why this score? — see what drove the D grade
The composite is a weighted blend of 9 inputs, each scored 0–100. Each bar is that input's sub-score; the figure is the points it added to the 100-point composite (weight × sub-score).
- Cash flow +15.4/30.0
- ARV discount +7.7/15.0
- 1% rule +5.2/10.0
- DSCR +4.7/10.0
- Livability +3.6/5.0
- Rent growth +2.5/5.0
- Condition / age +2.5/5.0
- Schools +1.0/10.0
- Appreciation +0.0/10.0
$219,000
🖨 Deal sheet 📄 Offer letter ✓ Due diligence
Listing remarks MLS
Welcome to 67 Washington Street, Bridgeton, NJ—a residence that beautifully marries timeless charm with modern convenience. This expansive 2,314-square-foot home offers a versatile layout with 7 potential bedrooms, providing ample space for various lifestyle needs. As you step into the home, you are greeted by an enchanting enclosed front porch, perfect for enjoying serene moments. The entryway showcases exquisite original millwork, wainscoting, and a captivating stained glass window, leading into a living room rich with historic details. Here, you'll find magnificent built-in benches surrounding a grand mantle and fireplace, complemented by elegant wood beams and original hardwood floors. The wide, stately staircase enhances the home's classic allure. Adjacent to the living area is a formal dining room that skillfully blends historic charm with contemporary updates, featuring a picture railing and modern LVP flooring. The creatively designed half bath harmonizes with the home's historic aesthetic, incorporating a vanity built into original cabinetry. A versatile bonus room on the main floor offers endless possibilities—whether as a bedroom, office, or media space. The kitchen is thoughtfully updated for efficiency while preserving its vintage character, complete with a non-functional yet charming dumbwaiter and a secondary staircase. The second floor hosts four generously sized bedrooms at the front, each bathed in natural light, with fresh paint and original hardwood floors. The spacious full bath is both fresh and modern. A fifth bedroom is located towards the rear, past a substantial linen closet and additional dumbwaiter access. The third floor presents a large, adaptable space with high ceilings and abundant natural light, ideal for a bedroom, studio, or creative area. The full basement offers additional potential for finishing or ample storage, complete with laundry hookups. Outside, a large detached garage provides extensive storage and parking solutions, enhancing the home's practicality. With air conditioning ensuring comfort throughout, this property is a true gem, offering a seamless blend of historic elegance and modern amenities. Discover the unique character and versatility of this splendid home today.
Key facts
- 5,824 sq ft lot
- Built 1900
- Listed 2 days
Property features AI
Exterior
- Parking: On-street parking
- Utilities: Public water; Public sewer
- Home design: Detached structure; Brick construction
- Construction: Brick construction; Concrete perimeter foundation; Above-grade and below-grade structures; Year built estimated
- Exterior features: Not in a federal flood zone; At least two access/egress exits
Interior
- Bedrooms: Six bedrooms on the first upper level
- Bathrooms: One full bathroom (all upper levels); One full bathroom on first upper level; One half bathroom on main level; One half bathroom total
- Heating & cooling: 90% forced air heating; Natural gas heating; Central air conditioning (central A/C) with natural gas cooling fuel; Electric hot water
- Interior features: Living area reported by assessor; One fireplace
Neighborhood map
What this means for you Summary
Snapshot
- This is a 6-bed/1.5-bath single-family listed at $219k.
Deal economics
- At list price, monthly cash flow is $83 ($1k/yr) — positive.
- The deal already cash-flows at list — no discount required.
- Meets the 1% rule at list price ($2k rent vs $219k).
- Cap rate 6.7% vs local median 4.9% in Bridgeton — top-decile yield for the area; either an underpriced asset or a hidden risk that comps aren't pricing in. Stress-test before assuming the spread holds.
Location & tenants
- Location reads 71/100 on livability (#240 in NJ) — a middle-class / working-renter tenant base. Strengths: commute A+, health & safety A+, housing A-; Watch: employment D, schools F, crime F.
- Bridgeton City School District (town): math 4% / reading 21% proficiency, ranked #468 of 472 in NJ (top 99%) — low school quality limits family demand, transient renter base, plan for 1-2y turnover.
- Market conditions: 201 active listings in the ZIP; 216 units permitted in Cumberland County in 2024 (73 in 5+ unit buildings).
Forward outlook
- Local home prices are declining (-3.0%/yr); year-one equity from $2k of loan paydown is wiped out by about $7k of value loss. Plan a longer hold.
- Cumberland County population projected to shrink 7% by 2050 — rents likely to lag national; underwrite the cash flow, not the appreciation.
Negotiation context
- Only 2 days on market — expect competitive offers; lowballing is unlikely to land.
- 8 sale attempts since 13y ago; this cycle's ask is 29% above the opening price — seller raised mid-cycle; expect resistance to lowballs.
Risks & watch-outs
- Watch-outs: built in 1900 — expect roof / HVAC / electrical / plumbing capex.
- Climate carrying-cost: major wind risk, 67% chance of damaging wind over 30y; extreme-heat days projected 7→15/yr by 2055 (HVAC capex compounding) — expect insurance premiums to compound above CPI over the hold.
Questions for the listing agent
- Built in 1900 — when were the roof, HVAC, electrical panel, plumbing, and water heater last replaced?
- Is there a deadline driving the sale (1031 exchange, divorce, estate, relocation)? That informs how much negotiation room exists.
- Schools are F-rated, which usually means shorter tenancies and higher turnover. Who's the typical renter profile here, and what's been the actual vacancy rate?
- Crime grade is F in this area — have there been break-ins, vandalism, or insurance claims at this property in the last 3 years? What carrier currently insures it and at what premium?
- The area grade is low — what's the realistic commute time and amenity access for the typical tenant pool here? Any planned neighborhood developments (good or bad) we should know about?
- What's the average days-on-market for RENTAL listings here right now (not sales)? A rising rental-DOM trend means longer vacancies and softer asking-rent achievability than the comps imply.
- What's the recent tenant-quality profile in this submarket — average credit score on applications, eviction rate, late-payment / NSF rate, and stable-employment percentage? A property-management company in the area should have these aggregated.
- How much new for-sale + rental construction is in the pipeline within 1–3 miles? Heavy new supply typically softens prices + rents 12–24 months out; constrained supply supports both.
Investment metrics
- 1% rule
- 1.02% ✓
- Cap rate
- 6.75%
- Cash-on-cash
- 1.63%
- DSCR
- 1.07
- GRM
- 8.1
CMA / ARV
- ARV (on-the-fly)
- $219,830
- Comps found
- 2
Show comp detail 2 sales within ~0.75 mi
| Address | Dist | Beds/Ba | Sqft | Sold | Price | $/sf | Match |
|---|---|---|---|---|---|---|---|
| 67 Washington St | 0.00mi | 6/1.5 | 2,314 (0%) | 17mo | $219,000 | $95 | 86 |
| 105 Hampton St | 0.66mi | 5/1.5 (-1) | 2,166 (-6%) | 1mo | $173,000 | $80 | 53 |
Match score weights: distance 35% · size 25% · config 20% · recency 20%. Top-matched comps best support the ARV.
Projected returns pro-forma
-3.0% appreciation · 3.0% rent growth · sell at horizon
- IRR
- -13.6%
- Equity multiple
- 0.51×
- Total profit
- $-30,036
- Equity at exit
- $32,654
- IRR
- -4.6%
- Equity multiple
- 0.69×
- Total profit
- $-18,745
- Equity at exit
- $18,935
Cash invested: $61,320 (down + closing). Projections, not guarantees.
Landlord ↔ Tenant lean methodology
- Overall (STATE)
- 21 Tenant-Leaning
- State New Jersey
- 21 Tenant-Leaning · D+6
- County
- — inherits STATE
- City
- — inherits STATE
ZIP-level market 08302
- Home prices YoY
- -24.0%
- Active inventory
- 201
- Price-to-rent
- 8.1×
Monthly cashflow live
- Estimated rent
- $2,242 medium interval (Pro) →
- Mortgage (P&I)
- −$1,148
- Tax from tax record
- −$448 /mo · $5,373/yr
- Insurance
- −$91
- HOA
- −$0
- Vacancy / Maint / Mgmt
- −$471
- Net cashflow
- $83
Break-even live
UW: 25.0% down · 7.5% · 30yr · 1.5% tax · 5.0% vac · 8.0% maint · 8.0% mgmt
Financing live
Cash to close
- Down payment
- $54,750
- Closing costs
- $6,570
- Reserves months
- —
- Total cash needed
- —
Loan-product check · same deal, 3 products live
Conventional
25% down · 7.5% · 30yr
- Down + closing
- —
- Monthly P&I
- —
- Monthly cashflow
- —
- DSCR
- —
- Eligible?
- —
Personal DTI + credit; lowest rate.
DSCR
20% down · 8.5% · 30yr
- Down + closing
- —
- Monthly P&I
- —
- Monthly cashflow
- —
- DSCR
- —
- Eligible?
- —
No personal income docs; deal must DSCR.
Hard money
10% down · 12.0% · 12mo
- Down + closing
- —
- Monthly P&I
- —
- Monthly cashflow
- —
- DSCR
- —
- Eligible?
- —
Short-term bridge; refi at stabilization.
Listing history 4 events
-
2026-06-09days on market $219,000 Active 2 DOM
-
2026-06-08price $219,000 Active 1 DOM
-
2026-06-07remarks 699-char remark
-
2026-06-07$170,000 Active 1 DOM
ⓘ Source: listings_history table (triggers on properties + properties_extension) + one-shot
backfill from property_details.listing_events for pre-trigger history.
Tax reassessment forecast NJ · Partial reset (capped growth)
- Current annual tax
- $5,373 · $448/mo
- Projected year-2 tax
- $5,413 · $451/mo
- Expected delta
- +$40/yr (+$3/mo · 0.7%)
ⓘ Screening estimate from a state-policy table — verify with the county assessor before closing.
Climate risk First Street
- Flood 1/10 Low FEMA zone X (unshaded) · 0% chance over 30 yrs
- Wildfire 4/10 Moderate
- Heat 8/10 Severe 7 d/yr ≥102°F today · 15 d/yr by 30 yrs out
- Wind 6/10 Major 67% chance of damaging wind over 30 yrs
- Air quality 3/10 Moderate 2 unhealthy d/yr today · 3 by 30 yrs out
Nearby sold comps map
Loading sold comps map…
Walkable amenities ~0.75 mi
Loading nearby amenities…
Taxation est. · year 1
- Rental income
- $26,899
- − Mortgage interest
- −$12,267
- − Property taxes
- −$5,373
- − Insurance
- −$1,095
- − Repairs & maintenance
- −$2,152
- − Management
- −$2,152
- − Depreciation
- −$6,371
- Taxable loss
- −$2,511
- Est. tax savings @ 24.0%
- +$603
- After-tax cash flow
- $1,603/yr
For passive investors: Depreciation is non-cash, so a rental often shows a tax loss while cash-flowing — sheltering income. Rental losses are passive: they offset passive income freely, and up to $25,000/yr can offset ordinary (W-2) income if you actively participate and your MAGI is under $100k (phasing out to $0 by $150k); unused losses carry forward. On sale, claimed depreciation is recaptured at up to 25%, and gains may owe capital-gains tax (a 1031 exchange can defer both). Figures are a year-1 estimate at your 24.0% rate — not tax advice; consult a CPA.
Schools (NCES district)
- District
- Bridgeton City School District
- NCES district ID
- 3402250
- Math proficiency
- 4% ▼ -8.00%
- Reading proficiency
- 21% ▲ 3.00%
- Median HH income
- $34,542
- Composite
- 10.15/100
- National rank
- #9797
- State rank
- #468 of 472 in NJ
Livability — Bridgeton
- Score
- 71/100
- State rank
- #240
- US rank
- #6660
Category grades
Schools grade is shown separately in the Schools card above.
Census & demographics
- Census place
- Bridgeton, NJ
- Population (ZIP)
- 47,003
Population outlook (Cumberland County) Hauer SSP2
- Today (2025)
- 152,743 people
- By 2030
- 150,373 · -1.6%
- By 2040
- 146,881 · -3.8%
- By 2050
- 142,653 · -6.6%
- By 2075
- 129,468 · -15.2%
- By 2100
- 107,456 · -29.6%
Race, ethnicity, and origin ACS 2023
- Neighborhood character
- Diverse neighborhood (Simpson 0.69)
- Race & ethnicity
- Hispanic / Latino 39% White 30% Black 25% Two or more races 19% Native American 2% Asian 1%
- Hispanic origin (detail)
- Mexican 25% Puerto Rican 8% Dominican 2%
- Common ancestry
- Romanian 2%
- Foreign-born
- 17% · Canada, Jamaica
- Languages at home
- 64% English-only · Spanish 34% Other Indo-European 1%
Political lean MEDSL · Cumberland
- 2024 margin
- Toss-up / Even · D 47.6% · R 51.3% · Other 1.1%
- 2008→2024 swing
- -25.4pp toward R · 2008: 21.6pp · 2024: -3.8pp
- All cycles
- 2024: R+3.8 2020: D+6.0 2016: D+5.3 2012: D+23.1 2008: D+21.6
Not yet ingested
- Civics
- —
Market trends
- HPI YoY
- ▼ -91.94%
- Current HPI
- 290.6461
- Rent YoY
- —
- Metro
- —
- State GDP YoY
- ▲ 2.05%
- F500 in state
- 34
Industry mix (Fortune 500 HQ in NJ)
| Industry | F500 HQs | Revenue |
|---|---|---|
| Consumer Goods | 3 | $31B |
|
||
| Pharmaceuticals | 2 | $153B |
|
||
| Technology | 2 | $21B |
|
||
| Insurance | 2 | $20B |
|
||
| Healthcare | 2 | $19B |
|
||
| Financial Services | 1 | $70B |
|
||
Price history
+143.6% since first listed26 events — show timeline
- 2026-06-08 Price Changed $219,000 BRIGHT MLS
- 2026-06-08 Price Changed $200,000 BRIGHT MLS
- 2026-06-07 Relisted — BRIGHT MLS
- 2026-03-03 Listed $170,000 BRIGHT MLS
- 2026-03-03 Listing Removed — BRIGHT MLS
- 2025-01-13 Sold (Public Records) $219,000 Public Records
- 2025-01-10 Sold (MLS) $219,000 BRIGHT MLS
- 2024-11-27 Pending — BRIGHT MLS
- 2024-11-12 Contingent — BRIGHT MLS
- 2024-10-03 Listed $219,000 BRIGHT MLS
- 2019-08-26 Sold (Public Records) $500,000 Public Records
- 2018-04-02 Listing Removed — SJSRMLS
- 2018-03-22 Listing Removed — BRIGHT MLS
- 2018-01-25 Relisted — SJSRMLS
- 2018-01-24 Price Changed $98,500 BRIGHT MLS
- 2018-01-17 Listing Removed — SJSRMLS
- 2017-11-08 Price Changed $98,500 SJSRMLS
- 2017-10-27 Price Changed $132,000 SJSRMLS
- 2017-10-03 Price Changed $134,000 SJSRMLS
- 2017-09-21 Listed $134,000 BRIGHT MLS
- 2017-09-02 Listed $135,000 SJSRMLS
- 2016-07-22 Sold (MLS) $41,500 SJSRMLS
- 2016-07-08 Contingent — SJSRMLS
- 2016-06-29 Listed $35,800 SJSRMLS
- 2013-08-01 Listing Removed — SJSRMLS
- 2013-03-18 Listed $89,900 SJSRMLS
Property tax history
+3.5%/yrLatest (2025): $5,373 · +9.5% YoY. Source: county tax records.
Cash-flow waterfall
monthlySold comps — $/sqft
last 12 mo · ≤1 miLoading sold comps…