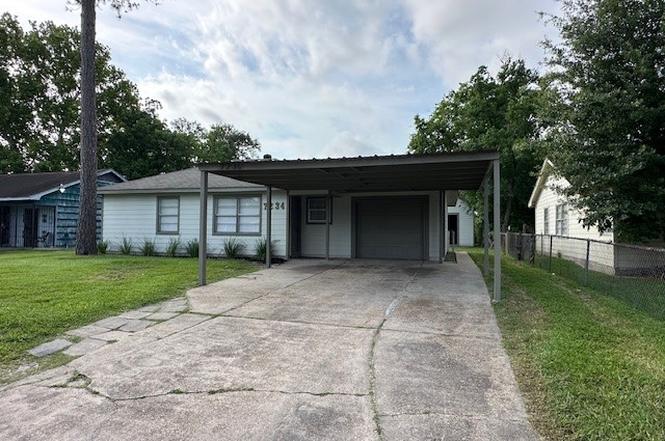
7234 Boggess Rd · Houston, TX
Flood risk 3/10 · Minor
- FEMA flood zone
- X (unshaded)
- Chance of flooding over 30 yrs
- 0.2%
- Est. flood insurance / yr
- $507 – $1,088
Fire risk 2/10 · Minimal
- Est. fire insurance / yr
- $1,222 – $2,270
Heat risk 9/10 · Severe
- Hot days now (above 110°F)
- 7 days/yr
- Hot days in 30 yrs
- 24 days/yr
Wind risk 9/10 · Severe
- Chance of severe wind over 30 yrs
- 99.0%
Air-quality risk 3/10 · Minor
- Unhealthy air days now
- 3 days/yr
- Unhealthy air days in 30 yrs
- 3 days/yr
Risk factors via First Street. Map © Google.
Why this score? — see what drove the C- grade
The composite is a weighted blend of 9 inputs, each scored 0–100. Each bar is that input's sub-score; the figure is the points it added to the 100-point composite (weight × sub-score).
- Cash flow +15.2/30.0
- Appreciation +9.3/10.0
- ARV discount +7.5/15.0
- DSCR +4.7/10.0
- 1% rule +4.6/10.0
- Livability +3.7/5.0
- Schools +2.7/10.0
- Rent growth +2.6/5.0
- Condition / age +2.5/5.0
$168,000
🖨 Deal sheet (PDF) 📄 Offer letter ✓ Due diligence
Listing remarks
Nicely renovated 3-bedroom 1-bath with updated finishes and a garage.
Key facts
- 7,200 sq ft lot
- Garage
- Built 1953
Neighborhood map
What this means for you Summary
Snapshot
- This is a 3-bed/1.0-bath single-family listed at $168k.
Deal economics
- At list price, monthly cash flow is $58 ($700/yr) — positive.
- The deal already cash-flows at list — no discount required.
- To meet the 1% rule (rent ≥ 1% of price), the offer needs to be $162k (3.8% below list).
- Recommended offer: $148k (12.0% below list) — sets the bar for market timing.
Location & tenants
- Location reads 74/100 on livability (#184 in TX, #4,771 nationally) — a middle-class / working-renter tenant base. Strengths: amenities A+, cost of living A+, housing A+; Watch: crime F.
- Houston ISD (urban): math 27% / reading 35% proficiency, ranked #593 of 826 in TX (top 72%) — families likely to look elsewhere, expect single-tenant / working-renter base with shorter leases; 71% free/reduced lunch — lower-income household profile, screen leases tightly.
- Zoned schools: Shadydale El (math 11% / reading 20%, grade F, #3,990 of 4,322 statewide, top 93%, 631 students, 95% FRL); Forest Brook Middle (math 12% / reading 14%, grade F, #1,609 of 1,662 statewide, top 97%, 613 students, 98% FRL); North Forest H S (math 13% / reading 18%, grade F, #1,505 of 1,632 statewide, top 92%, 974 students, 97% FRL) — zoned schools average 97% FRL vs 71% district-wide (26 pts higher); higher-poverty schools than district average — tighter screening recommended.
- Zoned-school proficiency averages 15% at this address vs 31% district-wide (-16 pts) — the specific schools serving this property underperform the Houston ISD average; the district grade overstates school quality for this exact location.
- Market conditions: Rents flat; 376 active listings in the ZIP; 26 comparable units currently listed for rent nearby; rentals at typical pace (median 27d on market — plan ~3-4 weeks tenant-placement turnaround); 42% of comp listings sitting > 30 days — soft ceiling on asking rent; 29,883 units permitted in Harris County in 2024 (8,621 in 5+ unit buildings).
Forward outlook
- In year one you build about $16k of equity ($1k loan paydown + $15k appreciation (8.7% local appreciation)).
- Harris County population projected at +47% by 2050 — long-run rental-demand tailwind backs the buy-and-hold thesis.
- At projected returns (8.7% appreciation + 0.4% rent growth), your $47k cash investment doubles in ~3 years — after that, you're playing with house money.
- By year 3, paydown + projected appreciation supports a ~$39k cash-out refi (75% LTV) — recoverable capital for the next deal without selling this one.
Negotiation context
- It's been on market 150 days — a 12% lower offer ($148k) is reasonable based on typical stale-listing flexibility.
- 2 sale attempts since 5y ago; this cycle's ask has dropped $12k (7%) from the opening price — seller is motivated, your offer sets the floor, not the list.
Risks & watch-outs
- Watch-outs: built in 1953 — expect roof / HVAC / electrical / plumbing capex.
- Climate carrying-cost: severe wind risk, 99% chance of damaging wind over 30y; extreme-heat days projected 7→24/yr by 2055 (HVAC capex compounding) — expect insurance premiums to compound above CPI over the hold.
Questions for the listing agent
- It's been on market 150 days. Have you received any prior offers? Is the seller open to a 12% concession, seller financing, or rate buy-down credit?
- Built in 1953 — when were the roof, HVAC, electrical panel, plumbing, and water heater last replaced?
- Why hasn't it sold? Are there any deal-killer items the seller is aware of (foundation, flood, title, zoning, code violations)?
- Is there a deadline driving the sale (1031 exchange, divorce, estate, relocation)? That informs how much negotiation room exists.
- Schools are D-rated, which usually means shorter tenancies and higher turnover. Who's the typical renter profile here, and what's been the actual vacancy rate?
- Crime grade is F in this area — have there been break-ins, vandalism, or insurance claims at this property in the last 3 years? What carrier currently insures it and at what premium?
- What's the average days-on-market for RENTAL listings here right now (not sales)? A rising rental-DOM trend means longer vacancies and softer asking-rent achievability than the comps imply.
- What's the recent tenant-quality profile in this submarket — average credit score on applications, eviction rate, late-payment / NSF rate, and stable-employment percentage? A property-management company in the area should have these aggregated.
- How much new for-sale + rental construction is in the pipeline within 1–3 miles? Heavy new supply typically softens prices + rents 12–24 months out; constrained supply supports both.
Investment metrics
- 1% rule
- 0.96% ✗
- Cap rate
- 6.71%
- Cash-on-cash
- 1.49%
- DSCR
- 1.07
- GRM
- 8.7
CMA / ARV
- ARV (on-the-fly)
- $168,096
- Comps found
- 12
Show comp detail 12 sales within ~0.75 mi
| Address | Dist | Beds/Ba | Sqft | Sold | Price | $/sf | Match |
|---|---|---|---|---|---|---|---|
| 7234 Boggess Rd | 0.00mi | 3/1.0 | 1,236 (0%) | 1mo | $168,000 | $136 | 99 |
| 7321 Wiley Rd | 0.17mi | 3/1.0 | 1,262 (+2%) | 2mo | $179,900 | $143 | 87 |
| 7261 Boggess Rd | 0.10mi | 2/1.0 (-1) | 1,176 (-5%) | 1mo | $110,000 | $94 | 82 |
| 10317 Kelburn Dr | 0.18mi | 3/1.0 | 1,107 (-10%) | 2mo | $175,000 | $158 | 72 |
| 6015 Langley Rd | 0.64mi | 3/1.0 | 1,245 (+1%) | 2mo | $95,000 | $76 | 67 |
| 7314 Bigwood St | 0.35mi | 3/1.0 | 1,122 (-9%) | 2mo | $90,000 | $80 | 66 |
| 7630 Yoe St | 0.47mi | 3/2.0 | 1,300 (+5%) | 2mo | $239,000 | $184 | 64 |
| 10507 Royal Oaks Dr | 0.44mi | 4/2.0 (+1) | 1,311 (+6%) | 2mo | $215,000 | $164 | 58 |
| 7421 Claiborne St | 0.48mi | 3/1.0 | 1,070 (-13%) | 0mo | $129,900 | $121 | 55 |
| 10329 Wicklowe St | 0.73mi | 3/2.0 | 1,194 (-3%) | 2mo | $149,000 | $125 | 55 |
| 7706 Lakewood Dr | 0.53mi | 4/1.5 (+1) | 1,084 (-12%) | 1mo | $209,000 | $193 | 47 |
| 7705 Yoe St | 0.52mi | 4/2.0 (+1) | 1,388 (+12%) | 3mo | $90,000 | $65 | 44 |
Match score weights: distance 35% · size 25% · config 20% · recency 20%. Top-matched comps best support the ARV.
Projected returns pro-forma
8.65% appreciation · 0.44% rent growth · sell at horizon
- IRR
- 21.5%
- Equity multiple
- 2.61×
- Total profit
- $75,959
- Equity at exit
- $135,118
- IRR
- 19.0%
- Equity multiple
- 5.48×
- Total profit
- $210,741
- Equity at exit
- $275,679
Cash invested: $47,040 (down + closing). Projections, not guarantees.
Landlord ↔ Tenant lean methodology
- Overall (STATE)
- 87 Strongly Landlord-Friendly
- State Texas
- 87 Strongly Landlord-Friendly · R+5
- County
- — inherits STATE
- City
- — inherits STATE
ZIP-level market 77016
- Home prices YoY
- 2.8%
- Rents YoY
- 0.4%
- Active inventory
- 376
- Price-to-rent
- 8.7×
Monthly cashflow live
- Estimated rent
- $1,616 high interval (Pro) →
- Mortgage (P&I)
- −$881
- Tax from tax record
- −$267 /mo · $3,203/yr
- Insurance
- −$70
- HOA
- −$0
- Vacancy / Maint / Mgmt
- −$339
- Net cashflow
- $58
Break-even live
Sensitivity live
| Price | -10% $153 | -5% $106 | +0% $58 | +5% $11 | +10% $-37 |
|---|---|---|---|---|---|
| Rent | -10% $-69 | -5% $-5 | +0% $58 | +5% $122 | +10% $186 |
| Rate | -1.0pp $143 | -0.5pp $101 | base $58 | +0.5pp $15 | +1.0pp $-29 |
UW: 25.0% down · 7.5% · 30yr · 1.5% tax · 5.0% vac · 8.0% maint · 8.0% mgmt
Financing live
Cash to close
- Down payment
- $42,000
- Closing costs
- $5,040
- Reserves months
- —
- Total cash needed
- —
Loan-product check · same deal, 3 products live
Conventional
25% down · 7.5% · 30yr
- Down + closing
- —
- Monthly P&I
- —
- Monthly cashflow
- —
- DSCR
- —
- Eligible?
- —
Personal DTI + credit; lowest rate.
DSCR
20% down · 8.5% · 30yr
- Down + closing
- —
- Monthly P&I
- —
- Monthly cashflow
- —
- DSCR
- —
- Eligible?
- —
No personal income docs; deal must DSCR.
Hard money
10% down · 12.0% · 12mo
- Down + closing
- —
- Monthly P&I
- —
- Monthly cashflow
- —
- DSCR
- —
- Eligible?
- —
Short-term bridge; refi at stabilization.
Rent comps 26 comps
| Address | Beds | Baths | Sqft | Rent | $/sqft | DOM | Units | Dist |
|---|---|---|---|---|---|---|---|---|
| 7252 Parker Rd Houston, TX | 3.0 | 1.0 | 916 | $1,650 | $1.80 | 45d | 1 | 0.14mi |
| 7176 Parker Rd Houston, TX | 4.0 | 2.0 | 1152 | $1,200 | $1.04 | 45d | 1 | 0.20mi |
| 7314 Saunders Rd Houston, TX | 4.0 | 2.0 | 1339 | $1,723 | $1.29 | 16d | 1 | 0.32mi |
| 10221 Bretton Dr Houston, TX | 3.0 | 1.0 | 1350 | $1,700 | $1.26 | 26d | 1 | 0.38mi |
| 7201 Hallshire Dr Unit 222 Houston, TX | 2.0 | 1.0 | 985 | $700 | $0.71 | 45d | 1 | 0.56mi |
| 7201 Hallshire Dr Houston, TX | 2.0 | 1.0 | 985 | $740 | $0.75 | 45d | 1 | 0.56mi |
| 7201 Hallshire Dr Unit 235 Houston, TX | 3.0 | 1.0 | 1100 | $850 | $0.77 | 45d | 1 | 0.56mi |
| 10314 Woodwick St Unit 1283919P Houston, TX | 3.0 | 2.5 | 1496 | $3,865 | $2.58 | 0d | 1 | 0.65mi |
| 7726 Spinet St Houston, TX | 4.0 | 2.0 | 1456 | $2,375 | $1.63 | 10d | 1 | 0.70mi |
| 10329 Wicklowe St Houston, TX | 3.0 | 2.0 | 1266 | $1,400 | $1.11 | 23d | 1 | 0.72mi |
| 10750 Nyla Spring St Houston, TX | 3.0 | 2.0 | 1500 | $1,975 | $1.32 | 21d | 1 | 0.82mi |
| 9410 Firnat St Unit A Houston, TX | 3.0 | 2.5 | 1500 | $1,900 | $1.27 | 1d | 1 | 0.84mi |
| 9410 Firnat St Unit B Houston, TX | 3.0 | 2.5 | 1500 | $1,900 | $1.27 | 45d | 1 | 0.84mi |
| 10708 Lavender Cotton Ln Houston, TX | 3.0 | 2.0 | 1406 | $2,150 | $1.53 | 45d | 1 | 1.07mi |
| 9550 N Wayside Dr Houston, TX | 1.0–3.0 | 1.0–2.0 | 896 | $1,399 | $1.56 | 3d | 5 | 1.11mi |
| 8003 Alpine Bearberry Dr Houston, TX | 3.0–4.0 | 2.0–2.5 | 1696 | $2,000 | $1.18 | 10d | 1 | 1.15mi |
| 6822 Leedale St Houston, TX | 3.0 | 1.0 | 978 | $1,500 | $1.53 | 45d | 1 | 1.23mi |
| 9422 Sandra St Unit B Houston, TX | 3.0 | 2.5 | 1461 | $1,875 | $1.28 | 45d | 1 | 1.25mi |
| 8122 Sterlingshire St Unit B Houston, TX | 3.0 | 2.0 | 1160 | $1,450 | $1.25 | 17d | 1 | 1.31mi |
| 8122 Sterlingshire St Unit A Houston, TX | 3.0 | 2.0 | 1160 | $1,525 | $1.31 | 17d | 1 | 1.31mi |
| 8126 Sterlingshire St Unit B Houston, TX | 3.0 | 2.0 | 1150 | $1,350 | $1.17 | 26d | 1 | 1.32mi |
| 6823 Hanley Ln Houston, TX | 3.0 | 2.0 | 1303 | $1,610 | $1.24 | 7d | 1 | 1.34mi |
| 8213 Bigwood St Unit A Houston, TX | 3.0 | 2.5 | 1150 | $1,595 | $1.39 | 45d | 1 | 1.36mi |
| 8006 Lynette St Houston, TX | 3.0 | 1.0 | 1400 | $1,475 | $1.05 | 26d | 1 | 1.42mi |
| 8302 Caddo Rd Houston, TX | 2.0 | 1.0 | 896 | $1,450 | $1.62 | 45d | 1 | 1.45mi |
| 7601 Springdale St Houston, TX | 3.0 | 2.0 | 1224 | $1,200 | $0.98 | 17d | 1 | 1.46mi |
Listing history 11 events
-
2026-03-16status Pending
-
2026-02-05price $168,000
-
2025-10-17$180,000 Active
-
2021-03-08soldstatus
-
2021-02-26soldstatus Sold
-
2021-02-24status Pending
-
2021-02-22$158,500 Active
-
2020-10-27soldstatus
-
2020-10-19soldstatus
-
2020-09-17soldstatus
-
1989-05-19soldstatus
ⓘ Source: listings_history table (triggers on properties + properties_extension) + one-shot
backfill from property_details.listing_events for pre-trigger history.
Tax reassessment forecast TX · Resets to sale price
- Current annual tax
- $3,203 · $267/mo
- Projected year-2 tax
- $3,203 · $267/mo
- Expected delta
- $0/yr ($0/mo · 0.0%)
ⓘ Screening estimate from a state-policy table — verify with the county assessor before closing.
Climate risk First Street
- Flood 3/10 Moderate FEMA zone X (unshaded) · 20% chance over 30 yrs
- Wildfire 2/10 Low
- Heat 9/10 Extreme 7 d/yr ≥110°F today · 24 d/yr by 30 yrs out
- Wind 9/10 Extreme 99% chance of damaging wind over 30 yrs
- Air quality 3/10 Moderate 3 unhealthy d/yr today · 3 by 30 yrs out
Nearby sold comps map
Loading sold comps map…
Walkable amenities ~0.75 mi
Loading nearby amenities…
Taxation est. · year 1
- Rental income
- $19,387
- − Mortgage interest
- −$9,411
- − Property taxes
- −$3,203
- − Insurance
- −$840
- − Repairs & maintenance
- −$1,551
- − Management
- −$1,551
- − Depreciation
- −$4,887
- Taxable loss
- −$2,056
- Est. tax savings @ 24.0%
- +$494
- After-tax cash flow
- $1,194/yr
For passive investors: Depreciation is non-cash, so a rental often shows a tax loss while cash-flowing — sheltering income. Rental losses are passive: they offset passive income freely, and up to $25,000/yr can offset ordinary (W-2) income if you actively participate and your MAGI is under $100k (phasing out to $0 by $150k); unused losses carry forward. On sale, claimed depreciation is recaptured at up to 25%, and gains may owe capital-gains tax (a 1031 exchange can defer both). Figures are a year-1 estimate at your 24.0% rate — not tax advice; consult a CPA.
Schools (NCES district)
- District
- Houston ISD
- NCES district ID
- 4823640
- Math proficiency
- 27% ▼ -18.00%
- Reading proficiency
- 35% ▼ -6.00%
- Median HH income
- $46,054
- Composite
- 26.63/100
- National rank
- #7173
- State rank
- #593 of 826 in TX
Livability — Houston
- Score
- 74/100
- State rank
- #184
- US rank
- #4771
Category grades
Schools grade is shown separately in the Schools card above.
Census & demographics
- Census place
- Houston, TX
- County
- Harris County · 4,702,590 people
- City population
- 3,226,434
- Metro
- Houston-The Woodlands-Sugar Land, TX
- Population (ZIP)
- 29,841
- Household income
- $47,677
- Rent vs Own
- Severe rent burden
- 1297.0
Population outlook (Harris County) Hauer SSP2
- Today (2025)
- 5,571,493 people
- By 2030
- 6,089,821 · +9.3%
- By 2040
- 7,142,806 · +28.2%
- By 2050
- 8,185,864 · +46.9%
- By 2075
- 10,574,329 · +89.8%
- By 2100
- 12,109,958 · +117.4%
Race, ethnicity, and origin ACS 2023
- Neighborhood character
- Majority Black (56%)
- Race & ethnicity
- Black 56% Hispanic / Latino 42% Two or more races 28%
- Hispanic origin (detail)
- Mexican 34%
- Foreign-born
- 18% · Canada
- Languages at home
- 61% English-only · Spanish 37%
Political lean MEDSL · Harris
- 2024 margin
- Lean D (+5.5) · D 52.0% · R 46.4% · Other 1.6%
- 2008→2024 swing
- +3.9pp toward D · 2008: 1.6pp · 2024: 5.5pp
- All cycles
- 2024: D+5.5 2020: D+13.3 2016: D+12.4 2012: D+0.1 2008: D+1.6
Not yet ingested
- Civics
- —
Market trends
- HPI YoY
- ▲ 8.65%
- Current HPI
- 315.6765
- Rent YoY
- ▲ 0.44%
- Metro
- Houston-The Woodlands-Sugar Land, TX
- State GDP YoY
- ▲ 3.95%
- F500 in state
- 110
Industry mix (Fortune 500 HQ in TX)
| Industry | F500 HQs | Revenue |
|---|---|---|
| Energy | 16 | $1,198B |
|
||
| Technology | 5 | $198B |
|
||
| Engineering / Construction | 4 | $72B |
|
||
| Energy Services | 3 | $60B |
|
||
| Utilities | 3 | $41B |
|
||
| Healthcare | 2 | $330B |
|
||
Price history
+6.0% since first listed11 events — show timeline
- 2026-03-16 Pending — HARMLS
- 2026-02-05 Price Changed $168,000 HARMLS
- 2025-10-17 Listed $180,000 HARMLS
- 2021-03-08 Sold (Public Records) — Public Records
- 2021-02-26 Sold (MLS) — HARMLS
- 2021-02-24 Pending — HARMLS
- 2021-02-22 Listed $158,500 HARMLS
- 2020-10-27 Sold (Public Records) — Public Records
- 2020-10-19 Sold (Public Records) — Public Records
- 2020-09-17 Sold (Public Records) — Public Records
- 1989-05-19 Sold (Public Records) — Public Records
Property tax history
+10.4%/yrLatest (2025): $3,203 · +6.2% YoY. Source: county tax records.
Cash-flow waterfall
monthlySold comps — $/sqft
last 12 mo · ≤1 miLoading sold comps…