 🏗️ New Construction
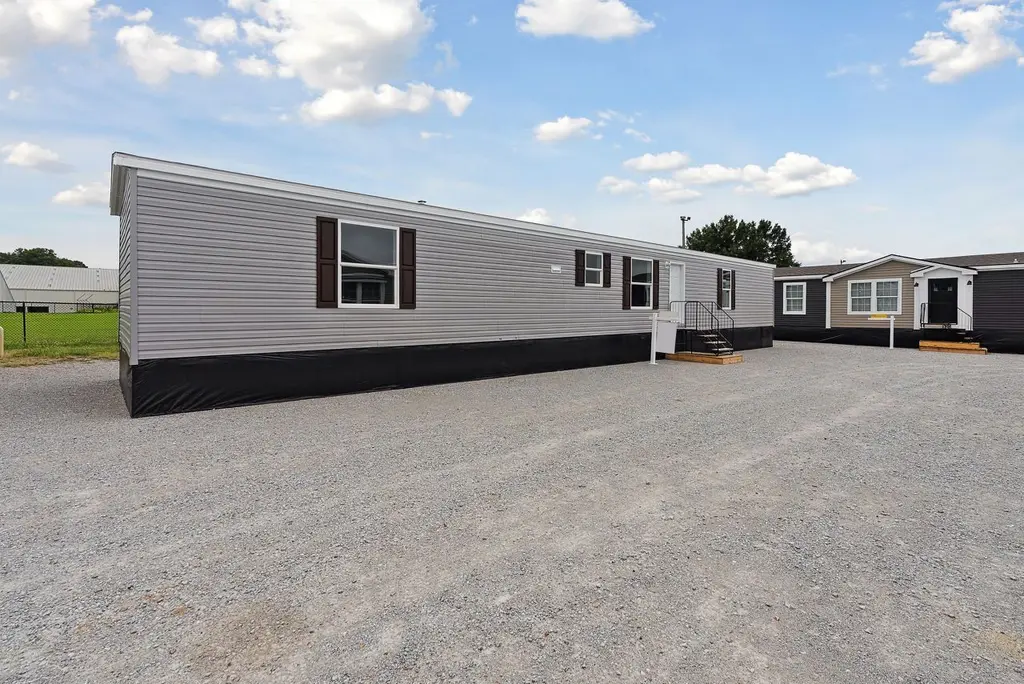
Belmont (Pin Oak) Plan · O'Fallon, MO
Flood risk No data
- FEMA flood zone
- —
- Chance of flooding over 30 yrs
- —
- Est. flood insurance / yr
- —
Fire risk No data
- Est. fire insurance / yr
- —
Heat risk No data
- Hot days now (above threshold)
- —
- Hot days in 30 yrs
- —
Wind risk No data
- Chance of severe wind over 30 yrs
- —
Air-quality risk No data
- Unhealthy air days now
- —
- Unhealthy air days in 30 yrs
- —
Risk factors via First Street. Map © Google.
Why this score? — see what drove the D grade
The composite is a weighted blend of 9 inputs, each scored 0–100. Each bar is that input's sub-score; the figure is the points it added to the 100-point composite (weight × sub-score).
- Cash flow +9.2/30.0
- 1% rule +8.8/10.0
- ARV discount +7.5/15.0
- Schools +4.3/10.0
- Condition / age +4.0/5.0
- Rent growth +2.9/5.0
- DSCR +2.6/10.0
- Livability +2.5/5.0
- Appreciation +0.0/10.0
$75,995
🖨 Deal sheet (PDF) 📄 Offer letter ✓ Due diligence
Listing remarks MLS
The Belmont offers a smart, spacious layout designed for comfortable everyday living. This thoughtfully designed home features 3 bedrooms and 2 full baths, providing plenty of room for family and guests. At the heart of the home, you'll find a beautiful, well-appointed kitchen that flows seamlessly into an expansive living area with extended length-perfect for entertaining, relaxing, or creating flexible spaces to fit your lifestyle. With its open design and generous proportions, the Belmont delivers both functionality and style in a home that truly feels inviting.
Key facts
- Listed 122 days
Neighborhood map
What this means for you Summary
Snapshot
- This is a 3-bed/2.0-bath manufactured listed at $76k. Condition is rated good.
Deal economics
- At list price, monthly cash flow is $-100 ($-1k/yr) — negative.
- The deal already cash-flows at list — no discount required.
- Meets the 1% rule at list price ($2k rent vs $76k).
- Recommended offer: $67k (12.0% below list) — sets the bar for market timing.
- Cap rate 5.4% vs local median 3.2% in O'Fallon — top-decile yield for the area; either an underpriced asset or a hidden risk that comps aren't pricing in. Stress-test before assuming the spread holds.
Location & tenants
- Location reads: area grade D — affects rentability + tenant quality, not the cash-flow math above.
- Wentzville R-IV (suburban): math 44% / reading 52% proficiency, ranked #32 of 324 in MO (top 10%) — families likely to look elsewhere, expect single-tenant / working-renter base with shorter leases; only 18% free/reduced lunch — higher-income household profile.
- Market conditions: Rents rising (+1.6%/yr); 374 active listings in the ZIP; 21 comparable units currently listed for rent nearby; rentals at typical pace (median 17d on market — plan ~3-4 weeks tenant-placement turnaround); high-income renter base; 2,021 units permitted in St. Charles County in 2024 (568 in 5+ unit buildings).
- This rent is only 18% of the median local income ($124k/yr) — well below the 30% rent-burden line; pricing power to push rent on renewal without tenant pushback.
Forward outlook
- Local home prices are declining (-3.0%/yr); year-one equity from $924 of loan paydown is wiped out by about $4k of value loss. Plan a longer hold.
- St. Charles County population projected at +22% by 2050 — long-run rental-demand tailwind backs the buy-and-hold thesis.
Negotiation context
- It's been on market 123 days — a 12% lower offer ($67k) is reasonable based on typical stale-listing flexibility.
Risks & watch-outs
- Watch-outs: property tax is 2.6% of price; HOA is 34% of rent.
Questions for the listing agent
- What do current leases actually rent for vs. the listed asking? Can we see a recent rent roll and the last 12 months of T-12 income?
- It's been on market 123 days. Have you received any prior offers? Is the seller open to a 12% concession, seller financing, or rate buy-down credit?
- Property tax is high relative to price — has the assessment been appealed recently, and will the sale trigger a re-assessment?
- What does the HOA fee cover, when was the last increase, and are there any pending special assessments or reserve-fund shortfalls?
- Why hasn't it sold? Are there any deal-killer items the seller is aware of (foundation, flood, title, zoning, code violations)?
- Is there a deadline driving the sale (1031 exchange, divorce, estate, relocation)? That informs how much negotiation room exists.
- The area grade is low — what's the realistic commute time and amenity access for the typical tenant pool here? Any planned neighborhood developments (good or bad) we should know about?
- What's the average days-on-market for RENTAL listings here right now (not sales)? A rising rental-DOM trend means longer vacancies and softer asking-rent achievability than the comps imply.
- What's the recent tenant-quality profile in this submarket — average credit score on applications, eviction rate, late-payment / NSF rate, and stable-employment percentage? A property-management company in the area should have these aggregated.
- How much new for-sale + rental construction is in the pipeline within 1–3 miles? Heavy new supply typically softens prices + rents 12–24 months out; constrained supply supports both.
Investment metrics
- 1% rule
- 1.38% ✓
- Cap rate
- 5.40%
- Cash-on-cash
- -3.20%
- DSCR
- 0.86
- GRM
- 6.1
CMA / ARV
- ARV (on-the-fly)
- $133,616
- Comps found
- 1
Show comp detail 1 sale within ~0.75 mi
| Address | Dist | Beds/Ba | Sqft | Sold | Price | $/sf | Match |
|---|---|---|---|---|---|---|---|
| 472 Cardow Dr | 0.30mi | 2/2.0 (-1) | 1,340 (+12%) | 15mo | $150,000 | $112 | 48 |
Match score weights: distance 35% · size 25% · config 20% · recency 20%. Top-matched comps best support the ARV.
Projected returns pro-forma
-3.0% appreciation · 1.59% rent growth · sell at horizon
- IRR
- -24.0%
- Equity multiple
- 0.19×
- Total profit
- $-30,169
- Equity at exit
- $19,923
- IRR
- -26.6%
- Equity multiple
- -0.15×
- Total profit
- $-43,039
- Equity at exit
- $11,553
Cash invested: $37,412 (down + closing). Projections, not guarantees.
Landlord ↔ Tenant lean methodology
- Overall (STATE)
- 81 Strongly Landlord-Friendly
- State Missouri
- 81 Strongly Landlord-Friendly · R+10
- County
- — inherits STATE
- City
- — inherits STATE
ZIP-level market 63368
- Home prices YoY
- -20.7%
- Rents YoY
- 1.6%
- Active inventory
- 374
- Price-to-rent
- 3.4×
Monthly cashflow live
- Estimated rent
- $1,840 high interval (Pro) →
- Mortgage (P&I)
- −$701
- Tax est. 1.5%
- −$167 /mo · $2,004/yr
- Insurance
- −$56
- HOA
- −$630
- Vacancy / Maint / Mgmt
- −$386
- Net cashflow
- $-100
Break-even live
Sensitivity live
| Price | -10% $-7 | -5% $-54 | +0% $-100 | +5% $-146 | +10% $-192 |
|---|---|---|---|---|---|
| Rent | -10% $-245 | -5% $-173 | +0% $-100 | +5% $-27 | +10% $46 |
| Rate | -1.0pp $-33 | -0.5pp $-66 | base $-100 | +0.5pp $-134 | +1.0pp $-170 |
UW: 25.0% down · 7.5% · 30yr · 1.5% tax · 5.0% vac · 8.0% maint · 8.0% mgmt
Financing live
Cash to close
- Down payment
- $33,404
- Closing costs
- $4,008
- Reserves months
- —
- Total cash needed
- —
Loan-product check · same deal, 3 products live
Conventional
25% down · 7.5% · 30yr
- Down + closing
- —
- Monthly P&I
- —
- Monthly cashflow
- —
- DSCR
- —
- Eligible?
- —
Personal DTI + credit; lowest rate.
DSCR
20% down · 8.5% · 30yr
- Down + closing
- —
- Monthly P&I
- —
- Monthly cashflow
- —
- DSCR
- —
- Eligible?
- —
No personal income docs; deal must DSCR.
Hard money
10% down · 12.0% · 12mo
- Down + closing
- —
- Monthly P&I
- —
- Monthly cashflow
- —
- DSCR
- —
- Eligible?
- —
Short-term bridge; refi at stabilization.
Rent comps 21 comps
| Address | Beds | Baths | Sqft | Rent | $/sqft | DOM | Units | Dist |
|---|---|---|---|---|---|---|---|---|
| 440 Wild Oak Dr O Fallon, MO | 2.0 | 2.5 | 1214 | $1,625 | $1.34 | 12d | 1 | 0.21mi |
| 314 Newbridge Way O Fallon, MO | 3.0 | 2.5 | 1363 | $2,100 | $1.54 | 3d | 1 | 0.21mi |
| 13300 Spring Creek Ln O Fallon, MO | 2.0 | 2.0 | 1018 | $1,450 | $1.42 | 8d | 1 | 0.31mi |
| 60 Mora Blvd O Fallon, MO | 3.0 | 2.5 | 1363 | $2,150 | $1.58 | 24d | 1 | 0.35mi |
| 9201 Spring Creek Ln Unit 9201 O'Fallon, MO | 2.0 | 2.0 | 1014 | $1,600 | $1.58 | 5d | 1 | 0.37mi |
| 9200 Spring Creek Ln O Fallon, MO | 2.0 | 2.0 | 1014 | $1,450 | $1.43 | 44d | 1 | 0.37mi |
| 6303 Spring River Dr O Fallon, MO | 2.0 | 2.0 | 1014 | $1,697 | $1.67 | 44d | 1 | 0.57mi |
| 4103 Spring River Dr Unit 4103 O'Fallon, MO | 2.0 | 2.0 | 1054 | $1,600 | $1.52 | 17d | 1 | 0.59mi |
| 234 Harmony Meadows Ct O Fallon, MO | 2.0 | 2.0 | 1000 | $1,500 | $1.50 | 24d | 1 | 0.64mi |
| 214 Harmony Meadows Ct O Fallon, MO | 2.0 | 2.0 | 1000 | $1,600 | $1.60 | 18d | 1 | 0.64mi |
| 284 Stonewall Creek Dr O Fallon, MO | 2.0 | 2.0 | 1075 | $1,575 | $1.47 | 44d | 1 | 0.89mi |
| 101 Lemon Dr Lake St Louis, MO | 1.0–3.0 | 1.0–2.0 | 1002 | $2,228 | $2.22 | 2d | 16 | 0.90mi |
| 55 Timber Oaks Trl O'Fallon, MO | 2.0 | 2.0 | 985 | $1,600 | $1.62 | 44d | 1 | 0.93mi |
| 104 Shire Dr Lake Saint Louis, MO | 3.0 | 2.5 | 1462 | $2,781 | $1.90 | 5d | 1 | 1.37mi |
| 100 Big River Dr Lake St Louis, MO | 1.0–4.0 | 1.0–2.5 | 1349 | $2,717 | $2.01 | 44d | 1 | 1.39mi |
| 4133 Welsh Dr Lake Saint Louis, MO | 2.0 | 2.0 | 1130 | $1,600 | $1.42 | 44d | 1 | 1.44mi |
| 1124 Welsh Dr Lake Saint Louis, MO | 2.0 | 2.0 | 1130 | $1,495 | $1.32 | 44d | 1 | 1.45mi |
| 5114 Welsh Dr Lake St Louis, MO | 2.0 | 2.0 | 1114 | $1,450 | $1.30 | 15d | 1 | 1.46mi |
| 5114 Welsh Dr Lake Saint Louis, MO | 2.0 | 2.0 | 1114 | $1,450 | $1.30 | 11d | 1 | 1.46mi |
| 5123 Welsh Dr Lake Saint Louis, MO | 2.0 | 2.0 | 1130 | $1,425 | $1.26 | 8d | 1 | 1.46mi |
| 603 Country Village Dr Lake Saint Louis, MO | 2.0 | 2.0 | 1245 | $1,825 | $1.47 | 11d | 1 | 1.47mi |
HOA detail
- Monthly dues
- $630 · $7,560/yr
Listing history 15 events
-
2026-06-18days on market $75,995 Active 123 DOM
-
2026-06-17days on market $75,995 Active 122 DOM
-
2026-06-16days on market $75,995 Active 121 DOM
-
2026-06-15days on market $75,995 Active 120 DOM
-
2026-06-13days on market $75,995 Active 118 DOM
-
2026-06-13days on market $75,995 Active 117 DOM
-
2026-06-09days on market $75,995 Active 114 DOM
-
2026-06-08days on market $75,995 Active 113 DOM
-
2026-06-08days on market $75,995 Active 112 DOM
-
2026-06-05days on market $75,995 Active 109 DOM
-
2026-06-03days on market $75,995 Active 108 DOM
-
2026-06-02days on market $75,995 Active 107 DOM
-
2026-06-01days on market $75,995 Active 106 DOM
-
2026-05-31days on market $75,995 Active 105 DOM
-
2026-02-16$75,995 Active 571-char remark
Show marketing remark (571 chars)
The Belmont offers a smart, spacious layout designed for comfortable everyday living. This thoughtfully designed home features 3 bedrooms and 2 full baths, providing plenty of room for family and guests. At the heart of the home, you'll find a beautiful, well-appointed kitchen that flows seamlessly into an expansive living area with extended length-perfect for entertaining, relaxing, or creating flexible spaces to fit your lifestyle. With its open design and generous proportions, the Belmont delivers both functionality and style in a home that truly feels inviting.
ⓘ Source: listings_history table (triggers on properties + properties_extension) + one-shot
backfill from property_details.listing_events for pre-trigger history.
Nearby sold comps map
Loading sold comps map…
Walkable amenities ~0.75 mi
Loading nearby amenities…
Taxation est. · year 1
- Rental income
- $22,080
- − Mortgage interest
- −$7,485
- − Property taxes
- −$2,004
- − Insurance
- −$668
- − Repairs & maintenance
- −$1,766
- − Management
- −$1,766
- − HOA
- −$7,560
- − Depreciation
- −$3,887
- Taxable loss
- −$3,057
- Est. tax savings @ 24.0%
- +$734
- After-tax cash flow
- $-464/yr
For passive investors: Depreciation is non-cash, so a rental often shows a tax loss while cash-flowing — sheltering income. Rental losses are passive: they offset passive income freely, and up to $25,000/yr can offset ordinary (W-2) income if you actively participate and your MAGI is under $100k (phasing out to $0 by $150k); unused losses carry forward. On sale, claimed depreciation is recaptured at up to 25%, and gains may owe capital-gains tax (a 1031 exchange can defer both). Figures are a year-1 estimate at your 24.0% rate — not tax advice; consult a CPA.
Condition & rehab AI · 2 photos
This manufactured home is in good condition with a smart, spacious layout. It offers a well-maintained interior and exterior, making it a solid investment opportunity.
Value-add opportunities
- Both Painting the exterior and interior walls — Fresh paint can enhance curb appeal and interior aesthetics.
- Both Landscaping improvements — Enhanced landscaping can improve curb appeal and attract potential buyers/tenants.
- Both Add a small front porch or patio — Can increase the home's appeal and functionality for both resale and rental purposes.
Renovation cost estimate screening
Value-add ROI direction
- Both Painting the exterior and interior walls — Fresh paint can enhance curb appeal and interior aesthetics. ↑
- Both Landscaping improvements — Enhanced landscaping can improve curb appeal and attract potential buyers/tenants. ↑
- Both Add a small front porch or patio — Can increase the home's appeal and functionality for both resale and rental purposes. ↑
ⓘ Cost ranges are severity-bucket heuristics (US national rule-of-thumb). Get contractor quotes + a written scope before underwriting a rehab budget.
Schools (NCES district)
- District
- Wentzville R-IV
- NCES district ID
- 2931650
- Math proficiency
- 44% ▼ -9.00%
- Reading proficiency
- 52% ▼ -7.00%
- Median HH income
- $74,961
- Composite
- 43.49/100
- National rank
- #2994
- State rank
- #32 of 324 in MO
Livability — O'Fallon
No livability data for this city. (Only ~50 U.S. cities are tracked.)
Census & demographics
- Census place
- O'Fallon, MO
- County
- Saint Charles County · 399,703 people
- City population
- 45,862
- Metro
- St. Louis, MO-IL
- Population (ZIP)
- 46,966
- Household income
- $124,297
- Rent vs Own
- Severe rent burden
- 538.0
Population outlook (St. Charles County) Hauer SSP2
- Today (2025)
- 437,857 people
- By 2030
- 461,707 · +5.4%
- By 2040
- 503,222 · +14.9%
- By 2050
- 534,684 · +22.1%
- By 2075
- 597,047 · +36.4%
- By 2100
- 609,682 · +39.2%
Race, ethnicity, and origin ACS 2023
- Neighborhood character
- Predominantly White (84%)
- Race & ethnicity
- White 84% Asian 5% Two or more races 5% Black 4% Hispanic / Latino 3%
- Common ancestry
- Romanian 4% Lithuanian 3% Italian 2%
- Foreign-born
- 6% · Canada, China
- Languages at home
- 93% English-only · Other Asian/Pacific 2% Spanish 2% Other Indo-European 2%
Political lean MEDSL · St. Charles
- 2024 margin
- R (+17.0) · D 40.8% · R 57.8% · Other 1.4%
- 2008→2024 swing
- -7.2pp toward R · 2008: -9.7pp · 2024: -17.0pp
- All cycles
- 2024: R+17.0 2020: R+17.5 2016: R+26.4 2012: R+21.0 2008: R+9.7
Not yet ingested
- Civics
- —
Market trends
- HPI YoY
- ▼ -57.32%
- Current HPI
- 219.7731
- Rent YoY
- ▲ 1.59%
- Metro
- St. Louis, MO-IL
- State GDP YoY
- ▲ 1.84%
- F500 in state
- 20
Industry mix (Fortune 500 HQ in MO)
| Industry | F500 HQs | Revenue |
|---|---|---|
| Healthcare | 1 | $163B |
|
||
| Insurance | 1 | $21B |
|
||
| Industrial Technology | 1 | $17B |
|
||
| Retail | 1 | $16B |
|
||
| Industrial Distribution | 1 | $10B |
|
||
| Utilities | 1 | $9B |
|
||
Price history
1 event — show timeline
- 2026-02-16 Listed $75,995 Zillow
Cash-flow waterfall
monthlySold comps — $/sqft
last 12 mo · ≤1 miLoading sold comps…