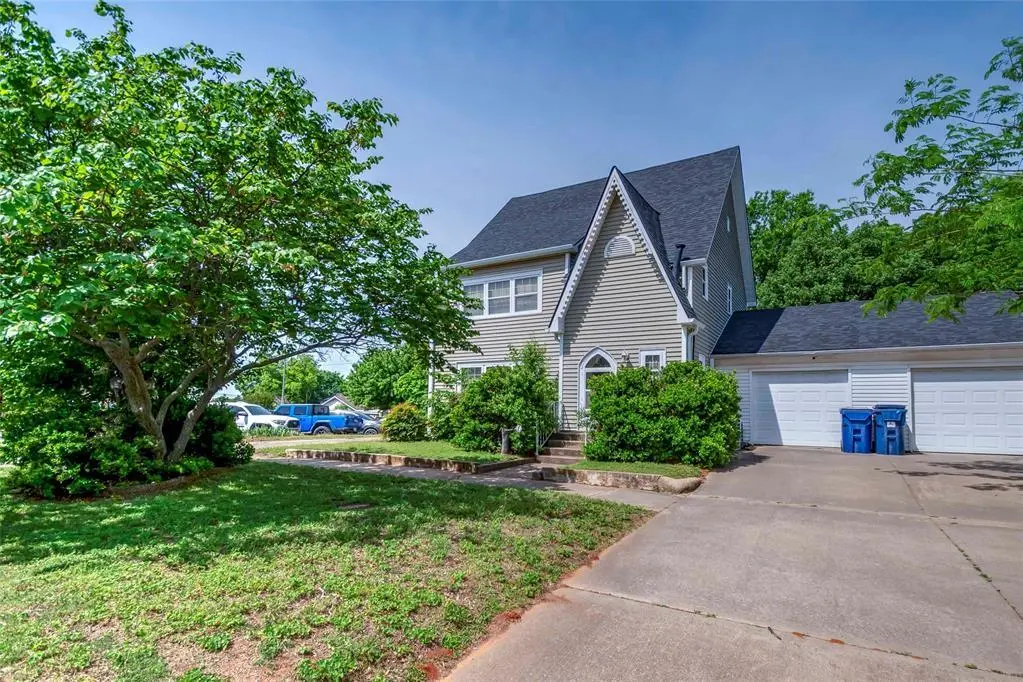
813 Steele Ave · Chandler, OK
Flood risk 1/10 · Minimal
- FEMA flood zone
- X (unshaded)
- Chance of flooding over 30 yrs
- 0.0%
- Est. flood insurance / yr
- $507 – $1,088
Fire risk 6/10 · Moderate
- Est. fire insurance / yr
- $2,463 – $4,575
Heat risk 6/10 · Moderate
- Hot days now (above 110°F)
- 7 days/yr
- Hot days in 30 yrs
- 19 days/yr
Wind risk 3/10 · Minor
- Chance of severe wind over 30 yrs
- 5.0%
Air-quality risk 2/10 · Minimal
- Unhealthy air days now
- 1 days/yr
- Unhealthy air days in 30 yrs
- 1 days/yr
Risk factors via First Street. Map © Google.
Why this score? — see what drove the C- grade
The composite is a weighted blend of 9 inputs, each scored 0–100. Each bar is that input's sub-score; the figure is the points it added to the 100-point composite (weight × sub-score).
- ARV discount +15.0/15.0
- Cash flow +10.1/30.0
- Appreciation +10.0/10.0
- Livability +3.2/5.0
- Schools +3.0/10.0
- DSCR +2.9/10.0
- Rent growth +2.5/5.0
- Condition / age +2.5/5.0
- 1% rule +2.0/10.0
$175,000
🖨 Deal sheet (PDF) 📄 Offer letter ✓ Due diligence
Listing remarks
Charming home situated on a desirable corner lot, offering 3 bedrooms, 2 bathrooms, and approximately 1,836 square feet of living space. This inviting property features beautiful wood flooring throughout and a spacious living room perfect for relaxing or entertaining. All bedrooms are located upstairs, providing added privacy and functionality. The home also includes an attached one-car garage and low-maintenance vinyl siding. Conveniently located near downtown Chandler, this property combines comfort, character, and accessibility—truly a must-see!
Key facts
- 1,999 sq ft lot
- Garage
- Built 1930
Property features AI
Finance
- Financial info: Loan-qualified (assumable: no)
- HOA & community: No mandatory association dues
Exterior
- Parking: 1-car garage
- Home design: Single family residence; Two-story; Existing property
- Construction: Vinyl siding; Composition roof (roof year 2025); Conventional foundation; Homestead exempt
- Exterior features: Corner lot; No additional exterior features listed
Interior
- Kitchen: Electric range (free standing); Electric oven (free standing); Dishwasher
- Bedrooms: 3 bedrooms
- Flooring: Tile; Wood
- Bathrooms: 1 full bath; 1 half bath
- Interior features: Ceiling fan(s); Gas log fireplace
- Laundry & utility: Garage door lift
Neighborhood map
What this means for you Summary
Snapshot
- This is a 3-bed/2.0-bath single-family listed at $175k.
Deal economics
- At list price, monthly cash flow is $-103 ($-1k/yr) — negative.
- To cash-flow at today's rent, offer at most $157k (10.4% below list).
- To meet the 1% rule (rent ≥ 1% of price), the offer needs to be $122k (30.0% below list).
- Recommended offer: $122k (30.0% below list) — sets the bar for 1% rule.
- Cap rate 5.6% vs local median 2.8% in Chandler — top-decile yield for the area; either an underpriced asset or a hidden risk that comps aren't pricing in. Stress-test before assuming the spread holds.
Location & tenants
- Location reads 64/100 on livability (#171 in OK) — a middle-class / working-renter tenant base. Strengths: cost of living A+, housing A+; Watch: crime D, employment D, amenities F.
- Chandler (town): math 35% / reading 35% proficiency, ranked #36 of 270 in OK (top 13%) — families likely to look elsewhere, expect single-tenant / working-renter base with shorter leases.
- Zoned schools: Park Road Es (math 38% / reading 36%, grade F, #132 of 845 statewide, top 19%, 313 students, 0% FRL); Chandler Jhs (math 27% / reading 27%, grade F, #72 of 345 statewide, top 22%, 160 students, 0% FRL); Chandler Hs (math 47% / reading 52%, grade D, #9 of 447 statewide, top 2%, 335 students, 0% FRL) — zoned schools average 0% FRL vs 42% district-wide (42 pts lower); this property's tenant base skews higher-income than the district average.
- Market conditions: 122 active listings in the ZIP; 19 units permitted in Lincoln County in 2024 (0 in 5+ unit buildings).
Forward outlook
- In year one you build about $19k of equity ($1k loan paydown + $18k appreciation (10.0% local appreciation)).
- By year 2, paydown + projected appreciation supports a ~$30k cash-out refi (75% LTV) — recoverable capital for the next deal without selling this one.
Negotiation context
- Only 14 days on market — expect competitive offers; lowballing is unlikely to land.
- 3 sale attempts since 23y ago with the ask held roughly flat each time — persistent listings suggest the price (not the market) is what's stuck; bring a comps-based counter.
- Current owner paid $53k; list at $175k implies a 230% gain — meaningful room to come down on a strong offer.
Risks & watch-outs
- Watch-outs: built in 1930 — expect roof / HVAC / electrical / plumbing capex.
- Climate carrying-cost: major wildfire risk; extreme-heat days projected 7→19/yr by 2055 (HVAC capex compounding) — expect insurance premiums to compound above CPI over the hold.
Questions for the listing agent
- What do current leases actually rent for vs. the listed asking? Can we see a recent rent roll and the last 12 months of T-12 income?
- Built in 1930 — when were the roof, HVAC, electrical panel, plumbing, and water heater last replaced?
- Is there a deadline driving the sale (1031 exchange, divorce, estate, relocation)? That informs how much negotiation room exists.
- Schools are F-rated, which usually means shorter tenancies and higher turnover. Who's the typical renter profile here, and what's been the actual vacancy rate?
- Crime grade is D in this area — have there been break-ins, vandalism, or insurance claims at this property in the last 3 years? What carrier currently insures it and at what premium?
- What's the average days-on-market for RENTAL listings here right now (not sales)? A rising rental-DOM trend means longer vacancies and softer asking-rent achievability than the comps imply.
- What's the recent tenant-quality profile in this submarket — average credit score on applications, eviction rate, late-payment / NSF rate, and stable-employment percentage? A property-management company in the area should have these aggregated.
- How much new for-sale + rental construction is in the pipeline within 1–3 miles? Heavy new supply typically softens prices + rents 12–24 months out; constrained supply supports both.
Investment metrics
- 1% rule
- 0.70% ✗
- Cap rate
- 5.58%
- Cash-on-cash
- -2.53%
- DSCR
- 0.89
- GRM
- 11.9
CMA / ARV
- ARV (on-the-fly)
- $211,140
- Comps found
- 12
Show comp detail 12 sales within ~0.75 mi
| Address | Dist | Beds/Ba | Sqft | Sold | Price | $/sf | Match |
|---|---|---|---|---|---|---|---|
| 217 W 8th St | 0.04mi | 4/3.0 (+1) | 1,814 (-1%) | 12mo | $230,000 | $127 | 78 |
| 310 W 8th St | 0.10mi | 3/2.0 | 1,724 (-6%) | 10mo | $168,800 | $98 | 77 |
| 214 S Flynn Ave | 0.46mi | 3/2.0 | 1,746 (-5%) | 4mo | $180,000 | $103 | 67 |
| 209 Marshall Dr | 0.59mi | 3/2.0 | 1,880 (+2%) | 10mo | $130,000 | $69 | 60 |
| 515 Manvel Ave | 0.22mi | 3/3.0 | 1,646 (-10%) | 14mo | $190,000 | $115 | 57 |
| 420 E 12th St | 0.43mi | 3/1.5 | 1,647 (-10%) | 8mo | $85,000 | $52 | 54 |
| 116 Sunny Pl | 0.75mi | 3/2.5 | 1,803 (-2%) | 8mo | $210,000 | $116 | 53 |
| 709 S Dewey Ave | 0.43mi | 3/2.0 | 1,596 (-13%) | 8mo | $149,900 | $94 | 52 |
| 124 N Dewey Ave | 0.74mi | 3/2.0 | 1,652 (-10%) | 1mo | $220,000 | $133 | 48 |
| 138 Lee Ann Ln | 0.67mi | 3/2.0 | 1,632 (-11%) | 10mo | $238,000 | $146 | 42 |
| 221 S Price Ave | 0.43mi | 3/2.0 | 1,580 (-14%) | 18mo | $145,000 | $92 | 42 |
| 1108 Kimberly Dr | 0.72mi | 3/2.0 | 1,583 (-14%) | 9mo | $195,000 | $123 | 36 |
Match score weights: distance 35% · size 25% · config 20% · recency 20%. Top-matched comps best support the ARV.
Projected returns pro-forma
10.0% appreciation · 3.0% rent growth · sell at horizon
- IRR
- 22.5%
- Equity multiple
- 2.81×
- Total profit
- $88,658
- Equity at exit
- $157,654
- IRR
- 20.1%
- Equity multiple
- 6.43×
- Total profit
- $266,127
- Equity at exit
- $339,987
Cash invested: $49,000 (down + closing). Projections, not guarantees.
Landlord ↔ Tenant lean methodology
- Overall (STATE)
- 83 Strongly Landlord-Friendly
- State Oklahoma
- 83 Strongly Landlord-Friendly · R+20
- County
- — inherits STATE
- City
- — inherits STATE
ZIP-level market 74834
- Home prices YoY
- 19.9%
- Active inventory
- 122
- Price-to-rent
- 11.9×
Monthly cashflow live
- Estimated rent
- $1,224 medium interval (Pro) →
- Mortgage (P&I)
- −$918
- Tax from tax record
- −$80 /mo · $959/yr
- Insurance
- −$73
- HOA
- −$0
- Vacancy / Maint / Mgmt
- −$257
- Net cashflow
- $-103
Break-even live
Sensitivity live
| Price | -10% $-4 | -5% $-54 | +0% $-103 | +5% $-153 | +10% $-202 |
|---|---|---|---|---|---|
| Rent | -10% $-200 | -5% $-152 | +0% $-103 | +5% $-55 | +10% $-7 |
| Rate | -1.0pp $-15 | -0.5pp $-59 | base $-103 | +0.5pp $-149 | +1.0pp $-195 |
UW: 25.0% down · 7.5% · 30yr · 1.5% tax · 5.0% vac · 8.0% maint · 8.0% mgmt
Financing live
Cash to close
- Down payment
- $43,750
- Closing costs
- $5,250
- Reserves months
- —
- Total cash needed
- —
Loan-product check · same deal, 3 products live
Conventional
25% down · 7.5% · 30yr
- Down + closing
- —
- Monthly P&I
- —
- Monthly cashflow
- —
- DSCR
- —
- Eligible?
- —
Personal DTI + credit; lowest rate.
DSCR
20% down · 8.5% · 30yr
- Down + closing
- —
- Monthly P&I
- —
- Monthly cashflow
- —
- DSCR
- —
- Eligible?
- —
No personal income docs; deal must DSCR.
Hard money
10% down · 12.0% · 12mo
- Down + closing
- —
- Monthly P&I
- —
- Monthly cashflow
- —
- DSCR
- —
- Eligible?
- —
Short-term bridge; refi at stabilization.
Listing history 8 events
-
2026-05-19status Pending
-
2026-05-05$175,000 Active
-
2007-12-19historical
-
2007-12-19historical
-
2004-10-07$99,900
-
2003-11-05$89,900
-
1997-08-08soldstatus $53,000
-
1987-05-01soldstatus $42,500
ⓘ Source: listings_history table (triggers on properties + properties_extension) + one-shot
backfill from property_details.listing_events for pre-trigger history.
Tax reassessment forecast OK · Resets to sale price
- Current annual tax
- $959 · $80/mo
- Projected year-2 tax
- $1,575 · $131/mo
- Expected delta
- +$616/yr (+$51/mo · 64.2%)
ⓘ Screening estimate from a state-policy table — verify with the county assessor before closing.
Climate risk First Street
- Flood 1/10 Low FEMA zone X (unshaded) · 0% chance over 30 yrs
- Wildfire 6/10 Major
- Heat 6/10 Major 7 d/yr ≥110°F today · 19 d/yr by 30 yrs out
- Wind 3/10 Moderate 5% chance of damaging wind over 30 yrs
- Air quality 2/10 Low 1 unhealthy d/yr today · 1 by 30 yrs out
Nearby sold comps map
Loading sold comps map…
Walkable amenities ~0.75 mi
Loading nearby amenities…
Taxation est. · year 1
- Rental income
- $14,691
- − Mortgage interest
- −$9,803
- − Property taxes
- −$959
- − Insurance
- −$875
- − Repairs & maintenance
- −$1,175
- − Management
- −$1,175
- − Depreciation
- −$5,091
- Taxable loss
- −$4,387
- Est. tax savings @ 24.0%
- +$1,053
- After-tax cash flow
- $-188/yr
For passive investors: Depreciation is non-cash, so a rental often shows a tax loss while cash-flowing — sheltering income. Rental losses are passive: they offset passive income freely, and up to $25,000/yr can offset ordinary (W-2) income if you actively participate and your MAGI is under $100k (phasing out to $0 by $150k); unused losses carry forward. On sale, claimed depreciation is recaptured at up to 25%, and gains may owe capital-gains tax (a 1031 exchange can defer both). Figures are a year-1 estimate at your 24.0% rate — not tax advice; consult a CPA.
Schools (NCES district)
- District
- Chandler
- NCES district ID
- 4007290
- Math proficiency
- 35% ▲ 1.00%
- Reading proficiency
- 35% ▬ 0.00%
- Median HH income
- $45,229
- Composite
- 29.9/100
- National rank
- #6392
- State rank
- #36 of 270 in OK
Livability — Chandler
- Score
- 64/100
- State rank
- #171
- US rank
- #13840
Category grades
Schools grade is shown separately in the Schools card above.
Census & demographics
- Census place
- Chandler, OK
- City population
- 7,551
- Population (ZIP)
- 7,551
Population outlook (Lincoln County) Hauer SSP2
- Today (2025)
- 36,104 people
- By 2030
- 36,435 · +0.9%
- By 2040
- 36,696 · +1.6%
- By 2050
- 36,216 · +0.3%
- By 2075
- 35,057 · -2.9%
- By 2100
- 31,333 · -13.2%
Race, ethnicity, and origin ACS 2023
- Neighborhood character
- Predominantly White (78%)
- Race & ethnicity
- White 78% Two or more races 12% Hispanic / Latino 3% Black 3% Native American 3%
- Common ancestry
- Lithuanian 4% Slovak 2% Scottish 1%
- Foreign-born
- 1%
- Languages at home
- 97% English-only · Spanish 2%
Political lean MEDSL · Lincoln
- 2024 margin
- Solid R (+63.3) · D 17.5% · R 80.8% · Other 1.7%
- 2008→2024 swing
- -13.4pp toward R · 2008: -49.8pp · 2024: -63.3pp
- All cycles
- 2024: R+63.3 2020: R+63.2 2016: R+60.1 2012: R+49.0 2008: R+49.8
Not yet ingested
- Civics
- —
Market trends
- HPI YoY
- ▲ 52.43%
- Current HPI
- 315.8775
- Rent YoY
- —
- Metro
- —
- State GDP YoY
- ▲ 1.55%
- F500 in state
- 6
Industry mix (Fortune 500 HQ in OK)
| Industry | F500 HQs | Revenue |
|---|---|---|
| Energy | 3 | $48B |
|
||
Price history
+311.8% since first listed8 events — show timeline
- 2026-05-19 Pending — MLSOK
- 2026-05-05 Listed $175,000 MLSOK
- 2007-12-19 Listing Removed — MLSOK
- 2007-12-19 Listing Removed — MLSOK
- 2004-10-07 Listed $99,900 MLSOK
- 2003-11-05 Listed $89,900 MLSOK
- 1997-08-08 Sold (Public Records) $53,000 Public Records
- 1987-05-01 Sold (Public Records) $42,500 Public Records
Property tax history
+3.7%/yrLatest (2025): $959 · +6.2% YoY. Source: county tax records.
Cash-flow waterfall
monthlySold comps — $/sqft
last 12 mo · ≤1 miLoading sold comps…