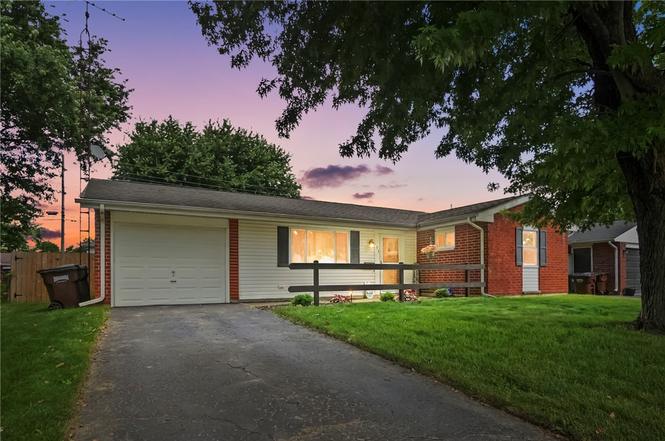
193 Oregon Dr · Xenia, OH
Flood risk 1/10 · Minimal
- FEMA flood zone
- X (unshaded)
- Chance of flooding over 30 yrs
- 0.0%
- Est. flood insurance / yr
- $507 – $1,088
Fire risk 1/10 · Minimal
- Est. fire insurance / yr
- $713 – $1,323
Heat risk 3/10 · Minor
- Hot days now (above 100°F)
- 7 days/yr
- Hot days in 30 yrs
- 18 days/yr
Wind risk 2/10 · Minimal
- Chance of severe wind over 30 yrs
- 1.0%
Air-quality risk 3/10 · Minor
- Unhealthy air days now
- 3 days/yr
- Unhealthy air days in 30 yrs
- 4 days/yr
Risk factors via First Street. Map © Google.
Why this score? — see what drove the D grade
The composite is a weighted blend of 9 inputs, each scored 0–100. Each bar is that input's sub-score; the figure is the points it added to the 100-point composite (weight × sub-score).
- Cash flow +14.5/30.0
- ARV discount +6.4/15.0
- DSCR +4.4/10.0
- Schools +4.0/10.0
- Rent growth +3.9/5.0
- Livability +3.8/5.0
- 1% rule +3.5/10.0
- Condition / age +2.5/5.0
- Appreciation +0.0/10.0
$195,000
🖨 Deal sheet (PDF) 📄 Offer letter ✓ Due diligence
Listing remarks MLS
Great Opportunity! Back on the market. Great back yard with partial privacy fence and garden shed 3 bedrooms with 1.5 bath Kitchen is complete with range, refrigerator, microwave and oak cabinets. Large, attached garage with room for your vehicle and storage space. Only one owner this home has been lovingly cared for. Back yard offers shade, and a storage shed. Measurements are approximate please do your own measuring. Kitchen was remodeled a few years ago with beautiful laminate counter tops additional beautiful natural oak cabinets. This home could be a retirement place for the right buyer or the perfect first-time home. Look at how much more you get then renting. Go and Show Carrier Furnace 10/12/2012, Trane AC 6/9/2018 Rheem Water heater 6/21/2021 Culligan Water Softener 12/11/2011
Key facts
- Classic cabinetry
- Covered patio
- Storage shed
Tags
Property features AI
Finance
- Financial info: Offered for sale
Exterior
- Parking: Attached one-car garage with garage door opener
- Security: Smoke detector(s)
- Utilities: Public water/sewer (assumed from typical connections); Natural gas heating
- Home design: Single-story home; Brick construction; Slab foundation; Residential zoning
- Construction: Brick exterior; Slab foundation
- Exterior features: Fenced yard; Patio; Storage shed(s)
Interior
- Kitchen: Eat-in kitchen; Range; Microwave; Refrigerator
- Bedrooms: Two main-level bedrooms (11 x 10; 13 x 12)
- Flooring: Laminate counters noted (flooring type not specified)
- Bathrooms: One full bathroom; One half bathroom; Two main-level bathrooms
- Heating & cooling: Central air conditioning; Forced air heating (natural gas)
- Interior features: Insulated vinyl windows; Ceiling fan(s); Laminate counters; Water softener
Neighborhood map
What this means for you Summary
Snapshot
- This is a 3-bed/1.5-bath single-family listed at $195k.
Deal economics
- At list price, monthly cash flow is $44 ($527/yr) — positive.
- The deal already cash-flows at list — no discount required.
- To meet the 1% rule (rent ≥ 1% of price), the offer needs to be $166k (15.1% below list).
- Recommended offer: $166k (15.1% below list) — sets the bar for 1% rule.
- Cap rate 6.6% vs local median 3.6% in Xenia — top-decile yield for the area; either an underpriced asset or a hidden risk that comps aren't pricing in. Stress-test before assuming the spread holds.
Location & tenants
- Location reads 75/100 on livability (#244 in OH, #3,892 nationally) — a middle-class / working-renter tenant base. Strengths: cost of living A+, housing A+, health & safety B+; Watch: amenities D+, commute F, employment F.
- Xenia Community City (suburban): math 42% / reading 53% proficiency, ranked #478 of 656 in OH (top 73%) — families likely to look elsewhere, expect single-tenant / working-renter base with shorter leases.
- Zoned schools: Arrowood Elementary (math 55% / reading 50%, grade C-, #846 of 1,584 statewide, top 54%, 419 students, 0% FRL); Warner Middle School (math 35% / reading 45%, grade F, #511 of 654 statewide, top 79%, 848 students, 0% FRL); Xenia High School (math 25% / reading 63%, grade F, #489 of 781 statewide, top 63%, 985 students, 48% FRL) — zoned schools average 16% FRL vs 50% district-wide (34 pts lower); this property's tenant base skews higher-income than the district average.
- Market conditions: Rents rising fast (+5.5%/yr); 240 active listings in the ZIP; 3 comparable units currently listed for rent nearby; rentals leasing fast (median 5d on market — plan ~1-2 weeks tenant-placement turnaround); solid renter incomes; 797 units permitted in Greene County in 2024 (148 in 5+ unit buildings).
Forward outlook
- Local home prices are declining (-3.0%/yr); year-one equity from $1k of loan paydown is wiped out by about $6k of value loss. Plan a longer hold.
Negotiation context
- Only 3 days on market — expect competitive offers; lowballing is unlikely to land.
- 4 sale attempts since 2y ago with the ask held roughly flat each time — persistent listings suggest the price (not the market) is what's stuck; bring a comps-based counter.
Questions for the listing agent
- Built in 1971 — when were the roof, HVAC, electrical panel, plumbing, and water heater last replaced?
- Is there a deadline driving the sale (1031 exchange, divorce, estate, relocation)? That informs how much negotiation room exists.
- The area grade is low — what's the realistic commute time and amenity access for the typical tenant pool here? Any planned neighborhood developments (good or bad) we should know about?
- What's the average days-on-market for RENTAL listings here right now (not sales)? A rising rental-DOM trend means longer vacancies and softer asking-rent achievability than the comps imply.
- What's the recent tenant-quality profile in this submarket — average credit score on applications, eviction rate, late-payment / NSF rate, and stable-employment percentage? A property-management company in the area should have these aggregated.
- How much new for-sale + rental construction is in the pipeline within 1–3 miles? Heavy new supply typically softens prices + rents 12–24 months out; constrained supply supports both.
Investment metrics
- 1% rule
- 0.85% ✗
- Cap rate
- 6.56%
- Cash-on-cash
- 0.97%
- DSCR
- 1.04
- GRM
- 9.8
CMA / ARV
- ARV (on-the-fly)
- $190,190
- Comps found
- 12
Show comp detail 12 sales within ~0.75 mi
| Address | Dist | Beds/Ba | Sqft | Sold | Price | $/sf | Match |
|---|---|---|---|---|---|---|---|
| 2015 Iowa Dr | 0.26mi | 3/2.0 | 999 (-0%) | 7mo | $229,900 | $230 | 79 |
| 1861 Nebraska Dr | 0.50mi | 3/1.0 | 1,015 (+1%) | 1mo | $176,000 | $173 | 72 |
| 219 Kansas Dr | 0.05mi | 3/1.0 | 1,131 (+13%) | 4mo | $168,500 | $149 | 71 |
| 1618 Navajo Dr | 0.58mi | 3/1.0 | 999 (-0%) | 7mo | $181,500 | $182 | 65 |
| 1769 Gayhart Dr | 0.62mi | 3/1.5 | 1,015 (+1%) | 6mo | $192,500 | $190 | 63 |
| 1708 Ottawa Dr | 0.55mi | 3/1.0 | 962 (-4%) | 7mo | $180,000 | $187 | 60 |
| 1403 Texas Dr | 0.73mi | 3/1.0 | 999 (-0%) | 6mo | $213,000 | $213 | 59 |
| 1392 Chinook Ct | 0.64mi | 3/1.5 | 1,110 (+11%) | 2mo | $228,000 | $205 | 51 |
| 2096 Alabama Dr | 0.61mi | 3/1.5 | 1,127 (+13%) | 2mo | $189,000 | $168 | 48 |
| 1796 W Second St | 0.63mi | 3/1.0 | 896 (-10%) | 9mo | $161,500 | $180 | 44 |
| 1777 Kylemore Dr | 0.65mi | 3/1.0 | 864 (-14%) | 3mo | $165,000 | $191 | 42 |
| 2105 Drake Dr | 0.65mi | 3/1.0 | 864 (-14%) | 8mo | $183,000 | $212 | 38 |
Match score weights: distance 35% · size 25% · config 20% · recency 20%. Top-matched comps best support the ARV.
Projected returns pro-forma
-3.0% appreciation · 5.48% rent growth · sell at horizon
- IRR
- -12.2%
- Equity multiple
- 0.55×
- Total profit
- $-24,593
- Equity at exit
- $29,075
- IRR
- 0.1%
- Equity multiple
- 1.01×
- Total profit
- $360
- Equity at exit
- $16,860
Cash invested: $54,600 (down + closing). Projections, not guarantees.
Landlord ↔ Tenant lean methodology
- Overall (STATE)
- 73 Landlord-Friendly
- State Ohio
- 73 Landlord-Friendly · R+6
- County
- — inherits STATE
- City
- — inherits STATE
ZIP-level market 45385
- Rents YoY
- 5.5%
- Active inventory
- 240
- Price-to-rent
- 9.8×
Monthly cashflow live
- Estimated rent
- $1,656 medium interval (Pro) →
- Mortgage (P&I)
- −$1,023
- Tax from tax record
- −$160 /mo · $1,922/yr
- Insurance
- −$81
- HOA
- −$0
- Vacancy / Maint / Mgmt
- −$348
- Net cashflow
- $44
Break-even live
Sensitivity live
| Price | -10% $154 | -5% $99 | +0% $44 | +5% $-11 | +10% $-66 |
|---|---|---|---|---|---|
| Rent | -10% $-87 | -5% $-21 | +0% $44 | +5% $109 | +10% $175 |
| Rate | -1.0pp $142 | -0.5pp $94 | base $44 | +0.5pp $-7 | +1.0pp $-58 |
UW: 25.0% down · 7.5% · 30yr · 1.5% tax · 5.0% vac · 8.0% maint · 8.0% mgmt
Financing live
Cash to close
- Down payment
- $48,750
- Closing costs
- $5,850
- Reserves months
- —
- Total cash needed
- —
Loan-product check · same deal, 3 products live
Conventional
25% down · 7.5% · 30yr
- Down + closing
- —
- Monthly P&I
- —
- Monthly cashflow
- —
- DSCR
- —
- Eligible?
- —
Personal DTI + credit; lowest rate.
DSCR
20% down · 8.5% · 30yr
- Down + closing
- —
- Monthly P&I
- —
- Monthly cashflow
- —
- DSCR
- —
- Eligible?
- —
No personal income docs; deal must DSCR.
Hard money
10% down · 12.0% · 12mo
- Down + closing
- —
- Monthly P&I
- —
- Monthly cashflow
- —
- DSCR
- —
- Eligible?
- —
Short-term bridge; refi at stabilization.
Rent comps 3 comps
| Address | Beds | Baths | Sqft | Rent | $/sqft | DOM | Units | Dist |
|---|---|---|---|---|---|---|---|---|
| 216 Kansas Dr Xenia, OH | 3.0 | 2.0 | 1100 | $1,600 | $1.45 | 4d | 1 | 0.10mi |
| 1331 Berwald Dr Xenia, OH | 3.0 | 1.0 | 896 | $1,850 | $2.06 | 4d | 1 | 1.38mi |
| 87 Poe Ln Xenia, OH | 3.0 | 1.0 | 912 | $1,400 | $1.54 | 4d | 1 | 1.41mi |
Listing history 3 events
-
2026-06-21days on market $195,000 Active 3 DOM
-
2026-06-19remarks 699-char remark
-
2026-06-19$195,000 Active 1 DOM
ⓘ Source: listings_history table (triggers on properties + properties_extension) + one-shot
backfill from property_details.listing_events for pre-trigger history.
Tax reassessment forecast OH · Partial reset (capped growth)
- Current annual tax
- $1,922 · $160/mo
- Projected year-2 tax
- $2,482 · $207/mo
- Expected delta
- +$560/yr (+$47/mo · 29.1%)
ⓘ Screening estimate from a state-policy table — verify with the county assessor before closing.
Climate risk First Street
- Flood 1/10 Low FEMA zone X (unshaded) · 0% chance over 30 yrs
- Wildfire 1/10 Low
- Heat 3/10 Moderate 7 d/yr ≥100°F today · 18 d/yr by 30 yrs out
- Wind 2/10 Low 100% chance of damaging wind over 30 yrs
- Air quality 3/10 Moderate 3 unhealthy d/yr today · 4 by 30 yrs out
Nearby sold comps map
Loading sold comps map…
Walkable amenities ~0.75 mi
Loading nearby amenities…
Taxation est. · year 1
- Rental income
- $19,868
- − Mortgage interest
- −$10,923
- − Property taxes
- −$1,922
- − Insurance
- −$975
- − Repairs & maintenance
- −$1,589
- − Management
- −$1,589
- − Depreciation
- −$5,673
- Taxable loss
- −$2,804
- Est. tax savings @ 24.0%
- +$673
- After-tax cash flow
- $1,200/yr
For passive investors: Depreciation is non-cash, so a rental often shows a tax loss while cash-flowing — sheltering income. Rental losses are passive: they offset passive income freely, and up to $25,000/yr can offset ordinary (W-2) income if you actively participate and your MAGI is under $100k (phasing out to $0 by $150k); unused losses carry forward. On sale, claimed depreciation is recaptured at up to 25%, and gains may owe capital-gains tax (a 1031 exchange can defer both). Figures are a year-1 estimate at your 24.0% rate — not tax advice; consult a CPA.
Schools (NCES district)
- District
- Xenia Community City
- NCES district ID
- 3904515
- Math proficiency
- 42% ▼ -16.00%
- Reading proficiency
- 53% ▼ -5.00%
- Median HH income
- $46,206
- Composite
- 40.31/100
- National rank
- #3752
- State rank
- #478 of 656 in OH
Livability — Xenia
- Score
- 75/100
- State rank
- #244
- US rank
- #3892
Category grades
Schools grade is shown separately in the Schools card above.
Census & demographics
- Census place
- Xenia, OH
- County
- Greene County · 132,120 people
- City population
- 40,617
- Metro
- Dayton-Kettering, OH
- Population (ZIP)
- 40,617
- Household income
- $76,564
- Rent vs Own
- Severe rent burden
- 906.0
Population outlook (Greene County) Hauer SSP2
- Today (2025)
- 170,301 people
- By 2030
- 171,840 · +0.9%
- By 2040
- 171,408 · +0.7%
- By 2050
- 167,806 · -1.5%
- By 2075
- 154,430 · -9.3%
- By 2100
- 138,669 · -18.6%
Race, ethnicity, and origin ACS 2023
- Neighborhood character
- Predominantly White (83%)
- Race & ethnicity
- White 83% Two or more races 6% Black 6% Hispanic / Latino 2% Asian 2%
- Common ancestry
- Slovak 3% Italian 2% Serbian 1%
- Foreign-born
- 3% · Canada
- Languages at home
- 96% English-only · Other Indo-European 1% Spanish 1%
Political lean MEDSL · Greene
- 2024 margin
- R (+19.8) · D 39.5% · R 59.3% · Other 1.2%
- 2008→2024 swing
- -1.4pp toward R · 2008: -18.4pp · 2024: -19.8pp
- All cycles
- 2024: R+19.8 2020: R+19.5 2016: R+24.5 2012: R+21.8 2008: R+18.4
Not yet ingested
- Civics
- —
Market trends
- HPI YoY
- ▼ -158.15%
- Current HPI
- 239.0473
- Rent YoY
- ▲ 5.48%
- Metro
- Dayton-Kettering, OH
- State GDP YoY
- ▲ 1.98%
- F500 in state
- 48
Industry mix (Fortune 500 HQ in OH)
| Industry | F500 HQs | Revenue |
|---|---|---|
| Insurance | 3 | $145B |
|
||
| Industrial Machinery | 3 | $49B |
|
||
| Financial Services | 3 | $24B |
|
||
| Consumer Goods | 2 | $93B |
|
||
| Aerospace / Defense | 2 | $47B |
|
||
| Utilities | 2 | $33B |
|
||
Price history
+15.4% since first listed10 events — show timeline
- 2026-06-18 Listed $195,000 Dayton MLS
- 2025-02-06 Sold (Public Records) $176,000 Public Records
- 2025-01-28 Sold (MLS) $176,000 Dayton MLS
- 2024-12-28 Pending — Dayton MLS
- 2024-10-12 Price Changed $172,000 Dayton MLS
- 2024-10-12 Relisted — Dayton MLS
- 2024-10-07 Contingent — Dayton MLS
- 2024-09-21 Relisted — Dayton MLS
- 2024-09-16 Contingent — Dayton MLS
- 2024-09-01 Listed $169,000 Dayton MLS
Property tax history
+7.2%/yrLatest (2025): $1,922 · +34.3% YoY. Source: county tax records.
Cash-flow waterfall
monthlySold comps — $/sqft
last 12 mo · ≤1 miLoading sold comps…