6110 91st St E #145 · Summit, WA
Flood risk 1/10 · Minimal
- FEMA flood zone
- X (unshaded)
- Chance of flooding over 30 yrs
- 0.0%
- Est. flood insurance / yr
- $507 – $1,088
Fire risk 1/10 · Minimal
- Est. fire insurance / yr
- $604 – $1,122
Heat risk 3/10 · Minor
- Hot days now (above 87°F)
- 7 days/yr
- Hot days in 30 yrs
- 16 days/yr
Wind risk 1/10 · Minimal
- Chance of severe wind over 30 yrs
- —
Air-quality risk 7/10 · Major
- Unhealthy air days now
- 11 days/yr
- Unhealthy air days in 30 yrs
- 12 days/yr
Risk factors via First Street. Map © Google.
Why this score? — see what drove the D+ grade
The composite is a weighted blend of 9 inputs, each scored 0–100. Each bar is that input's sub-score; the figure is the points it added to the 100-point composite (weight × sub-score).
- Cash flow +15.5/30.0
- ARV discount +11.3/15.0
- DSCR +4.8/10.0
- 1% rule +4.2/10.0
- Schools +3.9/10.0
- Livability +3.3/5.0
- Rent growth +2.9/5.0
- Condition / age +2.5/5.0
- Appreciation +0.0/10.0
$285,000
🖨 Deal sheet 📄 Offer letter ✓ Due diligence
Listing remarks
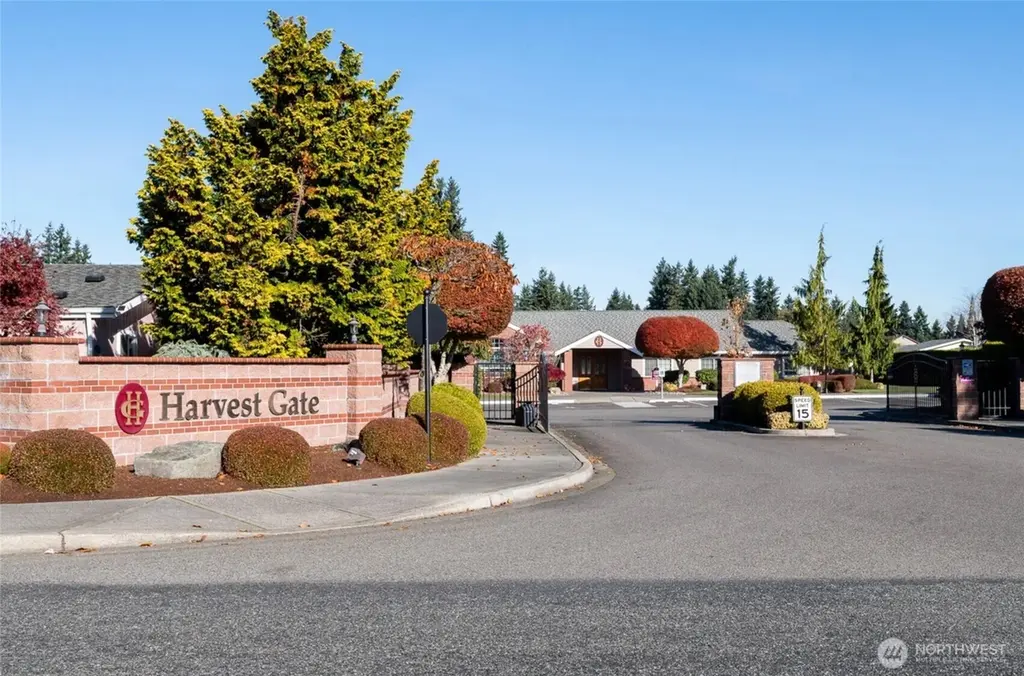
Step into comfort and style in this beautifully refreshed Silvercrest home, the largest floorplan in the sought-after Harvest Gate 55+ community! Fresh interior paint, brand-new carpet, updated windows, and numerous recent touch-ups make this spacious home feel bright, clean, and move-in ready. The expansive living room welcomes you with soaring vaulted ceilings and abundant natural light enhanced by multiple solar tubes throughout the home. Enjoy both formal and casual dining spaces, including a huge island kitchen with room for an everyday dining table, walk-in pantry, brand-new appliances, and new Maytag washer and dryer. The oversized primary suite offers a relaxing retreat with a cozy
Key facts
- Walk-in closet
- Spacious kitchen
- Gas fireplace
Tags
Neighborhood map
What this means for you Summary
Snapshot
- This is a 3-bed/2.0-bath manufactured listed at $285k.
Deal economics
- At list price, monthly cash flow is $115 ($1k/yr) — positive.
- The deal already cash-flows at list — no discount required.
- To meet the 1% rule (rent ≥ 1% of price), the offer needs to be $262k (8.1% below list).
- Recommended offer: $251k (12.0% below list) — sets the bar for market timing.
- Cap rate 6.8% vs local median 2.5% in Summit — top-decile yield for the area; either an underpriced asset or a hidden risk that comps aren't pricing in. Stress-test before assuming the spread holds.
Location & tenants
- Location reads 66/100 on livability (#318 in WA) — a middle-class / working-renter tenant base. Strengths: housing A+, health & safety A+, employment A; Watch: schools D-, amenities F, commute F.
- Franklin Pierce School District (suburban): math 35% / reading 51% proficiency, ranked #197 of 291 in WA (top 68%) — families likely to look elsewhere, expect single-tenant / working-renter base with shorter leases.
- Market conditions: Rents rising (+1.4%/yr); 227 active listings in the ZIP; 1 comparable units currently listed for rent nearby; solid renter incomes; 3,209 units permitted in Pierce County in 2024 (1,269 in 5+ unit buildings).
- This rent runs 32% of the median local income ($97k/yr) — at the standard rent-burdened threshold; future hikes will face affordability resistance.
Forward outlook
- Local home prices are declining (-3.0%/yr); year-one equity from $2k of loan paydown is wiped out by about $9k of value loss. Plan a longer hold.
- Pierce County population projected at +26% by 2050 — long-run rental-demand tailwind backs the buy-and-hold thesis.
Negotiation context
- It's been on market 205 days — a 12% lower offer ($251k) is reasonable based on typical stale-listing flexibility.
- 2 sale attempts; this cycle's ask has dropped $40k (12%) from the opening price — seller is motivated, your offer sets the floor, not the list.
Questions for the listing agent
- It's been on market 205 days. Have you received any prior offers? Is the seller open to a 12% concession, seller financing, or rate buy-down credit?
- Why hasn't it sold? Are there any deal-killer items the seller is aware of (foundation, flood, title, zoning, code violations)?
- Is there a deadline driving the sale (1031 exchange, divorce, estate, relocation)? That informs how much negotiation room exists.
- Schools are D-rated, which usually means shorter tenancies and higher turnover. Who's the typical renter profile here, and what's been the actual vacancy rate?
- The area grade is low — what's the realistic commute time and amenity access for the typical tenant pool here? Any planned neighborhood developments (good or bad) we should know about?
- What's the average days-on-market for RENTAL listings here right now (not sales)? A rising rental-DOM trend means longer vacancies and softer asking-rent achievability than the comps imply.
- What's the recent tenant-quality profile in this submarket — average credit score on applications, eviction rate, late-payment / NSF rate, and stable-employment percentage? A property-management company in the area should have these aggregated.
- How much new for-sale + rental construction is in the pipeline within 1–3 miles? Heavy new supply typically softens prices + rents 12–24 months out; constrained supply supports both.
Investment metrics
- 1% rule
- 0.92% ✗
- Cap rate
- 6.78%
- Cash-on-cash
- 1.72%
- DSCR
- 1.08
- GRM
- 9.1
CMA / ARV
- ARV (median comp)
- $311,263
- List price
- $285,000
- Delta
- -8.44%
- Verdict
- FAIR
- Comps
- 17 within 1.0 mi
Show comp detail 10 sales within ~0.75 mi
| Address | Dist | Beds/Ba | Sqft | Sold | Price | $/sf | Match |
|---|---|---|---|---|---|---|---|
| 6020 91st St E #143 | 0.02mi | 2/2.0 (-1) | 2,176 (0%) | 7mo | $335,000 | $154 | 88 |
| 9120 60th Ave E #101 | 0.05mi | 2/2.0 (-1) | 2,176 (0%) | 7mo | $332,500 | $153 | 86 |
| 6024 88th Street Ct E #47 | 0.17mi | 2/2.0 (-1) | 2,176 (0%) | 3mo | $335,000 | $154 | 84 |
| 5702 90th Street Ct E #173 | 0.22mi | 2/2.0 (-1) | 2,176 (0%) | 1mo | $300,000 | $138 | 84 |
| 6122 91st St E | 0.02mi | 3/2.0 | 2,176 (0%) | 20mo | $340,000 | $156 | 82 |
| 6008 88th Street Ct E #43 | 0.17mi | 3/2.0 | 2,176 (0%) | 19mo | $364,215 | $167 | 76 |
| 5725 90th Street Ct E #159 | 0.18mi | 2/2.0 (-1) | 2,176 (0%) | 18mo | $360,000 | $165 | 72 |
| 6114 89 Street Ct E #24 | 0.10mi | 2/2.0 (-1) | 2,024 (-7%) | 14mo | $370,500 | $183 | 67 |
| 5730 89 St E #4 | 0.22mi | 2/2.0 (-1) | 2,024 (-7%) | 9mo | $320,000 | $158 | 66 |
| 6109 89th Street Ct E #69 | 0.12mi | 3/2.0 | 1,953 (-10%) | 24mo | $325,000 | $166 | 57 |
Match score weights: distance 35% · size 25% · config 20% · recency 20%. Top-matched comps best support the ARV.
Projected returns pro-forma
-3.0% appreciation · 1.41% rent growth · sell at horizon
- IRR
- -15.3%
- Equity multiple
- 0.46×
- Total profit
- $-42,982
- Equity at exit
- $42,494
- IRR
- -9.7%
- Equity multiple
- 0.44×
- Total profit
- $-44,304
- Equity at exit
- $24,642
Cash invested: $79,800 (down + closing). Projections, not guarantees.
Landlord ↔ Tenant lean methodology
- Overall (STATE)
- 28 Tenant-Leaning
- State Washington
- 28 Tenant-Leaning · D+8
- County
- — inherits STATE
- City
- — inherits STATE
ZIP-level market 98371
- Rents YoY
- 1.4%
- Active inventory
- 227
- Price-to-rent
- 9.1×
Monthly cashflow live
- Estimated rent
- $2,618 medium interval (Pro) →
- Mortgage (P&I)
- −$1,495
- Tax from tax record
- −$341 /mo · $4,088/yr
- Insurance
- −$119
- HOA
- −$0
- Vacancy / Maint / Mgmt
- −$550
- Net cashflow
- $115
Break-even live
UW: 25.0% down · 7.5% · 30yr · 1.5% tax · 5.0% vac · 8.0% maint · 8.0% mgmt
Financing live
Cash to close
- Down payment
- $71,250
- Closing costs
- $8,550
- Reserves months
- —
- Total cash needed
- —
Loan-product check · same deal, 3 products live
Conventional
25% down · 7.5% · 30yr
- Down + closing
- —
- Monthly P&I
- —
- Monthly cashflow
- —
- DSCR
- —
- Eligible?
- —
Personal DTI + credit; lowest rate.
DSCR
20% down · 8.5% · 30yr
- Down + closing
- —
- Monthly P&I
- —
- Monthly cashflow
- —
- DSCR
- —
- Eligible?
- —
No personal income docs; deal must DSCR.
Hard money
10% down · 12.0% · 12mo
- Down + closing
- —
- Monthly P&I
- —
- Monthly cashflow
- —
- DSCR
- —
- Eligible?
- —
Short-term bridge; refi at stabilization.
Rent comps 1 comps
| Address | Beds | Baths | Sqft | Rent | $/sqft | DOM | Units | Dist |
|---|---|---|---|---|---|---|---|---|
| 9604 S Fruitland Unit 7502 Puyallup, WA | 2.0 | 2.0 | 1492 | $2,500 | $1.68 | 1d | 1 | 0.94mi |
Listing history 11 events
-
2026-06-04status $285,000 Pending 205 DOM
-
2026-06-03days on market $285,000 Active Under Contract 205 DOM
-
2026-06-02days on market $285,000 Active Under Contract 204 DOM
-
2026-06-01days on market $285,000 Active Under Contract 203 DOM
-
2026-05-31days on market $285,000 Active Under Contract 202 DOM
-
2026-05-14status Active
-
2026-03-19price $285,000
-
2026-03-11price $295,000
-
2026-02-11price $305,000
-
2025-11-14price $315,000
-
2025-10-08$324,950 Active
ⓘ Source: listings_history table (triggers on properties + properties_extension) + one-shot
backfill from property_details.listing_events for pre-trigger history.
Tax reassessment forecast WA · Resets to sale price
- Current annual tax
- $4,088 · $341/mo
- Projected year-2 tax
- $4,088 · $341/mo
- Expected delta
- $0/yr ($0/mo · 0.0%)
ⓘ Screening estimate from a state-policy table — verify with the county assessor before closing.
Climate risk First Street
- Flood 1/10 Low FEMA zone X (unshaded) · 0% chance over 30 yrs
- Wildfire 1/10 Low
- Heat 3/10 Moderate 7 d/yr ≥87°F today · 16 d/yr by 30 yrs out
- Wind 1/10 Low
- Air quality 7/10 Severe 11 unhealthy d/yr today · 12 by 30 yrs out
Nearby sold comps map
Loading sold comps map…
Walkable amenities ~0.75 mi
Loading nearby amenities…
Taxation est. · year 1
- Rental income
- $31,420
- − Mortgage interest
- −$15,964
- − Property taxes
- −$4,088
- − Insurance
- −$1,425
- − Repairs & maintenance
- −$2,514
- − Management
- −$2,514
- − Depreciation
- −$8,291
- Taxable loss
- −$3,375
- Est. tax savings @ 24.0%
- +$810
- After-tax cash flow
- $2,184/yr
For passive investors: Depreciation is non-cash, so a rental often shows a tax loss while cash-flowing — sheltering income. Rental losses are passive: they offset passive income freely, and up to $25,000/yr can offset ordinary (W-2) income if you actively participate and your MAGI is under $100k (phasing out to $0 by $150k); unused losses carry forward. On sale, claimed depreciation is recaptured at up to 25%, and gains may owe capital-gains tax (a 1031 exchange can defer both). Figures are a year-1 estimate at your 24.0% rate — not tax advice; consult a CPA.
Schools (NCES district)
- District
- Franklin Pierce School District
- NCES district ID
- 5302940
- Math proficiency
- 35% ▬ 0.00%
- Reading proficiency
- 51% ▲ 2.00%
- Median HH income
- $49,240
- Composite
- 39.18/100
- National rank
- #8227
- State rank
- #197 of 291 in WA
Livability — Summit
- Score
- 66/100
- State rank
- #318
- US rank
- #11661
Category grades
Schools grade is shown separately in the Schools card above.
Census & demographics
- Census place
- Summit, WA
- County
- Pierce County · 788,257 people
- Metro
- Seattle-Tacoma-Bellevue, WA
- Population (ZIP)
- 24,682
- Household income
- $97,242
- Rent vs Own
- Severe rent burden
- 507.0
Population outlook (Pierce County) Hauer SSP2
- Today (2025)
- 956,648 people
- By 2030
- 1,010,862 · +5.7%
- By 2040
- 1,113,170 · +16.4%
- By 2050
- 1,206,524 · +26.1%
- By 2075
- 1,436,425 · +50.2%
- By 2100
- 1,563,654 · +63.5%
Race, ethnicity, and origin ACS 2023
- Neighborhood character
- Predominantly White (70%)
- Race & ethnicity
- White 70% Two or more races 12% Hispanic / Latino 11% Asian 6% Black 4%
- Hispanic origin (detail)
- Mexican 9%
- Common ancestry
- Portuguese 5% Slovak 3% Italian 2%
- Foreign-born
- 10% · Canada, South Korea, Vietnam
- Languages at home
- 85% English-only · Spanish 5% Korean 2% Vietnamese 2%
Political lean MEDSL · Pierce
- 2024 margin
- D (+10.8) · D 53.9% · R 43.1% · Other 3.0%
- 2008→2024 swing
- -1.4pp toward R · 2008: 12.2pp · 2024: 10.8pp
- All cycles
- 2024: D+10.8 2020: D+11.2 2016: D+7.5 2012: D+11.0 2008: D+12.2
Not yet ingested
- Civics
- —
Market trends
- HPI YoY
- ▼ -580.45%
- Current HPI
- 295.2143
- Rent YoY
- ▲ 1.41%
- Metro
- Seattle-Tacoma-Bellevue, WA
- State GDP YoY
- ▲ 4.65%
- F500 in state
- 22
Industry mix (Fortune 500 HQ in WA)
| Industry | F500 HQs | Revenue |
|---|---|---|
| Retail | 2 | $269B |
|
||
| Technology / Retail | 1 | $638B |
|
||
| Technology | 1 | $245B |
|
||
| Telecommunications | 1 | $38B |
|
||
| Food / Beverage | 1 | $36B |
|
||
| Automotive / Trucks | 1 | $34B |
|
||
Price history
-12.3% since first listed6 events — show timeline
- 2026-05-14 Relisted — NWMLS as Distributed by MLS Grid
- 2026-03-19 Price Changed $285,000 NWMLS as Distributed by MLS Grid
- 2026-03-11 Price Changed $295,000 NWMLS as Distributed by MLS Grid
- 2026-02-11 Price Changed $305,000 NWMLS as Distributed by MLS Grid
- 2025-11-14 Price Changed $315,000 NWMLS as Distributed by MLS Grid
- 2025-10-08 Listed $324,950 NWMLS as Distributed by MLS Grid
Property tax history
+3.4%/yrLatest (2026): $4,088 · -4.1% YoY. Source: county tax records.
Cash-flow waterfall
monthlySold comps — $/sqft
last 12 mo · ≤1 miLoading sold comps…