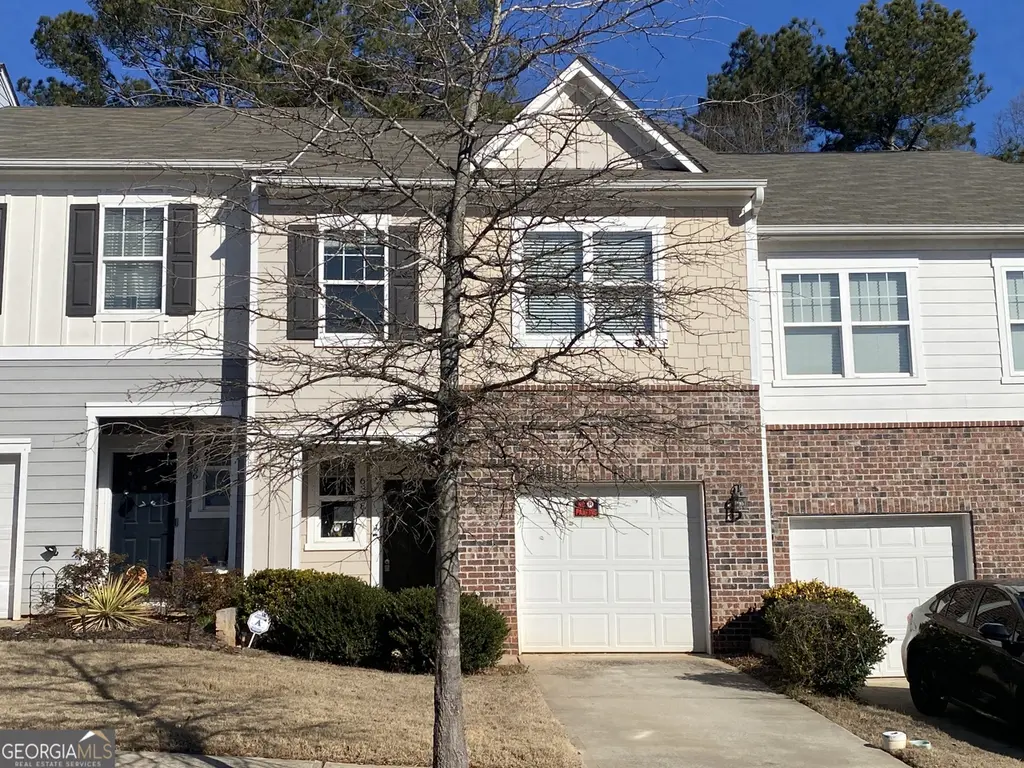
6368 Kennonbriar Ct · Stonecrest, GA
Flood risk 1/10 · Minimal
- FEMA flood zone
- X (unshaded)
- Chance of flooding over 30 yrs
- 0.0%
- Est. flood insurance / yr
- $507 – $1,088
Fire risk 1/10 · Minimal
- Est. fire insurance / yr
- $963 – $1,789
Heat risk 6/10 · Moderate
- Hot days now (above 105°F)
- 7 days/yr
- Hot days in 30 yrs
- 19 days/yr
Wind risk 5/10 · Moderate
- Chance of severe wind over 30 yrs
- 23.0%
Air-quality risk 5/10 · Moderate
- Unhealthy air days now
- 7 days/yr
- Unhealthy air days in 30 yrs
- 10 days/yr
Risk factors via First Street. Map © Google.
Why this score? — see what drove the B grade
The composite is a weighted blend of 9 inputs, each scored 0–100. Each bar is that input's sub-score; the figure is the points it added to the 100-point composite (weight × sub-score).
- Cash flow +28.8/30.0
- ARV discount +15.0/15.0
- DSCR +10.0/10.0
- 1% rule +8.1/10.0
- Rent growth +2.8/5.0
- Livability +2.5/5.0
- Condition / age +2.5/5.0
- Schools +2.1/10.0
- Appreciation +0.0/10.0
$147,000
🖨 Deal sheet 📄 Offer letter ✓ Due diligence
Listing remarks
Opportunity awaits at this 2-bedroom townhouse offering approximately 1514 square feet in the established McKenna Square Lithonia community. This property presents an excellent value-add opportunity for investors, renovators, or buyers looking to customize a home to their personal style. 6368 Kennonbriar Ct features a spacious layout with generously sized living areas, a dedicated dining space, and well-proportioned bedrooms, providing a strong foundation for updates and improvements. With the right vision and renovations, this property has the potential to become a comfortable residence or a rewarding investment property. Situated in a convenient Lithonia location, the community offers eas
Key facts
- Spacious layout
- Easy access to parks
- $130 HOA
Tags
Neighborhood map
What this means for you Summary
Snapshot
- This is a 3-bed/2.5-bath townhouse listed at $147k.
Deal economics
- At list price, monthly cash flow is $492 ($6k/yr) — positive.
- The deal already cash-flows at list — no discount required.
- Meets the 1% rule at list price ($2k rent vs $147k).
- Recommended offer: $145k (1.5% below list) — sets the bar for market timing.
- Cap rate 10.3% vs local median 5.1% in Stonecrest — top-decile yield for the area; either an underpriced asset or a hidden risk that comps aren't pricing in. Stress-test before assuming the spread holds.
Location & tenants
- Location reads: area grade B — affects rentability + tenant quality, not the cash-flow math above.
- Dekalb County (suburban): math 19% / reading 28% proficiency, ranked #125 of 174 in GA (top 72%) — low school quality limits family demand, transient renter base, plan for 1-2y turnover; 68% free/reduced lunch — lower-income household profile, screen leases tightly.
- Zoned schools: Stoneview Elementary School (math 6% / reading 9%, grade F, #1,125 of 1,228 statewide, top 93%, 781 students, 100% FRL); Lithonia Middle School (math 8% / reading 17%, grade F, #411 of 470 statewide, top 87%, 1,214 students, 100% FRL); Lithonia High School (math 2% / reading 17%, grade F, #365 of 424 statewide, top 88%, 1,483 students, 100% FRL) — zoned schools average 100% FRL vs 68% district-wide (32 pts higher); higher-poverty schools than district average — tighter screening recommended.
- Zoned-school proficiency averages 10% at this address vs 24% district-wide (-14 pts) — the specific schools serving this property underperform the Dekalb County average; the district grade overstates school quality for this exact location.
- Market conditions: Rents rising (+1.2%/yr); 435 active listings in the ZIP; 40 comparable units currently listed for rent nearby; rentals at typical pace (median 22d on market — plan ~3-4 weeks tenant-placement turnaround); 1,240 units permitted in DeKalb County in 2024 (385 in 5+ unit buildings).
- This rent runs 37% of the median local income ($62k/yr) — at the standard rent-burdened threshold; future hikes will face affordability resistance.
Forward outlook
- Local home prices are declining (-3.0%/yr); year-one equity from $1k of loan paydown is wiped out by about $4k of value loss. Plan a longer hold.
- DeKalb County population projected at +28% by 2050 — long-run rental-demand tailwind backs the buy-and-hold thesis.
- At projected returns (-3.0% appreciation + 1.2% rent growth), your $41k cash investment doubles in ~10 years — after that, you're playing with house money.
Negotiation context
- It's been on market 26 days — a 2% lower offer ($145k) is reasonable based on typical stale-listing flexibility.
Risks & watch-outs
- Climate carrying-cost: moderate wind risk, 23% chance of damaging wind over 30y; extreme-heat days projected 7→19/yr by 2055 (HVAC capex compounding) — expect insurance premiums to compound above CPI over the hold.
Questions for the listing agent
- What does the HOA fee cover, when was the last increase, and are there any pending special assessments or reserve-fund shortfalls?
- Is there a deadline driving the sale (1031 exchange, divorce, estate, relocation)? That informs how much negotiation room exists.
- What's the average days-on-market for RENTAL listings here right now (not sales)? A rising rental-DOM trend means longer vacancies and softer asking-rent achievability than the comps imply.
- What's the recent tenant-quality profile in this submarket — average credit score on applications, eviction rate, late-payment / NSF rate, and stable-employment percentage? A property-management company in the area should have these aggregated.
- How much new for-sale + rental construction is in the pipeline within 1–3 miles? Heavy new supply typically softens prices + rents 12–24 months out; constrained supply supports both.
Investment metrics
- 1% rule
- 1.31% ✓
- Cap rate
- 10.31%
- Cash-on-cash
- 14.34%
- DSCR
- 1.64
- GRM
- 6.4
CMA / ARV
- ARV (on-the-fly)
- $208,932
- Comps found
- 12
Show comp detail 12 sales within ~0.75 mi
| Address | Dist | Beds/Ba | Sqft | Sold | Price | $/sf | Match |
|---|---|---|---|---|---|---|---|
| 6386 Kennonbriar Ct | 0.03mi | 3/2.5 | 1,514 (0%) | 8mo | $210,000 | $139 | 92 |
| 6416 Kennonbriar Ct | 0.09mi | 3/2.5 | 1,514 (0%) | 10mo | $224,900 | $149 | 88 |
| 6394 Kennonbriar Ct | 0.05mi | 2/2.5 (-1) | 1,514 (0%) | 7mo | $220,000 | $145 | 87 |
| 2254 Wellington Cir | 0.41mi | 3/2.0 | 1,404 (-7%) | 9mo | $164,000 | $117 | 59 |
| 2736 Parkway Trl | 0.64mi | 3/2.5 | 1,492 (-2%) | 11mo | $193,000 | $129 | 58 |
| 2292 Wellington Cir | 0.32mi | 2/2.0 (-1) | 1,323 (-13%) | 0mo | $183,000 | $138 | 57 |
| 2381 Cove Rd | 0.36mi | 2/2.0 (-1) | 1,296 (-14%) | 3mo | $176,000 | $136 | 50 |
| 2263 Wellington Cir | 0.39mi | 2/2.0 (-1) | 1,296 (-14%) | 2mo | $177,000 | $137 | 49 |
| 2176 Wellington Cir | 0.42mi | 2/2.0 (-1) | 1,296 (-14%) | 0mo | $95,000 | $73 | 49 |
| 849 Hillandale Ln | 0.60mi | 2/2.5 (-1) | 1,355 (-10%) | 1mo | $215,000 | $159 | 49 |
| 2864 Parkway Close | 0.68mi | 3/2.5 | 1,650 (+9%) | 11mo | $217,000 | $132 | 44 |
| 6436 Parkway Trce | 0.63mi | 2/2.5 (-1) | 1,320 (-13%) | 3mo | $189,000 | $143 | 42 |
Match score weights: distance 35% · size 25% · config 20% · recency 20%. Top-matched comps best support the ARV.
Projected returns pro-forma
-3.0% appreciation · 1.18% rent growth · sell at horizon
- IRR
- 2.6%
- Equity multiple
- 1.10×
- Total profit
- $4,079
- Equity at exit
- $21,918
- IRR
- 10.4%
- Equity multiple
- 1.74×
- Total profit
- $30,361
- Equity at exit
- $12,710
Cash invested: $41,160 (down + closing). Projections, not guarantees.
Landlord ↔ Tenant lean methodology
- Overall (STATE)
- 90 Strongly Landlord-Friendly
- State Georgia
- 90 Strongly Landlord-Friendly · R+3
- County
- — inherits STATE
- City
- — inherits STATE
ZIP-level market 30058
- Home prices YoY
- -21.4%
- Rents YoY
- 1.2%
- Active inventory
- 435
- Price-to-rent
- 6.4×
Monthly cashflow live
- Estimated rent
- $1,919 high interval (Pro) →
- Mortgage (P&I)
- −$771
- Tax from tax record
- −$62 /mo · $748/yr
- Insurance
- −$61
- HOA
- −$130
- Vacancy / Maint / Mgmt
- −$403
- Net cashflow
- $492
Break-even live
UW: 25.0% down · 7.5% · 30yr · 1.5% tax · 5.0% vac · 8.0% maint · 8.0% mgmt
Financing live
Cash to close
- Down payment
- $36,750
- Closing costs
- $4,410
- Reserves months
- —
- Total cash needed
- —
Loan-product check · same deal, 3 products live
Conventional
25% down · 7.5% · 30yr
- Down + closing
- —
- Monthly P&I
- —
- Monthly cashflow
- —
- DSCR
- —
- Eligible?
- —
Personal DTI + credit; lowest rate.
DSCR
20% down · 8.5% · 30yr
- Down + closing
- —
- Monthly P&I
- —
- Monthly cashflow
- —
- DSCR
- —
- Eligible?
- —
No personal income docs; deal must DSCR.
Hard money
10% down · 12.0% · 12mo
- Down + closing
- —
- Monthly P&I
- —
- Monthly cashflow
- —
- DSCR
- —
- Eligible?
- —
Short-term bridge; refi at stabilization.
Rent comps 40 comps
| Address | Beds | Baths | Sqft | Rent | $/sqft | DOM | Units | Dist |
|---|---|---|---|---|---|---|---|---|
| 2330 McKenna Square Dr Lithonia, GA | 3.0 | 2.5 | 1514 | $2,075 | $1.37 | 24d | 1 | 0.10mi |
| 6427 Wellington Chase Ct Lithonia, GA | 2.0 | 2.5 | 1258 | $1,640 | $1.30 | 5d | 1 | 0.16mi |
| 6427 Wellington Chase Ct Lithonia, GA | 2.0 | 2.5 | 1258 | $1,695 | $1.35 | 21d | 1 | 0.16mi |
| 6495 Wellington Chase Ct Lithonia, GA | 2.0 | 1.0 | 1533 | $950 | $0.62 | 43d | 1 | 0.18mi |
| 6540 Wellington Chase Ct Lithonia, GA | 3.0 | 2.0 | 1250 | $1,800 | $1.44 | 24d | 1 | 0.20mi |
| 6272 Creekford Dr Lithonia, GA | 3.0 | 2.0 | 1200 | $1,650 | $1.38 | 5d | 1 | 0.25mi |
| 6749 Pole Creek Dr Lithonia, GA | 4.0 | 2.5 | 1882 | $2,195 | $1.17 | 24d | 1 | 0.26mi |
| 6249 Creekford Ln Lithonia, GA | 3.0 | 2.5 | 1352 | $1,586 | $1.17 | 43d | 1 | 0.30mi |
| 2360 Wellington Cir Lithonia, GA | 3.0 | 2.5 | 1404 | $1,900 | $1.35 | 43d | 1 | 0.32mi |
| 3028 Stonebridge Creek Dr Lithonia, GA | 3.0 | 2.0 | 1713 | $1,739 | $1.02 | 16d | 1 | 0.33mi |
| 6229 Creekford Ln Lithonia, GA | 3.0 | 2.0 | 2086 | $1,855 | $0.89 | 2d | 1 | 0.35mi |
| 3010 Stonebridge Creek Dr Lithonia, GA | 3.0 | 2.5 | 1623 | $1,750 | $1.08 | 43d | 1 | 0.36mi |
| 6290 Marbut Farms Ln Lithonia, GA | 3.0 | 2.5 | 1392 | $1,780 | $1.28 | 5d | 1 | 0.41mi |
| 2839 Rambling Way Lithonia, GA | 3.0 | 2.5 | 1623 | $1,700 | $1.05 | 1d | 1 | 0.46mi |
| 2839 Rambling Way Lithonia, GA | 3.0 | 2.5 | 1623 | $1,700 | $1.05 | 18d | 1 | 0.46mi |
| 2144 Marbut Farms Entry Lithonia, GA | 3.0 | 2.0 | 1715 | $1,795 | $1.05 | 43d | 1 | 0.52mi |
| 6258 Marbut Farms Ter Lithonia, GA | 3.0 | 2.0 | 2016 | $1,646 | $0.82 | 24d | 1 | 0.56mi |
| 6162 Dana Ct Lithonia, GA | 4.0 | 3.0 | 1792 | $2,055 | $1.15 | 5d | 1 | 0.56mi |
| 2103 Charles Cudd Ct Lithonia, GA | 3.0 | 2.0 | 1332 | $1,591 | $1.19 | 20d | 1 | 0.58mi |
| 2614 Parkway Trl Lithonia, GA | 3.0 | 2.0 | 1428 | $1,795 | $1.26 | 5d | 1 | 0.62mi |
| 2267 Cherokee Valley Dr Lithonia, GA | 3.0 | 2.0 | 1176 | $1,691 | $1.44 | 5d | 1 | 0.62mi |
| 2070 Corners Cir Lithonia, GA | 3.0 | 2.0 | 1392 | $1,620 | $1.16 | 24d | 1 | 0.64mi |
| 2671 Parkway Trl Lithonia, GA | 2.0 | 2.5 | 1504 | $1,850 | $1.23 | 17d | 1 | 0.64mi |
| 6164 Saint Christophers Ct Lithonia, GA | 3.0 | 2.5 | 1340 | $1,730 | $1.29 | 20d | 1 | 0.65mi |
| 2049 Charter Ln Lithonia, GA | 2.0 | 3.0 | 1152 | $1,695 | $1.47 | 43d | 1 | 0.73mi |
| 564 Hillandale Park Dr Lithonia, GA | 2.0 | 2.0 | 1150 | $2,250 | $1.96 | 43d | 1 | 0.75mi |
| 1964 Corners Cir Lithonia, GA | 4.0 | 2.5 | 2224 | $1,945 | $0.87 | 5d | 1 | 0.77mi |
| 6414 Shalks Crossing Dr Lithonia, GA | 3.0 | 2.5 | 1580 | $2,050 | $1.30 | 5d | 1 | 0.79mi |
| 6426 Charter Way Lithonia, GA | 2.0 | 2.5 | 1166 | $1,700 | $1.46 | 43d | 1 | 0.81mi |
| 6430 Charter Way Lithonia, GA | 3.0 | 2.0 | 1170 | $1,450 | $1.24 | 24d | 1 | 0.81mi |
| 6492 Charter Way Lithonia, GA | 2.0 | 2.5 | 1168 | $1,600 | $1.37 | 12d | 1 | 0.82mi |
| 6256 Hillandale Dr Lithonia, GA | 1.0–3.0 | 1.0–2.0 | 990 | $1,599 | $1.62 | 43d | 1 | 0.83mi |
| 2770 Field Spring Dr Lithonia, GA | 4.0 | 2.5 | 2242 | $1,995 | $0.89 | 43d | 1 | 0.83mi |
| 6158 Raintree Bnd Lithonia, GA | 3.0 | 2.0 | 1429 | $1,856 | $1.30 | 5d | 1 | 0.84mi |
| 6350 Laurel Post Dr Lithonia, GA | 3.0 | 2.0 | 1344 | $1,745 | $1.30 | 43d | 1 | 0.85mi |
| 6416 Phillips Creek Dr Lithonia, GA | 3.0 | 2.0 | 1365 | $1,928 | $1.41 | 5d | 1 | 0.90mi |
| 6012 Wellborn Trl Lithonia, GA | 3.0 | 2.0 | 1510 | $1,760 | $1.17 | 1d | 1 | 0.90mi |
| 6387 Laurel Post Dr Lithonia, GA | 3.0 | 2.5 | 1496 | $1,699 | $1.14 | 43d | 1 | 0.90mi |
| 6514 Eastbriar Dr Lithonia, GA | 3.0 | 2.0 | 1572 | $1,915 | $1.22 | 43d | 1 | 0.93mi |
| 2073 Raintree Pl Lithonia, GA | 3.0 | 2.5 | 1439 | $2,000 | $1.39 | 3d | 1 | 0.95mi |
HOA detail
- Monthly dues
- $130 · $1,560/yr
Listing history 2 events
-
2026-04-11status Under Contract
-
2026-03-16$147,000 New
ⓘ Source: listings_history table (triggers on properties + properties_extension) + one-shot
backfill from property_details.listing_events for pre-trigger history.
Tax reassessment forecast GA · Resets to sale price
- Current annual tax
- $748 · $62/mo
- Projected year-2 tax
- $1,352 · $113/mo
- Expected delta
- +$604/yr (+$50/mo · 80.7%)
ⓘ Screening estimate from a state-policy table — verify with the county assessor before closing.
Climate risk First Street
- Flood 1/10 Low FEMA zone X (unshaded) · 0% chance over 30 yrs
- Wildfire 1/10 Low
- Heat 6/10 Major 7 d/yr ≥105°F today · 19 d/yr by 30 yrs out
- Wind 5/10 Major 23% chance of damaging wind over 30 yrs
- Air quality 5/10 Major 7 unhealthy d/yr today · 10 by 30 yrs out
Nearby sold comps map
Loading sold comps map…
Walkable amenities ~0.75 mi
Loading nearby amenities…
Taxation est. · year 1
- Rental income
- $23,031
- − Mortgage interest
- −$8,234
- − Property taxes
- −$748
- − Insurance
- −$735
- − Repairs & maintenance
- −$1,842
- − Management
- −$1,842
- − HOA
- −$1,560
- − Depreciation
- −$4,276
- Taxable income
- $3,792
- Est. tax owed @ 24.0%
- −$910
- After-tax cash flow
- $4,990/yr
For passive investors: Depreciation is non-cash, so a rental often shows a tax loss while cash-flowing — sheltering income. Rental losses are passive: they offset passive income freely, and up to $25,000/yr can offset ordinary (W-2) income if you actively participate and your MAGI is under $100k (phasing out to $0 by $150k); unused losses carry forward. On sale, claimed depreciation is recaptured at up to 25%, and gains may owe capital-gains tax (a 1031 exchange can defer both). Figures are a year-1 estimate at your 24.0% rate — not tax advice; consult a CPA.
Schools (NCES district)
- District
- Dekalb County
- NCES district ID
- 1301740
- Math proficiency
- 19% ▼ -12.00%
- Reading proficiency
- 28% ▼ -7.00%
- Median HH income
- $51,448
- Composite
- 20.92/100
- National rank
- #8482
- State rank
- #125 of 174 in GA
Livability — Stonecrest
No livability data for this city. (Only ~50 U.S. cities are tracked.)
Census & demographics
- Census place
- Stonecrest, GA
- County
- Dekalb County · 782,738 people
- City population
- 106,165
- Metro
- Atlanta-Sandy Springs-Alpharetta, GA
- Population (ZIP)
- 62,614
- Household income
- $61,684
- Rent vs Own
- Severe rent burden
- 3471.0
Population outlook (DeKalb County) Hauer SSP2
- Today (2025)
- 839,977 people
- By 2030
- 891,768 · +6.2%
- By 2040
- 988,894 · +17.7%
- By 2050
- 1,074,583 · +27.9%
- By 2075
- 1,245,026 · +48.2%
- By 2100
- 1,303,135 · +55.1%
Race, ethnicity, and origin ACS 2023
- Neighborhood character
- Predominantly Black (91%)
- Race & ethnicity
- Black 91% Hispanic / Latino 3% White 3% Two or more races 3%
- Common ancestry
- Hispanic 0%
- Foreign-born
- 12% · Canada, United Kingdom
- Languages at home
- 93% English-only · Spanish 2% French/Haitian/Cajun 1%
Political lean MEDSL · DeKalb
- 2024 margin
- Solid D (+64.8) · D 81.9% · R 17.1% · Other 1.0%
- 2008→2024 swing
- +6.1pp toward D · 2008: 58.6pp · 2024: 64.8pp
- All cycles
- 2024: D+64.8 2020: D+67.4 2016: D+64.8 2012: D+56.8 2008: D+58.6
Not yet ingested
- Civics
- —
Market trends
- HPI YoY
- ▼ -60.90%
- Current HPI
- 224.0366
- Rent YoY
- ▲ 1.18%
- Metro
- Atlanta-Sandy Springs-Alpharetta, GA
- State GDP YoY
- ▲ 2.66%
- F500 in state
- 28
Industry mix (Fortune 500 HQ in GA)
| Industry | F500 HQs | Revenue |
|---|---|---|
| Paper / Packaging | 2 | $29B |
|
||
| Retail | 1 | $160B |
|
||
| Transportation / Logistics | 1 | $91B |
|
||
| Airlines | 1 | $62B |
|
||
| Consumer Goods | 1 | $47B |
|
||
| Utilities | 1 | $25B |
|
||
Price history
2 events — show timeline
- 2026-04-11 Pending — GAMLS
- 2026-03-16 Listed $147,000 GAMLS
Property tax history
+0.5%/yrLatest (2025): $748 · -7.6% YoY. Source: county tax records.
Cash-flow waterfall
monthlySold comps — $/sqft
last 12 mo · ≤1 miLoading sold comps…