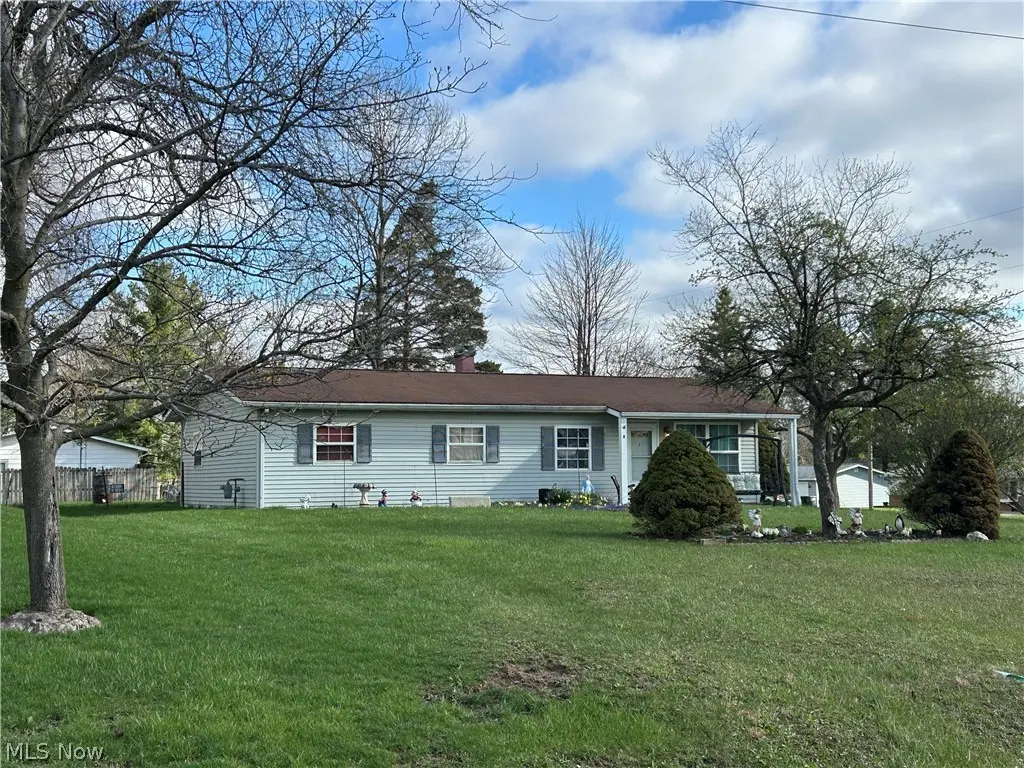
4165 Raymond Dr · Brunswick, OH
Flood risk 1/10 · Minimal
- FEMA flood zone
- X (unshaded)
- Chance of flooding over 30 yrs
- 0.0%
- Est. flood insurance / yr
- $473 – $860
Fire risk 1/10 · Minimal
- Est. fire insurance / yr
- $713 – $1,323
Heat risk 2/10 · Minimal
- Hot days now (above 97°F)
- 7 days/yr
- Hot days in 30 yrs
- 16 days/yr
Wind risk 1/10 · Minimal
- Chance of severe wind over 30 yrs
- —
Air-quality risk 2/10 · Minimal
- Unhealthy air days now
- 1 days/yr
- Unhealthy air days in 30 yrs
- 2 days/yr
Risk factors via First Street. Map © Google.
Why this score? — see what drove the D grade
The composite is a weighted blend of 9 inputs, each scored 0–100. Each bar is that input's sub-score; the figure is the points it added to the 100-point composite (weight × sub-score).
- Cash flow +10.5/30.0
- ARV discount +9.0/15.0
- Schools +5.8/10.0
- Livability +4.0/5.0
- 1% rule +3.1/10.0
- DSCR +3.0/10.0
- Rent growth +2.5/5.0
- Condition / age +2.5/5.0
- Appreciation +0.0/10.0
$235,000
🖨 Deal sheet (PDF) 📄 Offer letter ✓ Due diligence
Listing remarks MLS
Bring your decorating ideas and get a great 4 BR, 1 1/2 bath ranch home on 1/3 acre corner lot. Desirable location in Brunswick school district. Enjoy the convenience of one-floor living in this home owned by the same family since it was built in 1956. Well maintained through the years but ready for cosmetic updates. Features include vaulted ceilings over main living area and handy half-bath off the larger bedroom. Seller is relocating and will need some time after closing to complete his move.
Key facts
- One-floor living
- Vaulted ceilings
- Corner lot
Tags
Neighborhood map
What this means for you Summary
Snapshot
- This is a 4-bed/1.5-bath single-family listed at $235k.
Deal economics
- At list price, monthly cash flow is $-122 ($-1k/yr) — negative.
- To cash-flow at today's rent, offer at most $213k (9.2% below list).
- To meet the 1% rule (rent ≥ 1% of price), the offer needs to be $190k (19.0% below list).
- Recommended offer: $190k (19.0% below list) — sets the bar for 1% rule.
- Cap rate 5.7% vs local median 2.8% in Brunswick — top-decile yield for the area; either an underpriced asset or a hidden risk that comps aren't pricing in. Stress-test before assuming the spread holds.
Location & tenants
- Location reads 80/100 on livability (#135 in OH, #1,940 nationally) — a professional / high-income tenant draw. Strengths: schools A+, crime A+, cost of living A+; Watch: amenities D+, health & safety D, commute F.
- Brunswick City (suburban): math 62% / reading 71% proficiency, ranked #172 of 656 in OH (top 26%) — acceptable for families but not a draw, mixed tenant base, ~2y average lease; only 18% free/reduced lunch — higher-income household profile.
- Market conditions: 181 active listings in the ZIP; 2 comparable units currently listed for rent nearby; solid renter incomes; 471 units permitted in Medina County in 2024 (0 in 5+ unit buildings).
Forward outlook
- Local home prices are declining (-3.0%/yr); year-one equity from $2k of loan paydown is wiped out by about $7k of value loss. Plan a longer hold.
Negotiation context
- It's been on market 75 days — a 6% lower offer ($221k) is reasonable based on typical stale-listing flexibility.
Risks & watch-outs
- Watch-outs: built in 1956 — expect roof / HVAC / electrical / plumbing capex.
Questions for the listing agent
- What do current leases actually rent for vs. the listed asking? Can we see a recent rent roll and the last 12 months of T-12 income?
- It's been on market 75 days. Have you received any prior offers? Is the seller open to a 19% concession, seller financing, or rate buy-down credit?
- Built in 1956 — when were the roof, HVAC, electrical panel, plumbing, and water heater last replaced?
- Why hasn't it sold? Are there any deal-killer items the seller is aware of (foundation, flood, title, zoning, code violations)?
- Is there a deadline driving the sale (1031 exchange, divorce, estate, relocation)? That informs how much negotiation room exists.
- Schools are A-rated — typically a magnet for longer-tenancy family renters. What's the average tenant stay here, and is there a school-zone premium baked into asking?
- The area grade is low — what's the realistic commute time and amenity access for the typical tenant pool here? Any planned neighborhood developments (good or bad) we should know about?
- What's the average days-on-market for RENTAL listings here right now (not sales)? A rising rental-DOM trend means longer vacancies and softer asking-rent achievability than the comps imply.
- What's the recent tenant-quality profile in this submarket — average credit score on applications, eviction rate, late-payment / NSF rate, and stable-employment percentage? A property-management company in the area should have these aggregated.
- How much new for-sale + rental construction is in the pipeline within 1–3 miles? Heavy new supply typically softens prices + rents 12–24 months out; constrained supply supports both.
Investment metrics
- 1% rule
- 0.81% ✗
- Cap rate
- 5.67%
- Cash-on-cash
- -2.22%
- DSCR
- 0.90
- GRM
- 10.3
CMA / ARV
- ARV (median comp)
- $243,315
- List price
- $235,000
- Delta
- -3.42%
- Verdict
- FAIR
- Comps
- 20 within 1.0 mi
Show comp detail 12 sales within ~0.75 mi
| Address | Dist | Beds/Ba | Sqft | Sold | Price | $/sf | Match |
|---|---|---|---|---|---|---|---|
| 4186 Saint James | 0.12mi | 4/1.5 | 1,144 (0%) | 5mo | $244,000 | $213 | 90 |
| 4117 St James Dr | 0.12mi | 4/1.5 | 1,144 (0%) | 12mo | $250,000 | $219 | 85 |
| 4259 Raymond Dr | 0.17mi | 4/1.0 | 1,144 (0%) | 22mo | $180,000 | $157 | 72 |
| 2042 Byron Dr | 0.60mi | 3/2.0 (-1) | 1,144 (0%) | 1mo | $245,000 | $214 | 64 |
| 1727 Brintnall Dr | 0.31mi | 3/1.0 (-1) | 1,248 (+9%) | 8mo | $240,000 | $192 | 57 |
| 4134 Laurel Rd | 0.09mi | 3/1.5 (-1) | 1,004 (-12%) | 20mo | $199,000 | $198 | 54 |
| 2092 Byron Dr | 0.67mi | 3/1.5 (-1) | 1,144 (0%) | 20mo | $226,000 | $198 | 47 |
| 3779 Laurel Rd | 0.74mi | 3/1.0 (-1) | 1,107 (-3%) | 18mo | $210,000 | $190 | 38 |
| 4240 Oxford Dr | 0.56mi | 3/1.0 (-1) | 1,025 (-10%) | 20mo | $218,875 | $214 | 33 |
| 1524 Andrea Dr | 0.70mi | 3/2.0 (-1) | 977 (-15%) | 8mo | $265,000 | $271 | 30 |
| 1512 Harvard Dr | 0.62mi | 3/1.0 (-1) | 1,304 (+14%) | 19mo | $255,000 | $196 | 25 |
| 1946 Rocklyn Dr | 0.70mi | 3/1.0 (-1) | 1,300 (+14%) | 18mo | $225,000 | $173 | 23 |
Match score weights: distance 35% · size 25% · config 20% · recency 20%. Top-matched comps best support the ARV.
Projected returns pro-forma
-3.0% appreciation · 3.0% rent growth · sell at horizon
- IRR
- -20.0%
- Equity multiple
- 0.30×
- Total profit
- $-45,805
- Equity at exit
- $35,039
- IRR
- -12.9%
- Equity multiple
- 0.24×
- Total profit
- $-49,752
- Equity at exit
- $20,319
Cash invested: $65,800 (down + closing). Projections, not guarantees.
Landlord ↔ Tenant lean methodology
- Overall (STATE)
- 73 Landlord-Friendly
- State Ohio
- 73 Landlord-Friendly · R+6
- County
- — inherits STATE
- City
- — inherits STATE
ZIP-level market 44212
- Active inventory
- 181
- Price-to-rent
- 10.3×
Monthly cashflow live
- Estimated rent
- $1,903 medium interval (Pro) →
- Mortgage (P&I)
- −$1,232
- Tax from tax record
- −$295 /mo · $3,537/yr
- Insurance
- −$98
- HOA
- −$0
- Vacancy / Maint / Mgmt
- −$400
- Net cashflow
- $-122
Break-even live
Sensitivity live
| Price | -10% $11 | -5% $-55 | +0% $-122 | +5% $-188 | +10% $-255 |
|---|---|---|---|---|---|
| Rent | -10% $-272 | -5% $-197 | +0% $-122 | +5% $-47 | +10% $29 |
| Rate | -1.0pp $-3 | -0.5pp $-62 | base $-122 | +0.5pp $-183 | +1.0pp $-245 |
UW: 25.0% down · 7.5% · 30yr · 1.5% tax · 5.0% vac · 8.0% maint · 8.0% mgmt
Financing live
Cash to close
- Down payment
- $58,750
- Closing costs
- $7,050
- Reserves months
- —
- Total cash needed
- —
Loan-product check · same deal, 3 products live
Conventional
25% down · 7.5% · 30yr
- Down + closing
- —
- Monthly P&I
- —
- Monthly cashflow
- —
- DSCR
- —
- Eligible?
- —
Personal DTI + credit; lowest rate.
DSCR
20% down · 8.5% · 30yr
- Down + closing
- —
- Monthly P&I
- —
- Monthly cashflow
- —
- DSCR
- —
- Eligible?
- —
No personal income docs; deal must DSCR.
Hard money
10% down · 12.0% · 12mo
- Down + closing
- —
- Monthly P&I
- —
- Monthly cashflow
- —
- DSCR
- —
- Eligible?
- —
Short-term bridge; refi at stabilization.
Rent comps 2 comps
| Address | Beds | Baths | Sqft | Rent | $/sqft | DOM | Units | Dist |
|---|---|---|---|---|---|---|---|---|
| 4095 Sleepy Hollow Rd Brunswick, OH | 3.0 | 1.0 | 1124 | $1,650 | $1.47 | 15d | 1 | 0.60mi |
| 4241 Manhattan Ave Unit 4241 4 Brunswick, OH | 3.0 | 1.5 | 926 | $1,400 | $1.51 | 44d | 1 | 0.84mi |
Listing history 16 events
-
2026-06-21days on market $235,000 Active 75 DOM
-
2026-06-18days on market $235,000 Active 72 DOM
-
2026-06-17days on market $235,000 Active 71 DOM
-
2026-06-16days on market $235,000 Active 70 DOM
-
2026-06-15days on market $235,000 Active 69 DOM
-
2026-06-13days on market $235,000 Active 67 DOM
-
2026-06-13days on market $235,000 Active 66 DOM
-
2026-06-09days on market $235,000 Active 63 DOM
-
2026-06-08days on market $235,000 Active 62 DOM
-
2026-06-07days on market $235,000 Active 61 DOM
-
2026-06-05days on market $235,000 Active 58 DOM
-
2026-06-03days on market $235,000 Active 57 DOM
-
2026-06-02days on market $235,000 Active 56 DOM
-
2026-06-01days on market $235,000 Active 55 DOM
-
2026-05-31days on market $235,000 Active 54 DOM
-
2026-04-06$235,000 Active 499-char remark
Show marketing remark (499 chars)
Bring your decorating ideas and get a great 4 BR, 1 1/2 bath ranch home on 1/3 acre corner lot. Desirable location in Brunswick school district. Enjoy the convenience of one-floor living in this home owned by the same family since it was built in 1956. Well maintained through the years but ready for cosmetic updates. Features include vaulted ceilings over main living area and handy half-bath off the larger bedroom. Seller is relocating and will need some time after closing to complete his move.
ⓘ Source: listings_history table (triggers on properties + properties_extension) + one-shot
backfill from property_details.listing_events for pre-trigger history.
Tax reassessment forecast OH · Partial reset (capped growth)
- Current annual tax
- $3,537 · $295/mo
- Projected year-2 tax
- $3,601 · $300/mo
- Expected delta
- +$65/yr (+$5/mo · 1.8%)
ⓘ Screening estimate from a state-policy table — verify with the county assessor before closing.
Climate risk First Street
- Flood 1/10 Low FEMA zone X (unshaded) · 0% chance over 30 yrs
- Wildfire 1/10 Low
- Heat 2/10 Low 7 d/yr ≥97°F today · 16 d/yr by 30 yrs out
- Wind 1/10 Low
- Air quality 2/10 Low 1 unhealthy d/yr today · 2 by 30 yrs out
Nearby sold comps map
Loading sold comps map…
Walkable amenities ~0.75 mi
Loading nearby amenities…
Taxation est. · year 1
- Rental income
- $22,834
- − Mortgage interest
- −$13,164
- − Property taxes
- −$3,537
- − Insurance
- −$1,175
- − Repairs & maintenance
- −$1,827
- − Management
- −$1,827
- − Depreciation
- −$6,836
- Taxable loss
- −$5,531
- Est. tax savings @ 24.0%
- +$1,327
- After-tax cash flow
- $-134/yr
For passive investors: Depreciation is non-cash, so a rental often shows a tax loss while cash-flowing — sheltering income. Rental losses are passive: they offset passive income freely, and up to $25,000/yr can offset ordinary (W-2) income if you actively participate and your MAGI is under $100k (phasing out to $0 by $150k); unused losses carry forward. On sale, claimed depreciation is recaptured at up to 25%, and gains may owe capital-gains tax (a 1031 exchange can defer both). Figures are a year-1 estimate at your 24.0% rate — not tax advice; consult a CPA.
Schools (NCES district)
- District
- Brunswick City
- NCES district ID
- 3904366
- Math proficiency
- 62% ▼ -11.00%
- Reading proficiency
- 71% ▼ -5.00%
- Median HH income
- $65,415
- Composite
- 57.91/100
- National rank
- #1043
- State rank
- #172 of 656 in OH
Livability — Brunswick
- Score
- 80/100
- State rank
- #135
- US rank
- #1940
Category grades
Schools grade is shown separately in the Schools card above.
Census & demographics
- Census place
- Brunswick, OH
- County
- Medina County · 145,517 people
- City population
- 45,889
- Metro
- Cleveland-Elyria, OH
- Population (ZIP)
- 45,889
- Household income
- $91,441
- Rent vs Own
- Severe rent burden
- 983.0
Population outlook (Medina County) Hauer SSP2
- Today (2025)
- 185,249 people
- By 2030
- 188,174 · +1.6%
- By 2040
- 190,350 · +2.8%
- By 2050
- 187,283 · +1.1%
- By 2075
- 177,108 · -4.4%
- By 2100
- 151,304 · -18.3%
Race, ethnicity, and origin ACS 2023
- Neighborhood character
- Predominantly White (89%)
- Race & ethnicity
- White 89% Two or more races 6% Hispanic / Latino 4% Asian 1% Black 1%
- Common ancestry
- Romanian 10% Lithuanian 2% Subsaharan African 2%
- Foreign-born
- 4% · Canada
- Languages at home
- 95% English-only · Russian/Polish/Slavic 2% Other Indo-European 1% Spanish 1%
Political lean MEDSL · Medina
- 2024 margin
- Strong R (+24.8) · D 37.2% · R 62.0%
- 2008→2024 swing
- -16.8pp toward R · 2008: -8.0pp · 2024: -24.8pp
- All cycles
- 2024: R+24.8 2020: R+23.4 2016: R+24.9 2012: R+13.1 2008: R+8.0
Not yet ingested
- Civics
- —
Market trends
- HPI YoY
- ▼ -213.80%
- Current HPI
- 249.3306
- Rent YoY
- —
- Metro
- Cleveland-Elyria, OH
- State GDP YoY
- ▲ 1.98%
- F500 in state
- 48
Industry mix (Fortune 500 HQ in OH)
| Industry | F500 HQs | Revenue |
|---|---|---|
| Insurance | 3 | $145B |
|
||
| Industrial Machinery | 3 | $49B |
|
||
| Financial Services | 3 | $24B |
|
||
| Consumer Goods | 2 | $93B |
|
||
| Aerospace / Defense | 2 | $47B |
|
||
| Utilities | 2 | $33B |
|
||
Price history
1 event — show timeline
- 2026-04-06 Listed $235,000 MLSNOW
Property tax history
+12.2%/yrLatest (2025): $3,537 · +93.5% YoY. Source: county tax records.
Cash-flow waterfall
monthlySold comps — $/sqft
last 12 mo · ≤1 miLoading sold comps…