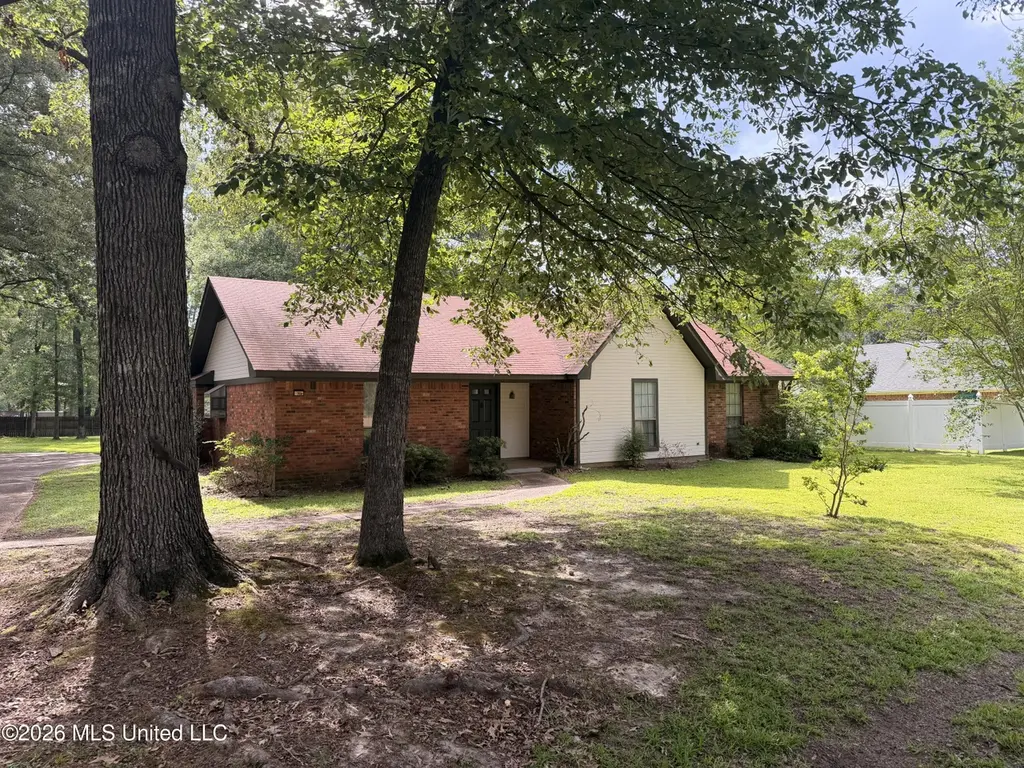
141 Plum Tree Rd · Flowood, MS
Flood risk 1/10 · Minimal
- FEMA flood zone
- X (unshaded)
- Chance of flooding over 30 yrs
- 0.0%
- Est. flood insurance / yr
- $507 – $1,088
Fire risk 2/10 · Minimal
- Est. fire insurance / yr
- $1,241 – $2,305
Heat risk 7/10 · Major
- Hot days now (above 108°F)
- 7 days/yr
- Hot days in 30 yrs
- 20 days/yr
Wind risk 8/10 · Major
- Chance of severe wind over 30 yrs
- 80.0%
Air-quality risk 2/10 · Minimal
- Unhealthy air days now
- 1 days/yr
- Unhealthy air days in 30 yrs
- 1 days/yr
Risk factors via First Street. Map © Google.
Why this score? — see what drove the B+ grade
The composite is a weighted blend of 9 inputs, each scored 0–100. Each bar is that input's sub-score; the figure is the points it added to the 100-point composite (weight × sub-score).
- Cash flow +30.0/30.0
- ARV discount +15.0/15.0
- DSCR +10.0/10.0
- 1% rule +8.5/10.0
- Schools +4.6/10.0
- Livability +3.9/5.0
- Rent growth +3.2/5.0
- Condition / age +2.5/5.0
- Appreciation +0.0/10.0
$152,900
🖨 Deal sheet (PDF) 📄 Offer letter ✓ Due diligence
Listing remarks
Investor opportunity in the heart of the Reservoir area! This 3-bedroom, 2-bath home offers 1,758 square feet situated on a large, level lot with a 2-car carport and storage building. This estate property is being sold strictly AS-IS. Due to its condition, the property will not qualify for traditional financing and is best suited for cash buyers or renovation financing. Conveniently located near the Reservoir, shopping, dining, and everyday amenities. Great potential for investors, or those seeking their next project. Don't miss this opportunity to bring new life to a property in a desirable location.
Key facts
- 2 car carport
- Storage building
- Large level lot
Tags
Property features AI
Exterior
- Parking: 2 carport spaces; Total 4 parking spaces; Garage faces side; Storage; Concrete parking surface
- Security: See remarks for security features
- Utilities: Public water; Public sewer; Cable available; Electricity available; Natural gas available
- Home design: Single-family house; One level
- Construction: Brick veneer exterior; Asphalt shingle roof; Slab foundation; Built as a fixer property
- Exterior features: Patio; Portable building; See remarks for additional exterior details
Interior
- Kitchen: See remarks for appliances and kitchen details
- Flooring: See remarks for flooring details
- Bathrooms: 2 full bathrooms
- Heating & cooling: Central heating; Central air conditioning
- Interior features: Fireplace in the den; Aluminum window frames; Deadbolt locks; See remarks for additional interior details
- Laundry & utility: Washer hookup; Electric dryer hookup
Neighborhood map
What this means for you Summary
Snapshot
- This is a 3-bed/1.0-bath single-family listed at $153k.
Deal economics
- At list price, monthly cash flow is $739 ($9k/yr) — positive.
- The deal already cash-flows at list — no discount required.
- Meets the 1% rule at list price ($2k rent vs $153k).
- Recommended offer: $151k (1.5% below list) — sets the bar for market timing.
- Cap rate 12.1% vs local median 4.3% in Flowood — top-decile yield for the area; either an underpriced asset or a hidden risk that comps aren't pricing in. Stress-test before assuming the spread holds.
Location & tenants
- Location reads 77/100 on livability (#10 in MS, #3,075 nationally) — a middle-class / working-renter tenant base. Strengths: crime A+, cost of living A+, housing A+; Watch: amenities F, commute F.
- Rankin County School District (rural): math 56% / reading 48% proficiency, ranked #6 of 130 in MS (top 5%) — acceptable for families but not a draw, mixed tenant base, ~2y average lease.
- Zoned schools: Highland Bluff Elementary (math 52% / reading 50%, grade C-, #58 of 375 statewide, top 15%, 577 students, 100% FRL); Northwest Rankin Middle School (math 63% / reading 51%, grade B, #13 of 179 statewide, top 7%, 1,374 students, 100% FRL); Northwest Rankin High School (math 48% / reading 42%, grade D-, #34 of 197 statewide, top 17%, 1,898 students, 100% FRL) — zoned schools average 100% FRL vs 35% district-wide (65 pts higher); higher-poverty schools than district average — tighter screening recommended.
- Market conditions: Rents rising (+2.9%/yr); 433 active listings in the ZIP; 10 comparable units currently listed for rent nearby; rentals at typical pace (median 25d on market — plan ~3-4 weeks tenant-placement turnaround); 40% of comp listings sitting > 30 days — soft ceiling on asking rent; solid renter incomes; 343 units permitted in Rankin County in 2024 (0 in 5+ unit buildings).
Forward outlook
- Local home prices are declining (-3.0%/yr); year-one equity from $1k of loan paydown is wiped out by about $5k of value loss. Plan a longer hold.
- Rankin County population projected at +17% by 2050 — long-run rental-demand tailwind backs the buy-and-hold thesis.
- At projected returns (-3.0% appreciation + 2.9% rent growth), your $43k cash investment doubles in ~6 years — after that, you're playing with house money.
Negotiation context
- It's been on market 19 days — a 2% lower offer ($151k) is reasonable based on typical stale-listing flexibility.
- Current owner paid $70k; list at $153k implies a 118% gain — meaningful room to come down on a strong offer.
Risks & watch-outs
- Climate carrying-cost: severe wind risk, 80% chance of damaging wind over 30y; extreme-heat days projected 7→20/yr by 2055 (HVAC capex compounding) — expect insurance premiums to compound above CPI over the hold.
Questions for the listing agent
- Is there a deadline driving the sale (1031 exchange, divorce, estate, relocation)? That informs how much negotiation room exists.
- Schools are B-rated — typically a magnet for longer-tenancy family renters. What's the average tenant stay here, and is there a school-zone premium baked into asking?
- What's the average days-on-market for RENTAL listings here right now (not sales)? A rising rental-DOM trend means longer vacancies and softer asking-rent achievability than the comps imply.
- What's the recent tenant-quality profile in this submarket — average credit score on applications, eviction rate, late-payment / NSF rate, and stable-employment percentage? A property-management company in the area should have these aggregated.
- How much new for-sale + rental construction is in the pipeline within 1–3 miles? Heavy new supply typically softens prices + rents 12–24 months out; constrained supply supports both.
Investment metrics
- 1% rule
- 1.35% ✓
- Cap rate
- 12.10%
- Cash-on-cash
- 20.73%
- DSCR
- 1.92
- GRM
- 6.2
CMA / ARV
- ARV (on-the-fly)
- $297,102
- Comps found
- 12
Show comp detail 12 sales within ~0.75 mi
| Address | Dist | Beds/Ba | Sqft | Sold | Price | $/sf | Match |
|---|---|---|---|---|---|---|---|
| 243 E Pinebrook Dr | 0.18mi | 3/2.0 | 1,688 (-4%) | 4mo | $279,900 | $166 | 78 |
| 707 Tortoise Rdg | 0.35mi | 3/2.0 | 1,775 (+1%) | 4mo | $310,000 | $175 | 74 |
| 126 Plum Tree Rd | 0.08mi | 3/3.0 | 1,935 (+10%) | 3mo | $259,900 | $134 | 69 |
| 148 W Pinebrook Dr | 0.29mi | 3/2.0 | 1,604 (-9%) | 0mo | $289,900 | $181 | 68 |
| 572 Turtle Ln | 0.55mi | 3/2.0 | 1,779 (+1%) | 5mo | $335,000 | $188 | 64 |
| 813 Terrapin Ln | 0.37mi | 3/2.0 | 1,935 (+10%) | 2mo | $299,900 | $155 | 60 |
| 159 Regatta Dr | 0.74mi | 3/2.0 | 1,715 (-2%) | 3mo | $289,900 | $169 | 55 |
| 913 Sea Turtle Cv | 0.41mi | 3/2.5 | 1,945 (+11%) | 5mo | $279,900 | $144 | 53 |
| 354 Kings Ridge Cir | 0.75mi | 4/2.0 (+1) | 1,766 (+0%) | 4mo | $280,000 | $159 | 52 |
| 311 Camber Ct | 0.74mi | 3/2.0 | 1,625 (-8%) | 2mo | $278,500 | $171 | 47 |
| 164 Regatta Dr | 0.74mi | 3/2.0 | 1,566 (-11%) | 0mo | $280,000 | $179 | 43 |
| 371 Avalon Way | 0.69mi | 4/2.0 (+1) | 1,927 (+10%) | 1mo | $249,900 | $130 | 42 |
Match score weights: distance 35% · size 25% · config 20% · recency 20%. Top-matched comps best support the ARV.
Projected returns pro-forma
-3.0% appreciation · 2.9% rent growth · sell at horizon
- IRR
- 12.9%
- Equity multiple
- 1.51×
- Total profit
- $22,045
- Equity at exit
- $22,798
- IRR
- 21.7%
- Equity multiple
- 2.84×
- Total profit
- $78,716
- Equity at exit
- $13,220
Cash invested: $42,812 (down + closing). Projections, not guarantees.
Landlord ↔ Tenant lean methodology
- Overall (STATE)
- 90 Strongly Landlord-Friendly
- State Mississippi
- 90 Strongly Landlord-Friendly · R+11
- County
- — inherits STATE
- City
- — inherits STATE
ZIP-level market 39047
- Home prices YoY
- -32.6%
- Rents YoY
- 2.9%
- Active inventory
- 433
- Price-to-rent
- 6.2×
Monthly cashflow live
- Estimated rent
- $2,071 high interval (Pro) →
- Mortgage (P&I)
- −$802
- Tax from tax record
- −$31 /mo · $373/yr
- Insurance
- −$64
- HOA
- −$0
- Vacancy / Maint / Mgmt
- −$435
- Net cashflow
- $739
Break-even live
Sensitivity live
| Price | -10% $826 | -5% $783 | +0% $739 | +5% $696 | +10% $653 |
|---|---|---|---|---|---|
| Rent | -10% $576 | -5% $658 | +0% $739 | +5% $821 | +10% $903 |
| Rate | -1.0pp $816 | -0.5pp $778 | base $739 | +0.5pp $700 | +1.0pp $660 |
UW: 25.0% down · 7.5% · 30yr · 1.5% tax · 5.0% vac · 8.0% maint · 8.0% mgmt
Financing live
Cash to close
- Down payment
- $38,225
- Closing costs
- $4,587
- Reserves months
- —
- Total cash needed
- —
Loan-product check · same deal, 3 products live
Conventional
25% down · 7.5% · 30yr
- Down + closing
- —
- Monthly P&I
- —
- Monthly cashflow
- —
- DSCR
- —
- Eligible?
- —
Personal DTI + credit; lowest rate.
DSCR
20% down · 8.5% · 30yr
- Down + closing
- —
- Monthly P&I
- —
- Monthly cashflow
- —
- DSCR
- —
- Eligible?
- —
No personal income docs; deal must DSCR.
Hard money
10% down · 12.0% · 12mo
- Down + closing
- —
- Monthly P&I
- —
- Monthly cashflow
- —
- DSCR
- —
- Eligible?
- —
Short-term bridge; refi at stabilization.
Rent comps 10 comps
| Address | Beds | Baths | Sqft | Rent | $/sqft | DOM | Units | Dist |
|---|---|---|---|---|---|---|---|---|
| 154 Plum Tree Rd Brandon, MS | 3.0 | 2.0 | 1289 | $1,931 | $1.50 | 24d | 1 | 0.08mi |
| 199 Dogwood Cir Brandon, MS | 3.0 | 2.0 | 1550 | $1,900 | $1.23 | 45d | 1 | 0.19mi |
| 218 Shenandoah Rd N Brandon, MS | 3.0 | 2.0 | 1625 | $2,006 | $1.23 | 45d | 1 | 0.37mi |
| 133 Cumberland Rd Brandon, MS | 4.0 | 3.0 | 1846 | $2,225 | $1.21 | 24d | 1 | 0.62mi |
| 413 Shenandoah Rd N Brandon, MS | 4.0 | 2.0 | 1715 | $2,056 | $1.20 | 15d | 1 | 0.63mi |
| 500 Avalon Way Brandon, MS | 2.0–3.0 | 2.0 | 1287 | $2,052 | $1.59 | 15d | 6 | 0.65mi |
| 352 Brendalwood Cv Brandon, MS | 2.0 | 1.5 | 1248 | $1,157 | $0.93 | 45d | 1 | 0.77mi |
| 538 Brighton Cir Brandon, MS | 4.0 | 2.0 | 2042 | $2,395 | $1.17 | 15d | 1 | 1.02mi |
| 301 Jasmine Ct Brandon, MS | 3.0 | 2.0 | 1805 | $2,200 | $1.22 | 45d | 1 | 1.12mi |
| 111 Lakeshore Dr Brandon, MS | 1.0–3.0 | 1.0–2.0 | 974 | $2,218 | $2.28 | 15d | 8 | 1.44mi |
Listing history 15 events
-
2026-06-18days on market $152,900 Active 19 DOM
-
2026-06-17days on market $152,900 Active 18 DOM
-
2026-06-16days on market $152,900 Active 17 DOM
-
2026-06-15days on market $152,900 Active 16 DOM
-
2026-06-14days on market $152,900 Active 14 DOM
-
2026-06-13days on market $152,900 Active 13 DOM
-
2026-06-10days on market $152,900 Active 11 DOM
-
2026-06-09days on market $152,900 Active 10 DOM
-
2026-06-08days on market $152,900 Active 9 DOM
-
2026-06-07days on market $152,900 Active 8 DOM
-
2026-06-03days on market $152,900 Active 4 DOM
-
2026-06-02days on market $152,900 Active 3 DOM
-
2026-06-01days on market $152,900 Active 2 DOM
-
2026-05-31remarks 608-char remark
-
2026-05-31$152,900 Active 1 DOM
ⓘ Source: listings_history table (triggers on properties + properties_extension) + one-shot
backfill from property_details.listing_events for pre-trigger history.
Tax reassessment forecast MS · Resets to sale price
- Current annual tax
- $373 · $31/mo
- Projected year-2 tax
- $1,208 · $101/mo
- Expected delta
- +$835/yr (+$70/mo · 224.2%)
ⓘ Screening estimate from a state-policy table — verify with the county assessor before closing.
Climate risk First Street
- Flood 1/10 Low FEMA zone X (unshaded) · 0% chance over 30 yrs
- Wildfire 2/10 Low
- Heat 7/10 Severe 7 d/yr ≥108°F today · 20 d/yr by 30 yrs out
- Wind 8/10 Severe 80% chance of damaging wind over 30 yrs
- Air quality 2/10 Low 1 unhealthy d/yr today · 1 by 30 yrs out
Nearby sold comps map
Loading sold comps map…
Walkable amenities ~0.75 mi
Loading nearby amenities…
Taxation est. · year 1
- Rental income
- $24,851
- − Mortgage interest
- −$8,565
- − Property taxes
- −$373
- − Insurance
- −$764
- − Repairs & maintenance
- −$1,988
- − Management
- −$1,988
- − Depreciation
- −$4,448
- Taxable income
- $6,725
- Est. tax owed @ 24.0%
- −$1,614
- After-tax cash flow
- $7,260/yr
For passive investors: Depreciation is non-cash, so a rental often shows a tax loss while cash-flowing — sheltering income. Rental losses are passive: they offset passive income freely, and up to $25,000/yr can offset ordinary (W-2) income if you actively participate and your MAGI is under $100k (phasing out to $0 by $150k); unused losses carry forward. On sale, claimed depreciation is recaptured at up to 25%, and gains may owe capital-gains tax (a 1031 exchange can defer both). Figures are a year-1 estimate at your 24.0% rate — not tax advice; consult a CPA.
Schools (NCES district)
- District
- Rankin County School District
- NCES district ID
- 2803830
- Math proficiency
- 56% ▼ -4.00%
- Reading proficiency
- 48% ▼ -6.00%
- Median HH income
- $61,867
- Composite
- 45.62/100
- National rank
- #2587
- State rank
- #6 of 130 in MS
Livability — Flowood
- Score
- 77/100
- State rank
- #10
- US rank
- #3075
Category grades
Schools grade is shown separately in the Schools card above.
Census & demographics
- County
- Rankin County · 123,614 people
- City population
- 9,222
- Metro
- Jackson, MS
- Population (ZIP)
- 40,808
- Household income
- $100,347
- Rent vs Own
- Severe rent burden
- 551.0
Population outlook (Rankin County) Hauer SSP2
- Today (2025)
- 164,317 people
- By 2030
- 171,013 · +4.1%
- By 2040
- 182,723 · +11.2%
- By 2050
- 192,376 · +17.1%
- By 2075
- 209,535 · +27.5%
- By 2100
- 209,534 · +27.5%
Race, ethnicity, and origin ACS 2023
- Neighborhood character
- Predominantly White (77%)
- Race & ethnicity
- White 77% Black 16% Two or more races 4% Hispanic / Latino 2% Asian 1%
- Common ancestry
- Italian 4% Slovak 3% Serbian 3%
- Foreign-born
- 3% · Canada
- Languages at home
- 95% English-only · Spanish 3% Other Indo-European 1% Other Asian/Pacific 1%
Political lean MEDSL · Rankin
- 2024 margin
- Solid R (+47.1) · D 25.9% · R 73.0% · Other 1.0%
- 2008→2024 swing
- +6.4pp toward D · 2008: -53.5pp · 2024: -47.1pp
- All cycles
- 2024: R+47.1 2020: R+45.4 2016: R+52.9 2012: R+51.9 2008: R+53.5
Not yet ingested
- Civics
- —
Market trends
- HPI YoY
- ▼ -79.01%
- Current HPI
- 162.9709
- Rent YoY
- ▲ 2.90%
- Metro
- Jackson, MS
- State GDP YoY
- —
- F500 in state
- 0
Price history
+118.4% since first listed2 events — show timeline
- 2026-05-30 Listed $152,900 MLSU
- 2004-06-24 Sold (Public Records) $70,000 Public Records
Property tax history
+2.3%/yrLatest (2025): $373 · +5.4% YoY. Source: county tax records.
Cash-flow waterfall
monthlySold comps — $/sqft
last 12 mo · ≤1 miLoading sold comps…