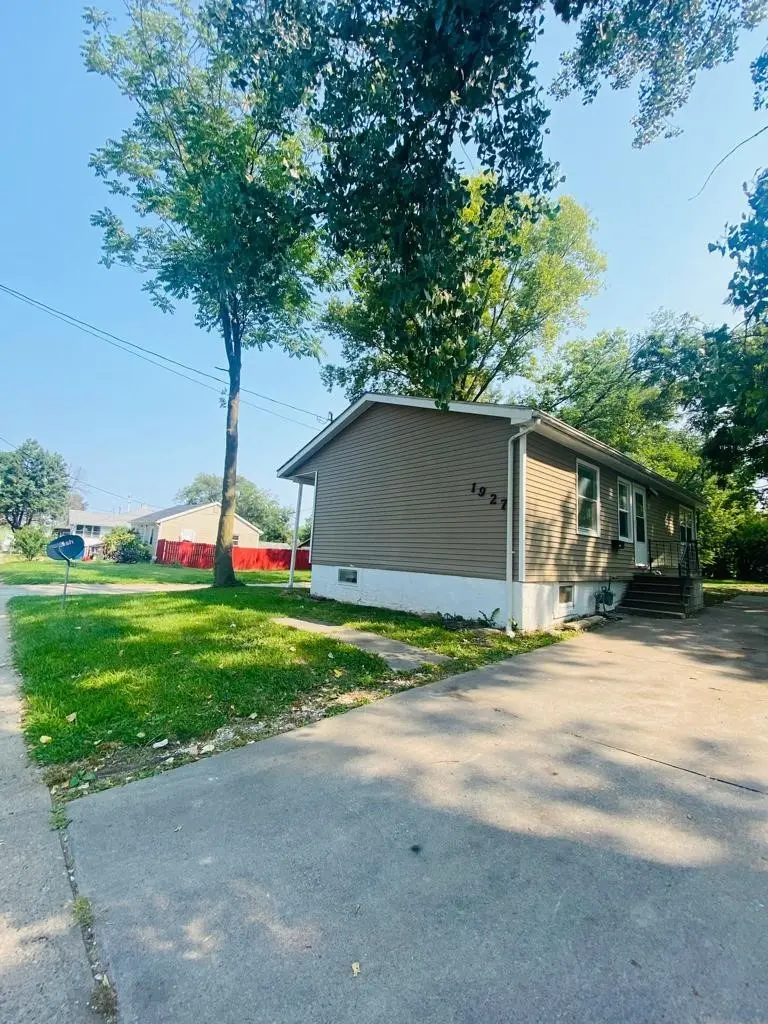
1927 22nd St · Des Moines, IA
Flood risk 1/10 · Minimal
- FEMA flood zone
- X (unshaded)
- Chance of flooding over 30 yrs
- 0.0%
- Est. flood insurance / yr
- $473 – $860
Fire risk 1/10 · Minimal
- Est. fire insurance / yr
- $902 – $1,676
Heat risk 3/10 · Minor
- Hot days now (above 103°F)
- 7 days/yr
- Hot days in 30 yrs
- 15 days/yr
Wind risk 2/10 · Minimal
- Chance of severe wind over 30 yrs
- —
Air-quality risk 2/10 · Minimal
- Unhealthy air days now
- 1 days/yr
- Unhealthy air days in 30 yrs
- 2 days/yr
Risk factors via First Street. Map © Google.
Why this score? — see what drove the D+ grade
The composite is a weighted blend of 9 inputs, each scored 0–100. Each bar is that input's sub-score; the figure is the points it added to the 100-point composite (weight × sub-score).
- ARV discount +15.0/15.0
- Cash flow +13.1/30.0
- Livability +4.0/5.0
- DSCR +3.9/10.0
- Schools +3.8/10.0
- 1% rule +3.6/10.0
- Rent growth +3.4/5.0
- Condition / age +2.5/5.0
- Appreciation +0.0/10.0
$110,000
🖨 Deal sheet (PDF) 📄 Offer letter ✓ Due diligence
Listing remarks
Welcome to 1927 22nd St in Des Moines a home full of space, comfort, and endless possibilities. From the moment you walk in, you’ll notice the generous storage areas and functional layout designed for everyday living. Step through the patio door onto a cozy deck, the perfect spot to enjoy your morning coffee, relax after work, or unwind on a peaceful evening. The unfinished basement offers incredible potential for extra storage, a workshop, gym, entertainment area, or the ultimate man cave. Sitting on nearly a quarter-acre lot, this property gives you more breathing room and privacy than many homes in the area, while still being just minutes from MLK Boulevard for quick access through
Key facts
- Unfinished basement
- Quick access
- Functional layout
Tags
Property features AI
Exterior
- Utilities: Public water; Public sewer
- Home design: Single-family property
- Construction: Brick/mortar foundation; Asphalt shingle roof
- Exterior features: Asphalt road frontage; Lot dimensions roughly 50 x 209
Interior
- Bedrooms: 2 main-level bedrooms
- Bathrooms: 1 full bathroom
- Heating & cooling: Forced air heating; Natural gas heating; Electric heating; Window unit cooling
- Interior features: Window air conditioning units; Forced air heating; Natural gas heating; Electric heating
Neighborhood map
What this means for you Summary
Snapshot
- This is a 2-bed/1.0-bath single-family listed at $110k.
Deal economics
- At list price, monthly cash flow is $-5 ($-58/yr) — negative.
- To cash-flow at today's rent, offer at most $109k (0.8% below list).
- To meet the 1% rule (rent ≥ 1% of price), the offer needs to be $95k (13.8% below list).
- Recommended offer: $95k (13.8% below list) — sets the bar for 1% rule.
- Cap rate 6.2% vs local median 3.1% in Des Moines — top-decile yield for the area; either an underpriced asset or a hidden risk that comps aren't pricing in. Stress-test before assuming the spread holds.
Location & tenants
- Location reads 81/100 on livability (#63 in IA, #1,432 nationally) — a professional / high-income tenant draw. Strengths: commute A+, cost of living A+, housing A+; Watch: employment C-, crime F.
- Des Moines Independent Community School District (urban): math 43% / reading 46% proficiency, ranked #289 of 289 in IA (top 100%) — families likely to look elsewhere, expect single-tenant / working-renter base with shorter leases; 63% free/reduced lunch — lower-income household profile, screen leases tightly.
- Zoned schools: Monroe Elementary School (math 30% / reading 27%, grade F, #606 of 616 statewide, top 98%, 423 students, 95% FRL); Meredith Middle School (math 40% / reading 40%, grade F, #239 of 246 statewide, top 97%, 664 students, 84% FRL); Hoover High School (math 46% / reading 55%, grade D+, #311 of 336 statewide, top 93%, 991 students, 78% FRL) — zoned schools average 86% FRL vs 63% district-wide (23 pts higher); higher-poverty schools than district average — tighter screening recommended.
- Market conditions: Rents rising (+3.7%/yr); 260 active listings in the ZIP; 40 comparable units currently listed for rent nearby; rentals lingering (median 46d on market — plan ~5-8 weeks vacancy on turnover, expect pricing pressure); 50% of comp listings sitting > 30 days — soft ceiling on asking rent; solid renter incomes; 2,953 units permitted in Polk County in 2024 (540 in 5+ unit buildings).
- This rent is only 15% of the median local income ($76k/yr) — well below the 30% rent-burden line; pricing power to push rent on renewal without tenant pushback.
Forward outlook
- Local home prices are declining (-3.0%/yr); year-one equity from $761 of loan paydown is wiped out by about $3k of value loss. Plan a longer hold.
- Polk County population projected at +37% by 2050 — long-run rental-demand tailwind backs the buy-and-hold thesis.
Negotiation context
- It's been on market 32 days — a 3% lower offer ($107k) is reasonable based on typical stale-listing flexibility.
- 4 sale attempts since 21y ago with the ask held roughly flat each time — persistent listings suggest the price (not the market) is what's stuck; bring a comps-based counter.
Risks & watch-outs
- Watch-outs: built in 1913 — expect roof / HVAC / electrical / plumbing capex.
Questions for the listing agent
- What do current leases actually rent for vs. the listed asking? Can we see a recent rent roll and the last 12 months of T-12 income?
- It's been on market 32 days. Have you received any prior offers? Is the seller open to a 14% concession, seller financing, or rate buy-down credit?
- Built in 1913 — when were the roof, HVAC, electrical panel, plumbing, and water heater last replaced?
- Is there a deadline driving the sale (1031 exchange, divorce, estate, relocation)? That informs how much negotiation room exists.
- Schools are D-rated, which usually means shorter tenancies and higher turnover. Who's the typical renter profile here, and what's been the actual vacancy rate?
- Crime grade is F in this area — have there been break-ins, vandalism, or insurance claims at this property in the last 3 years? What carrier currently insures it and at what premium?
- The area grade is low — what's the realistic commute time and amenity access for the typical tenant pool here? Any planned neighborhood developments (good or bad) we should know about?
- What's the average days-on-market for RENTAL listings here right now (not sales)? A rising rental-DOM trend means longer vacancies and softer asking-rent achievability than the comps imply.
- What's the recent tenant-quality profile in this submarket — average credit score on applications, eviction rate, late-payment / NSF rate, and stable-employment percentage? A property-management company in the area should have these aggregated.
- How much new for-sale + rental construction is in the pipeline within 1–3 miles? Heavy new supply typically softens prices + rents 12–24 months out; constrained supply supports both.
Investment metrics
- 1% rule
- 0.86% ✗
- Cap rate
- 6.24%
- Cash-on-cash
- -0.19%
- DSCR
- 0.99
- GRM
- 9.7
CMA / ARV
- ARV (on-the-fly)
- $151,335
- Comps found
- 12
Show comp detail 12 sales within ~0.75 mi
| Address | Dist | Beds/Ba | Sqft | Sold | Price | $/sf | Match |
|---|---|---|---|---|---|---|---|
| 2112 Martin Luther King Jr Pkwy | 0.07mi | 2/1.0 | 795 (-7%) | 2mo | $77,000 | $97 | 83 |
| 2021 22nd St | 0.03mi | 2/1.0 | 952 (+11%) | 3mo | $150,000 | $158 | 77 |
| 2619 Prospect Rd | 0.59mi | 2/2.0 | 831 (-3%) | 1mo | $156,000 | $188 | 63 |
| 2730 Sheridan Ave | 0.61mi | 3/1.0 (+1) | 864 (+1%) | 3mo | $189,900 | $220 | 62 |
| 2418 Boston Ave | 0.71mi | 3/1.0 (+1) | 864 (+1%) | 2mo | $180,000 | $208 | 59 |
| 1341 Clark St | 0.70mi | 2/1.0 | 884 (+3%) | 4mo | $133,000 | $150 | 58 |
| 3111 Lincoln Ave | 0.70mi | 3/1.0 (+1) | 864 (+1%) | 4mo | $100,000 | $116 | 57 |
| 2713 Meek Ave | 0.52mi | 2/1.0 | 768 (-10%) | 2mo | $68,000 | $89 | 57 |
| 1457 17th St | 0.58mi | 3/1.0 (+1) | 910 (+6%) | 0mo | $161,195 | $177 | 57 |
| 1821 Washington Ave | 0.31mi | 3/2.0 (+1) | 977 (+14%) | 1mo | $165,500 | $169 | 52 |
| 2615 30th St | 0.70mi | 3/2.0 (+1) | 918 (+7%) | 1mo | $210,000 | $229 | 45 |
| 2413 Adams Ave | 0.68mi | 2/1.0 | 748 (-12%) | 3mo | $175,000 | $234 | 45 |
Match score weights: distance 35% · size 25% · config 20% · recency 20%. Top-matched comps best support the ARV.
Projected returns pro-forma
-3.0% appreciation · 3.74% rent growth · sell at horizon
- IRR
- -15.8%
- Equity multiple
- 0.43×
- Total profit
- $-17,411
- Equity at exit
- $16,401
- IRR
- -6.1%
- Equity multiple
- 0.59×
- Total profit
- $-12,551
- Equity at exit
- $9,511
Cash invested: $30,800 (down + closing). Projections, not guarantees.
Landlord ↔ Tenant lean methodology
- Overall (STATE)
- 83 Strongly Landlord-Friendly
- State Iowa
- 83 Strongly Landlord-Friendly · R+6
- County
- — inherits STATE
- City
- — inherits STATE
ZIP-level market 50310
- Rents YoY
- 3.7%
- Active inventory
- 260
- Price-to-rent
- 9.7×
Monthly cashflow live
- Estimated rent
- $949 high interval (Pro) →
- Mortgage (P&I)
- −$577
- Tax from tax record
- −$132 /mo · $1,580/yr
- Insurance
- −$46
- HOA
- −$0
- Vacancy / Maint / Mgmt
- −$199
- Net cashflow
- $-5
Break-even live
Sensitivity live
| Price | -10% $57 | -5% $26 | +0% $-5 | +5% $-36 | +10% $-67 |
|---|---|---|---|---|---|
| Rent | -10% $-80 | -5% $-42 | +0% $-5 | +5% $33 | +10% $70 |
| Rate | -1.0pp $51 | -0.5pp $23 | base $-5 | +0.5pp $-33 | +1.0pp $-62 |
UW: 25.0% down · 7.5% · 30yr · 1.5% tax · 5.0% vac · 8.0% maint · 8.0% mgmt
Financing live
Cash to close
- Down payment
- $27,500
- Closing costs
- $3,300
- Reserves months
- —
- Total cash needed
- —
Loan-product check · same deal, 3 products live
Conventional
25% down · 7.5% · 30yr
- Down + closing
- —
- Monthly P&I
- —
- Monthly cashflow
- —
- DSCR
- —
- Eligible?
- —
Personal DTI + credit; lowest rate.
DSCR
20% down · 8.5% · 30yr
- Down + closing
- —
- Monthly P&I
- —
- Monthly cashflow
- —
- DSCR
- —
- Eligible?
- —
No personal income docs; deal must DSCR.
Hard money
10% down · 12.0% · 12mo
- Down + closing
- —
- Monthly P&I
- —
- Monthly cashflow
- —
- DSCR
- —
- Eligible?
- —
Short-term bridge; refi at stabilization.
Rent comps 40 comps
| Address | Beds | Baths | Sqft | Rent | $/sqft | DOM | Units | Dist |
|---|---|---|---|---|---|---|---|---|
| 1718 22nd St Des Moines, IA | 2.0 | 1.0 | 840 | $995 | $1.18 | 16d | 1 | 0.20mi |
| 2413 24th St Unit 3 Des Moines, IA | 2.0 | 1.0 | 600 | $725 | $1.21 | 45d | 1 | 0.26mi |
| 2501 24th St Unit 121 Des Moines, IA | 3.0 | 2.0 | 950 | $995 | $1.05 | 25d | 1 | 0.26mi |
| 2501 24th St Apt 107 Des Moines, IA | 3.0 | 2.0 | 950 | $1,045 | $1.10 | 16d | 1 | 0.27mi |
| 2501 24th St Unit 101 Des Moines, IA | 2.0 | 1.0 | 750 | $725 | $0.97 | 25d | 1 | 0.27mi |
| 2501 24th St Unit 113 Des Moines, IA | 2.0 | 1.0 | 750 | $945 | $1.26 | 45d | 1 | 0.27mi |
| 2501 24th St Des Moines, IA | 2.0 | 1.0 | 910 | $795 | $0.87 | 25d | 1 | 0.27mi |
| 2501 24th St Unit 111 Des Moines, IA | 2.0 | 1.0 | 750 | $760 | $1.01 | 25d | 1 | 0.27mi |
| 2110 26th St Apt 11 Des Moines, IA | 2.0 | 1.0 | 628 | $925 | $1.47 | 21d | 1 | 0.27mi |
| 1714 College Ave Des Moines, IA | 3.0 | 1.0 | 1015 | $1,050 | $1.03 | 45d | 1 | 0.49mi |
| 1313 21st St Unit 7 Des Moines, IA | 1.0 | 1.0 | 600 | $695 | $1.16 | 45d | 1 | 0.72mi |
| 1313 21st St Unit 2 Des Moines, IA | 1.0 | 1.0 | 600 | $695 | $1.16 | 16d | 1 | 0.72mi |
| 1314 22nd St Unit 1 Des Moines, IA | 1.0 | 1.0 | 535 | $725 | $1.36 | 25d | 1 | 0.73mi |
| 1312 22nd St Unit 2 Des Moines, IA | 2.0 | 1.0 | 841 | $825 | $0.98 | 25d | 1 | 0.74mi |
| 1312 22nd St Des Moines, IA | 2.0 | 1.0 | 841 | $825 | $0.98 | 45d | 1 | 0.74mi |
| 1312 22nd St Unit 2 Des Moines, IA | 2.0 | 1.0 | 841 | $850 | $1.01 | 45d | 1 | 0.74mi |
| 2411 Welbeck Rd #11 Des Moines, IA | 2.0 | 1.0 | 750 | $745 | $0.99 | 45d | 1 | 0.77mi |
| 2411 Welbeck Rd #7 Des Moines, IA | 2.0 | 1.0 | 750 | $845 | $1.13 | 45d | 1 | 0.77mi |
| 1217 24th St Des Moines, IA | 2.0 | 1.0–2.0 | 618 | $1,400 | $2.26 | 16d | 4 | 0.83mi |
| 1914 10th St Des Moines, IA | 2.0 | 1.0 | 740 | $1,050 | $1.42 | 45d | 1 | 0.84mi |
| 1914 10th St Des Moines, IA | 2.0 | 1.0 | 740 | $1,050 | $1.42 | 25d | 1 | 0.84mi |
| 1215 25th St Unit 1 Des Moines, IA | 1.0 | 1.0 | 610 | $1,200 | $1.97 | 45d | 1 | 0.85mi |
| 2002 34th St Des Moines, IA | 2.0 | 1.0 | 897 | $1,350 | $1.51 | 23d | 1 | 0.87mi |
| 2901 Boston Ave Des Moines, IA | 1.0–2.0 | 1.0–1.5 | 707 | $1,300 | $1.84 | 16d | 7 | 0.88mi |
| 3103 Forest Ave Des Moines, IA | 1.0–2.0 | 1.0–1.5 | 900 | $1,550 | $1.72 | 16d | 1 | 0.90mi |
| 1171 21st St Unit 1 Des Moines, IA | 2.0 | 1.0 | 1028 | $1,150 | $1.12 | 45d | 1 | 0.91mi |
| 2530 University Ave Des Moines, IA | 2.0 | 1.0 | 647 | $1,750 | $2.70 | 16d | 36 | 0.93mi |
| 3201 Forest Ave Des Moines, IA | 3.0 | 1.0–2.0 | 717 | $1,356 | $1.89 | 16d | 16 | 0.96mi |
| 1621 9th St Unit 1613-01 Des Moines, IA | 1.0 | 1.0 | 717 | $776 | $1.08 | 45d | 1 | 0.97mi |
| 1621 9th St Unit 1621-15 Des Moines, IA | 1.0 | 1.0 | 625 | $743 | $1.19 | 45d | 1 | 0.97mi |
| 1501 University Ave Unit 4 Des Moines, IA | 1.0 | 1.0 | 572 | $595 | $1.04 | 45d | 1 | 0.99mi |
| 1501 University Ave Unit 3 Des Moines, IA | 1.0 | 1.0 | 572 | $595 | $1.04 | 25d | 1 | 0.99mi |
| 1123 24th St Unit 1 Des Moines, IA | 3.0 | 1.0 | 850 | $1,185 | $1.39 | 45d | 1 | 0.99mi |
| 1100 24th St Des Moines, IA | 2.0 | 1.0 | 748 | $1,050 | $1.40 | 16d | 1 | 1.02mi |
| 1100 24th St Unit DT 22 Des Moines, IA | 2.0 | 1.0 | 737 | $1,095 | $1.49 | 45d | 1 | 1.02mi |
| 1101 25th St Apt 2 Des Moines, IA | 1.0 | 1.0 | 631 | $900 | $1.43 | 45d | 1 | 1.03mi |
| 1101 25th St Unit DP 24 Des Moines, IA | 1.0 | 1.0 | 623 | $870 | $1.40 | 45d | 1 | 1.03mi |
| 1101 25th St Unit DP 11 Des Moines, IA | 2.0 | 2.0 | 850 | $1,315 | $1.55 | 45d | 1 | 1.03mi |
| 1108 25th St Apt 2 Des Moines, IA | 1.0 | 1.0 | 750 | $700 | $0.93 | 45d | 1 | 1.03mi |
| 1101 25th St Des Moines, IA | 1.0 | 1.0 | 561 | $835 | $1.49 | 16d | 1 | 1.03mi |
Listing history 23 events
-
2026-06-21days on market $110,000 Active 32 DOM
-
2026-06-18days on market $110,000 Active 29 DOM
-
2026-06-17days on market $110,000 Active 28 DOM
-
2026-06-16days on market $110,000 Active 27 DOM
-
2026-06-15days on market $110,000 Active 26 DOM
-
2026-06-14days on market $110,000 Active 24 DOM
-
2026-06-13days on market $110,000 Active 23 DOM
-
2026-06-10days on market $110,000 Active 21 DOM
-
2026-06-09days on market $110,000 Active 20 DOM
-
2026-06-08days on market $110,000 Active 19 DOM
-
2026-06-07days on market $110,000 Active 18 DOM
-
2026-06-05days on market $110,000 Active 15 DOM
-
2026-06-03days on market $110,000 Active 14 DOM
-
2026-06-02days on market $110,000 Active 13 DOM
-
2026-06-01days on market $110,000 Active 12 DOM
-
2026-05-31days on market $110,000 Active 11 DOM
-
2026-05-31days on market $110,000 Active 10 DOM
-
2026-05-20$110,000 Active
-
2025-07-23historical
-
2025-06-05status Active
-
2025-05-20status Pending
-
2025-05-12$119,000 Active
-
2005-09-14$29,900
ⓘ Source: listings_history table (triggers on properties + properties_extension) + one-shot
backfill from property_details.listing_events for pre-trigger history.
Tax reassessment forecast IA · Partial reset (capped growth)
- Current annual tax
- $1,580 · $132/mo
- Projected year-2 tax
- $1,654 · $138/mo
- Expected delta
- +$74/yr (+$6/mo · 4.7%)
ⓘ Screening estimate from a state-policy table — verify with the county assessor before closing.
Climate risk First Street
- Flood 1/10 Low FEMA zone X (unshaded) · 0% chance over 30 yrs
- Wildfire 1/10 Low
- Heat 3/10 Moderate 7 d/yr ≥103°F today · 15 d/yr by 30 yrs out
- Wind 2/10 Low
- Air quality 2/10 Low 1 unhealthy d/yr today · 2 by 30 yrs out
Nearby sold comps map
Loading sold comps map…
Walkable amenities ~0.75 mi
Loading nearby amenities…
Taxation est. · year 1
- Rental income
- $11,385
- − Mortgage interest
- −$6,162
- − Property taxes
- −$1,580
- − Insurance
- −$550
- − Repairs & maintenance
- −$911
- − Management
- −$911
- − Depreciation
- −$3,200
- Taxable loss
- −$1,928
- Est. tax savings @ 24.0%
- +$463
- After-tax cash flow
- $405/yr
For passive investors: Depreciation is non-cash, so a rental often shows a tax loss while cash-flowing — sheltering income. Rental losses are passive: they offset passive income freely, and up to $25,000/yr can offset ordinary (W-2) income if you actively participate and your MAGI is under $100k (phasing out to $0 by $150k); unused losses carry forward. On sale, claimed depreciation is recaptured at up to 25%, and gains may owe capital-gains tax (a 1031 exchange can defer both). Figures are a year-1 estimate at your 24.0% rate — not tax advice; consult a CPA.
Schools (NCES district)
- District
- Des Moines Independent Community School District
- NCES district ID
- 1908970
- Math proficiency
- 43% ▼ -6.00%
- Reading proficiency
- 46% ▼ -1.00%
- Median HH income
- $45,905
- Composite
- 37.83/100
- National rank
- #4331
- State rank
- #289 of 289 in IA
Livability — Des Moines
- Score
- 81/100
- State rank
- #63
- US rank
- #1432
Category grades
Schools grade is shown separately in the Schools card above.
Census & demographics
- Census place
- Des Moines, IA
- County
- Polk County · 453,298 people
- City population
- 203,612
- Metro
- Des Moines-West Des Moines, IA
- Population (ZIP)
- 31,177
- Household income
- $76,381
- Rent vs Own
- Severe rent burden
- 928.0
Population outlook (Polk County) Hauer SSP2
- Today (2025)
- 548,042 people
- By 2030
- 588,557 · +7.4%
- By 2040
- 670,629 · +22.4%
- By 2050
- 752,830 · +37.4%
- By 2075
- 955,069 · +74.3%
- By 2100
- 1,115,436 · +103.5%
Race, ethnicity, and origin ACS 2023
- Neighborhood character
- Majority White (65%)
- Race & ethnicity
- White 65% Black 14% Asian 9% Hispanic / Latino 8% Two or more races 7%
- Hispanic origin (detail)
- Mexican 6%
- Common ancestry
- Ukrainian 3% Iranian 3% Italian 2%
- Foreign-born
- 19% · Canada, Philippines, Vietnam
- Languages at home
- 77% English-only · Other Asian/Pacific 6% Spanish 6% Russian/Polish/Slavic 3%
Political lean MEDSL · Polk
- 2024 margin
- D (+10.9) · D 54.8% · R 43.9% · Other 1.3%
- 2008→2024 swing
- -3.7pp toward R · 2008: 14.6pp · 2024: 10.9pp
- All cycles
- 2024: D+10.9 2020: D+15.2 2016: D+11.5 2012: D+14.2 2008: D+14.6
Not yet ingested
- Civics
- —
Market trends
- HPI YoY
- ▼ -197.92%
- Current HPI
- 248.07
- Rent YoY
- ▲ 3.74%
- Metro
- Des Moines-West Des Moines, IA
- State GDP YoY
- ▲ 2.48%
- F500 in state
- 4
Industry mix (Fortune 500 HQ in IA)
| Industry | F500 HQs | Revenue |
|---|---|---|
| Financial Services | 1 | $16B |
|
||
| Retail / Convenience | 1 | $15B |
|
||
Price history
+267.9% since first listed6 events — show timeline
- 2026-05-20 Listed $110,000 DMMLS
- 2025-07-23 Listing Removed — DMMLS
- 2025-06-05 Relisted — DMMLS
- 2025-05-20 Pending — DMMLS
- 2025-05-12 Listed $119,000 DMMLS
- 2005-09-14 Listed $29,900 DMMLS
Property tax history
+2.4%/yrLatest (2025): $1,580 · +2.1% YoY. Source: county tax records.
Cash-flow waterfall
monthlySold comps — $/sqft
last 12 mo · ≤1 miLoading sold comps…