40 High Point Rd Unit F-206 · Islamorada, Village of Islands, FL
Flood risk No data
- FEMA flood zone
- —
- Chance of flooding over 30 yrs
- —
- Est. flood insurance / yr
- —
Fire risk No data
- Est. fire insurance / yr
- —
Heat risk No data
- Hot days now (above threshold)
- —
- Hot days in 30 yrs
- —
Wind risk No data
- Chance of severe wind over 30 yrs
- —
Air-quality risk No data
- Unhealthy air days now
- —
- Unhealthy air days in 30 yrs
- —
Risk factors via First Street. Map © Google.
Why this score? — see what drove the D grade
The composite is a weighted blend of 9 inputs, each scored 0–100. Each bar is that input's sub-score; the figure is the points it added to the 100-point composite (weight × sub-score).
- Cash flow +7.9/30.0
- ARV discount +7.5/15.0
- 1% rule +6.2/10.0
- Appreciation +5.2/10.0
- Schools +4.6/10.0
- Rent growth +2.5/5.0
- Livability +2.5/5.0
- Condition / age +2.5/5.0
- DSCR +1.9/10.0
$239,000
🖨 Deal sheet 📄 Offer letter ✓ Due diligence
Listing remarks
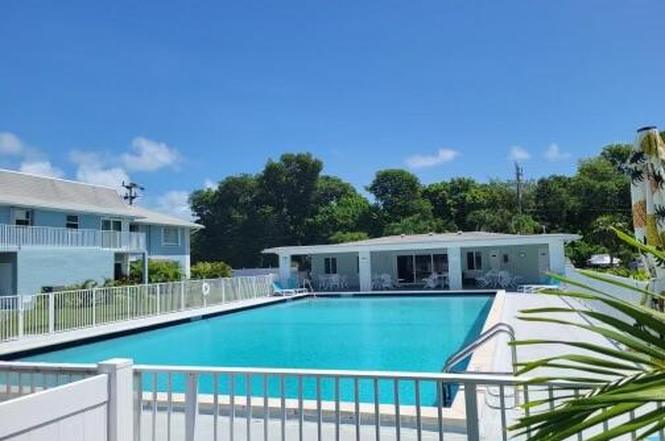
Nice and quiet 1/1 located in the desirable Plantation Villas on Plantation Key. This is a upper corner unit with Tile throughout. Impact Cat 5 hurricane windows and newer AC. Tub shower combination in bath. Large walk-in closet in bedroom with lots of storage and ceiling fans throughout. Beautiful Yard area for outdoor enjoyment. This development has a pool, clubhouse and picnic area. Located near Founders Park with lots of activities and beautiful beach.
Key facts
- Newer ac
- Pool
- Large walk-in closet
Tags
Property features AI
Finance
- Other: Located in FEMA flood zone AE; Lot less than 1/4 acre; Subdivision: Plant Villas; Deed restrictions: unknown; Tax exemptions: Homestead
- HOA & community: Mandatory homeowners association; HOA fee about $715/month; HOA includes cable, common area maintenance, building insurance, building exterior maintenance, and water; Association has first right of refusal; Pets allowed with restrictions; Rentals allowed with restrictions
Exterior
- Parking: Assigned parking
- Utilities: FKAA water; Public sewer hookup; Cable available; Separate electric meter; Separate water meter
- Home design: Multi-family attached; Built in 1974
- Construction: CBS construction
- Exterior features: In-ground pool; No porch or balcony; No waterfront; No waterview
Interior
- Kitchen: Range; Refrigerator; Dishwasher; Wine cooler
- Flooring: Tile floor
- Bathrooms: 1 full bathroom
- Heating & cooling: Central heating; Central A/C; Ceiling fans
- Interior features: Walk-in closet; Impact-resistant windows
- Laundry & utility: Washer; Dryer
Neighborhood map
What this means for you Summary
Snapshot
- This is a 1-bed/1.0-bath condo listed at $239k.
Deal economics
- At list price, monthly cash flow is $-257 ($-3k/yr) — negative.
- To cash-flow at today's rent, offer at most $202k (15.6% below list).
- Meets the 1% rule at list price ($3k rent vs $239k).
- Recommended offer: $202k (15.6% below list) — sets the bar for cash-flow.
- Cap rate 5.0% vs local median 0.3% in Islamorada, Village of Islands — top-decile yield for the area; either an underpriced asset or a hidden risk that comps aren't pricing in. Stress-test before assuming the spread holds.
Location & tenants
- Location reads: area grade D — affects rentability + tenant quality, not the cash-flow math above.
- Monroe (town): math 50% / reading 55% proficiency, ranked #23 of 73 in FL (top 32%) — acceptable for families but not a draw, mixed tenant base, ~2y average lease.
- Market conditions: 142 active listings in the ZIP; solid renter incomes; 332 units permitted in Monroe County in 2024 (42 in 5+ unit buildings).
- This rent runs 42% of the median local income ($75k/yr) — at the standard rent-burdened threshold; future hikes will face affordability resistance.
Forward outlook
- In year one you build about $3k of equity ($2k loan paydown + $1k appreciation (0.5% local appreciation)).
- Monroe County population projected at +28% by 2050 — long-run rental-demand tailwind backs the buy-and-hold thesis.
- By year 10, paydown + projected appreciation supports a ~$32k cash-out refi (75% LTV) — recoverable capital for the next deal without selling this one.
Negotiation context
- It's been on market 111 days — a 9% lower offer ($217k) is reasonable based on typical stale-listing flexibility.
- 8 sale attempts since 20y ago with the ask held roughly flat each time — persistent listings suggest the price (not the market) is what's stuck; bring a comps-based counter.
- Current owner paid $105k; list at $239k implies a 128% gain — meaningful room to come down on a strong offer.
Risks & watch-outs
- Watch-outs: HOA is 27% of rent.
Questions for the listing agent
- What do current leases actually rent for vs. the listed asking? Can we see a recent rent roll and the last 12 months of T-12 income?
- It's been on market 111 days. Have you received any prior offers? Is the seller open to a 16% concession, seller financing, or rate buy-down credit?
- Built in 1974 — when were the roof, HVAC, electrical panel, plumbing, and water heater last replaced?
- What does the HOA fee cover, when was the last increase, and are there any pending special assessments or reserve-fund shortfalls?
- Any open or pending special assessments — roof, HVAC, plumbing, elevator, façade? What's the per-unit balance and payoff schedule, and is the seller paying it off at close or rolling it to the buyer?
- Why hasn't it sold? Are there any deal-killer items the seller is aware of (foundation, flood, title, zoning, code violations)?
- Is there a deadline driving the sale (1031 exchange, divorce, estate, relocation)? That informs how much negotiation room exists.
- The area grade is low — what's the realistic commute time and amenity access for the typical tenant pool here? Any planned neighborhood developments (good or bad) we should know about?
- What's the average days-on-market for RENTAL listings here right now (not sales)? A rising rental-DOM trend means longer vacancies and softer asking-rent achievability than the comps imply.
- What's the recent tenant-quality profile in this submarket — average credit score on applications, eviction rate, late-payment / NSF rate, and stable-employment percentage? A property-management company in the area should have these aggregated.
- How much new apartment / multifamily construction is in the pipeline within 1–3 miles? Heavy new supply (>2% of stock underway) typically softens rents 12–24 months out; light construction supports rent growth.
Investment metrics
- 1% rule
- 1.12% ✓
- Cap rate
- 5.00%
- Cash-on-cash
- -4.61%
- DSCR
- 0.79
- GRM
- 7.5
CMA / ARV
No comps found within radius.
Projected returns pro-forma
0.46% appreciation · 3.0% rent growth · sell at horizon
- IRR
- -5.4%
- Equity multiple
- 0.74×
- Total profit
- $-17,663
- Equity at exit
- $74,946
- IRR
- 0.4%
- Equity multiple
- 1.04×
- Total profit
- $2,858
- Equity at exit
- $94,644
Cash invested: $66,920 (down + closing). Projections, not guarantees.
Landlord ↔ Tenant lean methodology
- Overall (STATE)
- 87 Strongly Landlord-Friendly
- State Florida
- 87 Strongly Landlord-Friendly · R+3
- County
- — inherits STATE
- City
- — inherits STATE
ZIP-level market 33070
- Home prices YoY
- 0.0%
- Active inventory
- 142
- Price-to-rent
- 7.5×
Monthly cashflow live
- Estimated rent
- $2,671 medium interval (Pro) →
- Mortgage (P&I)
- −$1,253
- Tax est. 1.5%
- −$299 /mo · $3,585/yr
- Insurance
- −$100
- HOA
- −$715
- Vacancy / Maint / Mgmt
- −$561
- Net cashflow
- $-257
Break-even live
UW: 25.0% down · 7.5% · 30yr · 1.5% tax · 5.0% vac · 8.0% maint · 8.0% mgmt
Financing live
Cash to close
- Down payment
- $59,750
- Closing costs
- $7,170
- Reserves months
- —
- Total cash needed
- —
Loan-product check · same deal, 3 products live
Conventional
25% down · 7.5% · 30yr
- Down + closing
- —
- Monthly P&I
- —
- Monthly cashflow
- —
- DSCR
- —
- Eligible?
- —
Personal DTI + credit; lowest rate.
DSCR
20% down · 8.5% · 30yr
- Down + closing
- —
- Monthly P&I
- —
- Monthly cashflow
- —
- DSCR
- —
- Eligible?
- —
No personal income docs; deal must DSCR.
Hard money
10% down · 12.0% · 12mo
- Down + closing
- —
- Monthly P&I
- —
- Monthly cashflow
- —
- DSCR
- —
- Eligible?
- —
Short-term bridge; refi at stabilization.
HOA detail condo
- Monthly dues
- $715 · $8,580/yr
- Likely covers
- pool
- Assessments
- None detected in remarks — confirm with the listing agent.
Listing history 38 events
-
2026-06-19days on market $239,000 Active 111 DOM
-
2026-06-18days on market $239,000 Active 110 DOM
-
2026-06-17days on market $239,000 Active 109 DOM
-
2026-06-16days on market $239,000 Active 108 DOM
-
2026-06-15days on market $239,000 Active 107 DOM
-
2026-06-14days on market $239,000 Active 105 DOM
-
2026-06-13days on market $239,000 Active 104 DOM
-
2026-06-10days on market $239,000 Active 102 DOM
-
2026-06-09days on market $239,000 Active 101 DOM
-
2026-06-08days on market $239,000 Active 100 DOM
-
2026-06-07days on market $239,000 Active 99 DOM
-
2026-06-05days on market $239,000 Active 96 DOM
-
2026-06-03days on market $239,000 Active 95 DOM
-
2026-06-02days on market $239,000 Active 94 DOM
-
2026-06-01days on market $239,000 Active 93 DOM
-
2026-05-31days on market $239,000 Active 92 DOM
-
2026-05-30days on market $239,000 Active 91 DOM
-
2026-02-28$239,000 Active
-
2026-02-01historical
-
2025-08-29historical $1,800
-
2025-08-13$1,800
-
2025-07-31$239,000 Active
-
2025-07-30historical
-
2025-07-07price $239,000
-
2025-02-13price $249,900
-
2025-01-29price $265,000
-
2025-01-29historical
-
2025-01-29$265 Active
-
2024-05-29price $265,000
-
2024-03-18price $275,000
-
2023-11-18price $290,000
-
2023-08-10$299,900 Active
-
2020-05-15historical
-
2016-10-24soldstatus $105,000
-
2016-03-20$110,000
-
2014-09-12soldstatus $88,000
-
2014-01-06$84,500
-
2006-08-02$240,000
ⓘ Source: listings_history table (triggers on properties + properties_extension) + one-shot
backfill from property_details.listing_events for pre-trigger history.
Nearby sold comps map
Loading sold comps map…
Walkable amenities ~0.75 mi
Loading nearby amenities…
Taxation est. · year 1
- Rental income
- $32,046
- − Mortgage interest
- −$13,388
- − Property taxes
- −$3,585
- − Insurance
- −$1,195
- − Repairs & maintenance
- −$2,564
- − Management
- −$2,564
- − HOA
- −$8,580
- − Depreciation
- −$6,953
- Taxable loss
- −$6,782
- Est. tax savings @ 24.0%
- +$1,628
- After-tax cash flow
- $-1,456/yr
For passive investors: Depreciation is non-cash, so a rental often shows a tax loss while cash-flowing — sheltering income. Rental losses are passive: they offset passive income freely, and up to $25,000/yr can offset ordinary (W-2) income if you actively participate and your MAGI is under $100k (phasing out to $0 by $150k); unused losses carry forward. On sale, claimed depreciation is recaptured at up to 25%, and gains may owe capital-gains tax (a 1031 exchange can defer both). Figures are a year-1 estimate at your 24.0% rate — not tax advice; consult a CPA.
Schools (NCES district)
- District
- Monroe
- NCES district ID
- 1201320
- Math proficiency
- 50% ▼ -14.00%
- Reading proficiency
- 55% ▼ -6.00%
- Median HH income
- $56,955
- Composite
- 45.51/100
- National rank
- #2608
- State rank
- #23 of 73 in FL
Livability — Islamorada, Village of Islands
No livability data for this city. (Only ~50 U.S. cities are tracked.)
Census & demographics
- Census place
- Islamorada, Village of Islands, FL
- County
- Monroe County · 66,185 people
- Metro
- Key West, FL
- Population (ZIP)
- 5,768
- Household income
- $75,436
- Rent vs Own
- Severe rent burden
- 204.0
Population outlook (Monroe County) Hauer SSP2
- Today (2025)
- 90,706 people
- By 2030
- 96,308 · +6.2%
- By 2040
- 106,565 · +17.5%
- By 2050
- 116,500 · +28.4%
- By 2075
- 141,423 · +55.9%
- By 2100
- 151,947 · +67.5%
Race, ethnicity, and origin ACS 2023
- Neighborhood character
- Predominantly White (75%)
- Race & ethnicity
- White 75% Hispanic / Latino 22% Two or more races 12% Black 1%
- Hispanic origin (detail)
- Mexican 2% Cuban 15%
- Common ancestry
- Romanian 5% Lithuanian 3% Slovak 2%
- Foreign-born
- 16% · Canada, Guatemala, Jamaica
- Languages at home
- 80% English-only · Spanish 17% Russian/Polish/Slavic 2%
Political lean MEDSL · Monroe
- 2024 margin
- R (+18.3) · D 40.5% · R 58.8%
- 2008→2024 swing
- -23.2pp toward R · 2008: 4.9pp · 2024: -18.3pp
- All cycles
- 2024: R+18.3 2020: R+7.9 2016: R+6.9 2012: D+0.4 2008: D+4.9
Not yet ingested
- Civics
- —
Market trends
- HPI YoY
- ▲ 0.46%
- Current HPI
- 1058.63
- Rent YoY
- —
- Metro
- Key West, FL
- State GDP YoY
- ▲ 3.28%
- F500 in state
- 36
Industry mix (Fortune 500 HQ in FL)
| Industry | F500 HQs | Revenue |
|---|---|---|
| Industrial Technology | 2 | $29B |
|
||
| Insurance | 2 | $17B |
|
||
| Retail | 1 | $60B |
|
||
| Technology Distribution | 1 | $58B |
|
||
| Homebuilding | 1 | $35B |
|
||
| Technology Manufacturing | 1 | $35B |
|
||
Price history
-0.4% since first listed21 events — show timeline
- 2026-02-28 Listed $239,000 FLKMLS
- 2026-02-01 Listing Removed — FLKMLS
- 2025-08-29 Rental Removed $1,800 FLKMLS
- 2025-08-13 Listed for Rent $1,800 FLKMLS
- 2025-07-31 Listed $239,000 FLKMLS
- 2025-07-30 Listing Removed — FLKMLS
- 2025-07-07 Price Changed $239,000 FLKMLS
- 2025-02-13 Price Changed $249,900 FLKMLS
- 2025-01-29 Price Changed $265,000 FLKMLS
- 2025-01-29 Listing Removed — FLKMLS
- 2025-01-29 Listed $265 FLKMLS
- 2024-05-29 Price Changed $265,000 FLKMLS
- 2024-03-18 Price Changed $275,000 FLKMLS
- 2023-11-18 Price Changed $290,000 FLKMLS
- 2023-08-10 Listed $299,900 FLKMLS
- 2020-05-15 Listing Removed — FLKMLS
- 2016-10-24 Sold (MLS) $105,000 FLKMLS
- 2016-03-20 Listed $110,000 FLKMLS
- 2014-09-12 Sold (MLS) $88,000 FLKMLS
- 2014-01-06 Listed $84,500 FLKMLS
- 2006-08-02 Listed $240,000 FLKMLS
Cash-flow waterfall
monthlySold comps — $/sqft
last 12 mo · ≤1 miLoading sold comps…