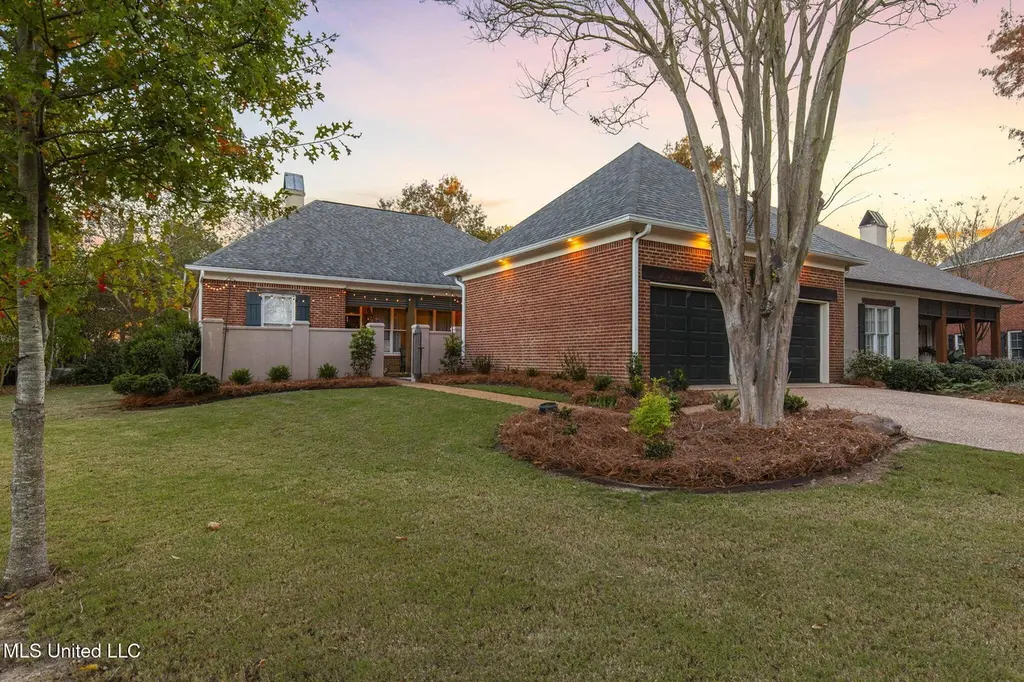
115 Camden Ct · Madison, MS
Flood risk 1/10 · Minimal
- FEMA flood zone
- X (unshaded)
- Chance of flooding over 30 yrs
- 0.0%
- Est. flood insurance / yr
- $507 – $1,088
Fire risk 3/10 · Minor
- Est. fire insurance / yr
- $1,241 – $2,305
Heat risk 7/10 · Major
- Hot days now (above 108°F)
- 7 days/yr
- Hot days in 30 yrs
- 20 days/yr
Wind risk 8/10 · Major
- Chance of severe wind over 30 yrs
- 80.0%
Air-quality risk 2/10 · Minimal
- Unhealthy air days now
- 0 days/yr
- Unhealthy air days in 30 yrs
- 1 days/yr
Risk factors via First Street. Map © Google.
Why this score? — see what drove the D grade
The composite is a weighted blend of 9 inputs, each scored 0–100. Each bar is that input's sub-score; the figure is the points it added to the 100-point composite (weight × sub-score).
- ARV discount +14.1/15.0
- Cash flow +10.4/30.0
- Livability +4.0/5.0
- Rent growth +3.2/5.0
- DSCR +3.0/10.0
- Condition / age +2.5/5.0
- 1% rule +2.4/10.0
- Schools +1.3/10.0
- Appreciation +0.0/10.0
$369,900
🖨 Deal sheet (PDF) 📄 Offer letter ✓ Due diligence
Listing remarks
Priced to sell, we welcome you to 115 Camden Court! This well-maintained 3-bedroom, 2-bath home offers 2,256 square feet of living space on a quiet cul-de-sac lot. This home features a split floor plan, hardwood flooring, modern kitchen cabinetry, quartz countertops, stainless steel appliances, and a spacious primary suite with a beautifully tiled shower and large soaking tub. The meticulously maintained courtyard and yard create outstanding curb appeal, while the large upstairs bonus room provides the perfect space for entertaining, a media room, or home office. Residents also enjoy access to neighborhood marina boat parking just steps away! Combining quality finishes, functional living
Key facts
- Hardwood flooring
- Quartz countertops
- Split floor plan
Tags
Property features AI
Finance
- Other: Community amenities: boating, clubhouse, fishing, golf, hiking/walking trails, lake, marina, nearby entertainment, park, playground, pool, restaurant, RV/boat storage, sidewalks, street lights, tennis courts
- HOA & community: Homeowners association with annual fee; Annual association fee includes accounting/legal, grounds maintenance, management, and pool service
Exterior
- Parking: Attached 2-car garage with garage door opener
- Security: Security system; Smoke detectors
- Utilities: Public water; Public sewer; Electricity connected; Natural gas connected; Cable available; Sewer connected
- Home design: Single-family house; One and one-half stories; Move-in ready
- Construction: Brick construction; Architectural shingle roof; Post-tension foundation; Built (year from public records)
- Exterior features: Front porch; Cul-de-sac lot; Lakefront and marina access; Waterfront features include lake, marina, and other amenities
Interior
- Kitchen: Cooktop (gas); Gas cooktop; Oven; Microwave; Dishwasher; Garbage disposal; Exhaust fan; Granite counters; Pantry
- Bedrooms: Bedrooms located on multiple levels (one and one-half story layout)
- Flooring: Ceramic tile; Wood
- Bathrooms: Two full bathrooms; One half bathroom
- Heating & cooling: Central heating (natural gas); Central air; Electric cooling; Ceiling fans
- Interior features: Ceiling fans; Crown molding; Double vanities; Entrance foyer; Granite counters; High ceilings; High-speed internet; Open floorplan; Pantry; Soaking tub; Walk-in closets; Insulated windows
- Laundry & utility: Washer hookup; Electric dryer hookup; Laundry sink; Gas water heater; Water heater
Neighborhood map
What this means for you Summary
Snapshot
- This is a 3-bed/4.0-bath single-family listed at $370k.
Deal economics
- At list price, monthly cash flow is $-198 ($-2k/yr) — negative.
- To cash-flow at today's rent, offer at most $335k (9.5% below list).
- To meet the 1% rule (rent ≥ 1% of price), the offer needs to be $272k (26.4% below list).
- Recommended offer: $272k (26.4% below list) — sets the bar for 1% rule.
- Cap rate 5.7% vs local median 3.8% in Madison — top-decile yield for the area; either an underpriced asset or a hidden risk that comps aren't pricing in. Stress-test before assuming the spread holds.
Location & tenants
- Location reads 81/100 on livability (#4 in MS, #1,556 nationally) — a professional / high-income tenant draw. Strengths: crime A+, employment A+, housing A+; Watch: amenities D-, commute F.
- Canton Public School District (rural): math 13% / reading 19% proficiency, ranked #100 of 130 in MS (top 77%) — low school quality limits family demand, transient renter base, plan for 1-2y turnover; 94% free/reduced lunch — lower-income household profile, screen leases tightly.
- Zoned schools: Mc Neal Elementary School (math 9% / reading 20%, grade F, #279 of 375 statewide, top 77%, 410 students, 100% FRL); Nichols Middle School (math 13% / reading 15%, grade F, #138 of 179 statewide, top 78%, 396 students, 100% FRL); Canton Public High School (math 8% / reading 18%, grade F, #158 of 197 statewide, top 80%, 597 students, 100% FRL).
- Market conditions: Rents rising (+2.6%/yr); 634 active listings in the ZIP; 3 comparable units currently listed for rent nearby; rentals lingering (median 46d on market — plan ~5-8 weeks vacancy on turnover, expect pricing pressure); 67% of comp listings sitting > 30 days — soft ceiling on asking rent; high-income renter base; 553 units permitted in Madison County in 2024 (0 in 5+ unit buildings).
Forward outlook
- Local home prices are declining (-3.0%/yr); year-one equity from $3k of loan paydown is wiped out by about $11k of value loss. Plan a longer hold.
- Madison County population projected at +34% by 2050 — long-run rental-demand tailwind backs the buy-and-hold thesis.
Negotiation context
- Only 14 days on market — expect competitive offers; lowballing is unlikely to land.
- 6 sale attempts since 26y ago with the ask held roughly flat each time — persistent listings suggest the price (not the market) is what's stuck; bring a comps-based counter.
Risks & watch-outs
- Climate carrying-cost: severe wind risk, 80% chance of damaging wind over 30y; extreme-heat days projected 7→20/yr by 2055 (HVAC capex compounding) — expect insurance premiums to compound above CPI over the hold.
Questions for the listing agent
- What do current leases actually rent for vs. the listed asking? Can we see a recent rent roll and the last 12 months of T-12 income?
- What does the HOA fee cover, when was the last increase, and are there any pending special assessments or reserve-fund shortfalls?
- Is there a deadline driving the sale (1031 exchange, divorce, estate, relocation)? That informs how much negotiation room exists.
- Schools are A-rated — typically a magnet for longer-tenancy family renters. What's the average tenant stay here, and is there a school-zone premium baked into asking?
- The area grade is low — what's the realistic commute time and amenity access for the typical tenant pool here? Any planned neighborhood developments (good or bad) we should know about?
- What's the average days-on-market for RENTAL listings here right now (not sales)? A rising rental-DOM trend means longer vacancies and softer asking-rent achievability than the comps imply.
- What's the recent tenant-quality profile in this submarket — average credit score on applications, eviction rate, late-payment / NSF rate, and stable-employment percentage? A property-management company in the area should have these aggregated.
- How much new for-sale + rental construction is in the pipeline within 1–3 miles? Heavy new supply typically softens prices + rents 12–24 months out; constrained supply supports both.
Investment metrics
- 1% rule
- 0.74% ✗
- Cap rate
- 5.65%
- Cash-on-cash
- -2.30%
- DSCR
- 0.90
- GRM
- 11.3
CMA / ARV
- ARV (median comp)
- $433,945
- List price
- $369,900
- Delta
- -11.28%
- Verdict
- UNDERPRICED
- Comps
- 20 within 1.0 mi
Show comp detail 12 sales within ~0.75 mi
| Address | Dist | Beds/Ba | Sqft | Sold | Price | $/sf | Match |
|---|---|---|---|---|---|---|---|
| 136 Savoy Park Park | 0.57mi | 3/2.0 | 1,909 (+0%) | 4mo | $325,000 | $170 | 62 |
| 102 Hampton Chase | 0.50mi | 3/2.0 | 2,030 (+6%) | 2mo | $370,000 | $182 | 56 |
| 110 Hutto Ln | 0.74mi | 3/2.0 | 1,895 (-1%) | 2mo | $395,000 | $208 | 55 |
| 120 Hampton Chase | 0.41mi | 3/2.5 | 2,126 (+12%) | 1mo | $199,000 | $94 | 55 |
| 112 Shore View Dr | 0.63mi | 4/3.0 (+1) | 1,976 (+4%) | 4mo | $435,000 | $220 | 52 |
| 140 Hampton Rdg | 0.70mi | 3/2.5 | 1,804 (-5%) | 3mo | $350,000 | $194 | 50 |
| 135 Hampton Rdg | 0.63mi | 3/2.0 | 1,764 (-8%) | 4mo | $340,000 | $193 | 47 |
| 469 Caroline Blvd | 0.33mi | 4/2.0 (+1) | 2,189 (+15%) | 1mo | $423,000 | $193 | 46 |
| 136 Prescott Rdg | 0.45mi | 3/2.0 | 1,645 (-14%) | 3mo | $299,000 | $182 | 46 |
| 146 French Br | 0.47mi | 4/2.0 (+1) | 2,121 (+11%) | 4mo | $354,500 | $167 | 44 |
| 132 Southampton Cir | 0.64mi | 3/2.0 | 2,145 (+12%) | 3mo | $349,900 | $163 | 39 |
| 136 Sycamore Rdg | 0.68mi | 4/3.0 (+1) | 2,190 (+15%) | 4mo | $369,900 | $169 | 31 |
Match score weights: distance 35% · size 25% · config 20% · recency 20%. Top-matched comps best support the ARV.
Projected returns pro-forma
-3.0% appreciation · 2.61% rent growth · sell at horizon
- IRR
- -20.5%
- Equity multiple
- 0.29×
- Total profit
- $-73,710
- Equity at exit
- $55,153
- IRR
- -14.6%
- Equity multiple
- 0.18×
- Total profit
- $-85,119
- Equity at exit
- $31,982
Cash invested: $103,572 (down + closing). Projections, not guarantees.
Landlord ↔ Tenant lean methodology
- Overall (STATE)
- 90 Strongly Landlord-Friendly
- State Mississippi
- 90 Strongly Landlord-Friendly · R+11
- County
- — inherits STATE
- City
- — inherits STATE
ZIP-level market 39110
- Home prices YoY
- -28.3%
- Rents YoY
- 2.6%
- Active inventory
- 634
- Price-to-rent
- 11.3×
Monthly cashflow live
- Estimated rent
- $2,723 medium interval (Pro) →
- Mortgage (P&I)
- −$1,940
- Tax from tax record
- −$159 /mo · $1,913/yr
- Insurance
- −$154
- HOA
- −$96
- Vacancy / Maint / Mgmt
- −$572
- Net cashflow
- $-198
Break-even live
Sensitivity live
| Price | -10% $11 | -5% $-93 | +0% $-198 | +5% $-303 | +10% $-408 |
|---|---|---|---|---|---|
| Rent | -10% $-413 | -5% $-306 | +0% $-198 | +5% $-91 | +10% $17 |
| Rate | -1.0pp $-12 | -0.5pp $-104 | base $-198 | +0.5pp $-294 | +1.0pp $-392 |
UW: 25.0% down · 7.5% · 30yr · 1.5% tax · 5.0% vac · 8.0% maint · 8.0% mgmt
Financing live
Cash to close
- Down payment
- $92,475
- Closing costs
- $11,097
- Reserves months
- —
- Total cash needed
- —
Loan-product check · same deal, 3 products live
Conventional
25% down · 7.5% · 30yr
- Down + closing
- —
- Monthly P&I
- —
- Monthly cashflow
- —
- DSCR
- —
- Eligible?
- —
Personal DTI + credit; lowest rate.
DSCR
20% down · 8.5% · 30yr
- Down + closing
- —
- Monthly P&I
- —
- Monthly cashflow
- —
- DSCR
- —
- Eligible?
- —
No personal income docs; deal must DSCR.
Hard money
10% down · 12.0% · 12mo
- Down + closing
- —
- Monthly P&I
- —
- Monthly cashflow
- —
- DSCR
- —
- Eligible?
- —
Short-term bridge; refi at stabilization.
Rent comps 3 comps
| Address | Beds | Baths | Sqft | Rent | $/sqft | DOM | Units | Dist |
|---|---|---|---|---|---|---|---|---|
| 108 Buckeye Dr Madison, MS | 4.0 | 3.5 | 2400 | $2,650 | $1.10 | 46d | 1 | 0.97mi |
| 100 Mason Way Madison, MS | 3.0 | 2.0 | 1614 | $2,600 | $1.61 | 45d | 1 | 1.01mi |
| 125 Memory Ln Madison, MS | 3.0 | 2.0 | 1838 | $2,800 | $1.52 | 25d | 1 | 1.21mi |
HOA detail
- Monthly dues
- $96 · $1,152/yr
Listing history 34 events
-
2026-06-22days on market $369,900 Active 14 DOM
-
2026-06-18days on market $369,900 Active 11 DOM
-
2026-06-17days on market $369,900 Active 10 DOM
-
2026-06-16days on market $369,900 Active 9 DOM
-
2026-06-15days on market $369,900 Active 8 DOM
-
2026-06-14days on market $369,900 Active 6 DOM
-
2026-06-13days on market $369,900 Active 5 DOM
-
2026-06-10days on market $369,900 Active 3 DOM
-
2026-06-09days on market $369,900 Active 2 DOM
-
2026-06-07remarks 699-char remark
-
2026-06-07pricestatusdays on market $369,900 Active 1 DOM
-
2026-05-20historical
-
2026-04-21price $384,999
-
2026-03-05price $374,999
-
2026-02-20price $375,000
-
2025-12-15price $389,899
-
2025-12-02$389,900 Active
-
2021-10-01historical
-
2007-04-19soldstatus
-
2006-05-02historical
-
2005-09-30soldstatus
-
2005-09-30soldstatus
-
2005-08-19soldstatus
-
2005-06-24$199,500
-
2005-02-04$209,900
-
2002-05-16soldstatus
-
2002-05-16soldstatus
-
2002-05-07soldstatus
-
2001-10-30$195,000
-
2000-07-27$219,500
-
1995-06-05soldstatus
-
1995-06-05soldstatus
-
1995-06-05soldstatus
-
1995-06-05soldstatus
ⓘ Source: listings_history table (triggers on properties + properties_extension) + one-shot
backfill from property_details.listing_events for pre-trigger history.
Tax reassessment forecast MS · Resets to sale price
- Current annual tax
- $1,913 · $159/mo
- Projected year-2 tax
- $2,922 · $244/mo
- Expected delta
- +$1,009/yr (+$84/mo · 52.7%)
ⓘ Screening estimate from a state-policy table — verify with the county assessor before closing.
Climate risk First Street
- Flood 1/10 Low FEMA zone X (unshaded) · 0% chance over 30 yrs
- Wildfire 3/10 Moderate
- Heat 7/10 Severe 7 d/yr ≥108°F today · 20 d/yr by 30 yrs out
- Wind 8/10 Severe 80% chance of damaging wind over 30 yrs
- Air quality 2/10 Low 0 unhealthy d/yr today · 1 by 30 yrs out
Nearby sold comps map
Loading sold comps map…
Walkable amenities ~0.75 mi
Loading nearby amenities…
Taxation est. · year 1
- Rental income
- $32,677
- − Mortgage interest
- −$20,720
- − Property taxes
- −$1,913
- − Insurance
- −$1,850
- − Repairs & maintenance
- −$2,614
- − Management
- −$2,614
- − HOA
- −$1,152
- − Depreciation
- −$10,761
- Taxable loss
- −$8,947
- Est. tax savings @ 24.0%
- +$2,147
- After-tax cash flow
- $-230/yr
For passive investors: Depreciation is non-cash, so a rental often shows a tax loss while cash-flowing — sheltering income. Rental losses are passive: they offset passive income freely, and up to $25,000/yr can offset ordinary (W-2) income if you actively participate and your MAGI is under $100k (phasing out to $0 by $150k); unused losses carry forward. On sale, claimed depreciation is recaptured at up to 25%, and gains may owe capital-gains tax (a 1031 exchange can defer both). Figures are a year-1 estimate at your 24.0% rate — not tax advice; consult a CPA.
Schools (NCES district)
- District
- Canton Public School District
- NCES district ID
- 2800900
- Math proficiency
- 13% ▼ -20.00%
- Reading proficiency
- 19% ▼ -5.00%
- Median HH income
- $38,130
- Composite
- 13.44/100
- National rank
- #9523
- State rank
- #100 of 130 in MS
Livability — Madison
- Score
- 81/100
- State rank
- #4
- US rank
- #1556
Category grades
Schools grade is shown separately in the Schools card above.
Census & demographics
- County
- Madison County · 75,005 people
- City population
- 50,443
- Metro
- Jackson, MS
- Population (ZIP)
- 50,443
- Household income
- $125,506
- Rent vs Own
- Severe rent burden
- 227.0
Population outlook (Madison County) Hauer SSP2
- Today (2025)
- 122,509 people
- By 2030
- 131,737 · +7.5%
- By 2040
- 148,930 · +21.6%
- By 2050
- 164,300 · +34.1%
- By 2075
- 197,495 · +61.2%
- By 2100
- 211,429 · +72.6%
Race, ethnicity, and origin ACS 2023
- Neighborhood character
- Predominantly White (76%)
- Race & ethnicity
- White 76% Black 15% Asian 4% Two or more races 3% Hispanic / Latino 2%
- Common ancestry
- Italian 6% Slovak 3% Lithuanian 3%
- Foreign-born
- 5% · China, Canada
- Languages at home
- 92% English-only · Spanish 2% Other Indo-European 2% Chinese 1%
Political lean MEDSL · Madison
- 2024 margin
- R (+17.3) · D 40.8% · R 58.0% · Other 1.2%
- 2008→2024 swing
- -1.7pp toward R · 2008: -15.6pp · 2024: -17.3pp
- All cycles
- 2024: R+17.3 2020: R+11.8 2016: R+16.1 2012: R+15.7 2008: R+15.6
Not yet ingested
- Civics
- —
Market trends
- HPI YoY
- ▼ -60.99%
- Current HPI
- 154.6909
- Rent YoY
- ▲ 2.61%
- Metro
- Jackson, MS
- State GDP YoY
- —
- F500 in state
- 0
Price history
+68.5% since first listed24 events — show timeline
- 2026-06-06 Listed $369,900 MLSU
- 2026-05-20 Listing Removed — MLSU
- 2026-04-21 Price Changed $384,999 MLSU
- 2026-03-05 Price Changed $374,999 MLSU
- 2026-02-20 Price Changed $375,000 MLSU
- 2025-12-15 Price Changed $389,899 MLSU
- 2025-12-02 Listed $389,900 MLSU
- 2021-10-01 Listing Removed — MLSU
- 2007-04-19 Sold (Public Records) — Public Records
- 2006-05-02 Listing Removed — MLSU
- 2005-09-30 Sold (Public Records) — Public Records
- 2005-09-30 Sold (Public Records) — Public Records
- 2005-08-19 Sold (MLS) — MLSU
- 2005-06-24 Listed $199,500 MLSU
- 2005-02-04 Listed $209,900 MLSU
- 2002-05-16 Sold (Public Records) — Public Records
- 2002-05-16 Sold (Public Records) — Public Records
- 2002-05-07 Sold (MLS) — MLSU
- 2001-10-30 Listed $195,000 MLSU
- 2000-07-27 Listed $219,500 MLSU
- 1995-06-05 Sold (Public Records) — Public Records
- 1995-06-05 Sold (Public Records) — Public Records
- 1995-06-05 Sold (Public Records) — Public Records
- 1995-06-05 Sold (Public Records) — Public Records
Property tax history
+1.0%/yrLatest (2025): $1,913 · -39.7% YoY. Source: county tax records.
Cash-flow waterfall
monthlySold comps — $/sqft
last 12 mo · ≤1 miLoading sold comps…