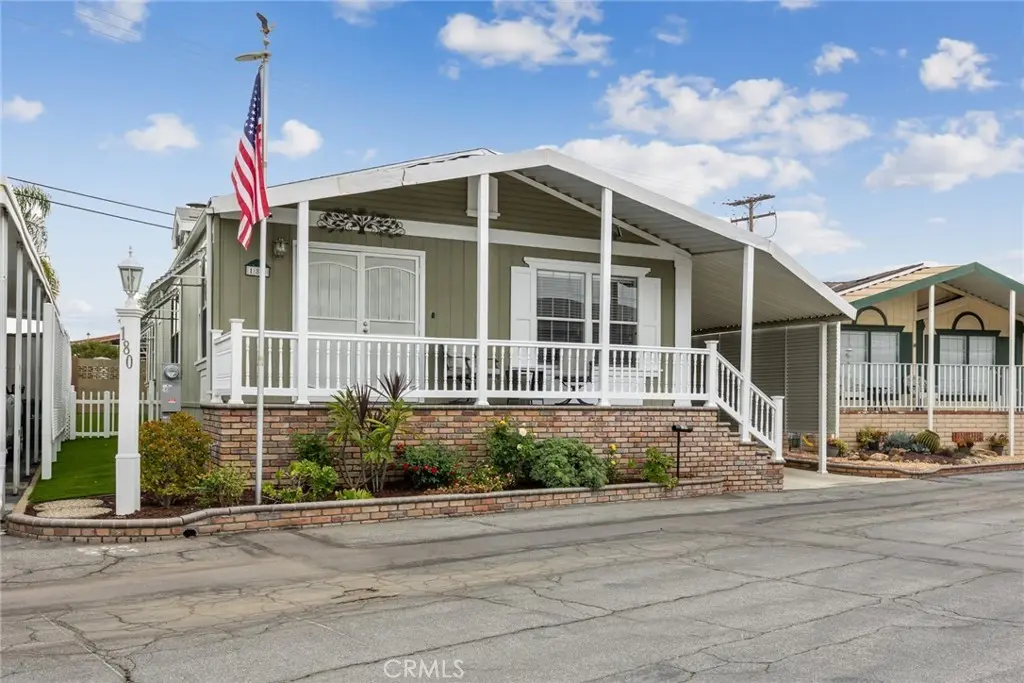
3530 Damien #180 · La Verne, CA
Flood risk 4/10 · Minor
- FEMA flood zone
- X (unshaded)
- Chance of flooding over 30 yrs
- 0.22%
- Est. flood insurance / yr
- $507 – $1,088
Fire risk 4/10 · Minor
- Est. fire insurance / yr
- $659 – $1,223
Heat risk 7/10 · Major
- Hot days now (above 98°F)
- 7 days/yr
- Hot days in 30 yrs
- 19 days/yr
Wind risk 1/10 · Minimal
- Chance of severe wind over 30 yrs
- —
Air-quality risk 8/10 · Major
- Unhealthy air days now
- 17 days/yr
- Unhealthy air days in 30 yrs
- 21 days/yr
Risk factors via First Street. Map © Google.
Why this score? — see what drove the C+ grade
The composite is a weighted blend of 9 inputs, each scored 0–100. Each bar is that input's sub-score; the figure is the points it added to the 100-point composite (weight × sub-score).
- Cash flow +23.9/30.0
- DSCR +7.7/10.0
- ARV discount +7.2/15.0
- Schools +5.9/10.0
- 1% rule +4.9/10.0
- Condition / age +4.0/5.0
- Livability +3.8/5.0
- Rent growth +3.1/5.0
- Appreciation +0.0/10.0
$235,000
🖨 Deal sheet (PDF) 📄 Offer letter ✓ Due diligence
Listing remarks MLS
Located in The Fountains Mobile Home Park, a desirable senior community in La Verne, this 1993 home has been extensively remodeled and well maintained with modern upgrades throughout. The home offers 2 bedrooms plus an additional flexible room suitable for an office, den, or guest space. Interior features include CROWN MOLDING, recessed lighting, updated flooring, a FIREPLACE, and an open-concept layout that creates a comfortable and inviting living space. The kitchen has been upgraded with QUARTZ countertops, custom cabinetry, and a center island designed for both everyday use and entertaining. Bathrooms feature custom tile showers, beautiful cabinetry, and modern finishes that provide both style and functionality. All appliances are included in the sale, including the REFRIGERATOR, WASHER, and DRYER. A flat screen TV is also included. The water heater is approximately one year old. Accessibility features include a WHEELCHAIR LIFT for easy entry. Exterior amenities include a front patio, low-maintenance ARTIFICIAL TURF and a TUFF SHED for additional storage. Move-in ready, this home offers a blend of thoughtful upgrades and comfortable living in a well-maintained senior community in La Verne. This is a rare opportunity to own a move-in-ready home in one of La Verne’s most desirable senior parks, where comfort, convenience, and community come together.
Key facts
- Community pool
- Built 1993
- Listed 75 days
Neighborhood map
What this means for you Summary
Snapshot
- This is a 2-bed/2.0-bath manufactured listed at $235k. Condition is rated good.
Deal economics
- At list price, monthly cash flow is $456 ($5k/yr) — positive.
- The deal already cash-flows at list — no discount required.
- To meet the 1% rule (rent ≥ 1% of price), the offer needs to be $232k (1.3% below list).
- Recommended offer: $221k (6.0% below list) — sets the bar for market timing.
- Cap rate 8.6% vs local median 2.9% in La Verne — top-decile yield for the area; either an underpriced asset or a hidden risk that comps aren't pricing in. Stress-test before assuming the spread holds.
Location & tenants
- Location reads 75/100 on livability (#110 in CA, #3,858 nationally) — a middle-class / working-renter tenant base. Strengths: amenities A+, employment A+, commute A; Watch: cost of living F, health & safety F.
- Bonita Unified (suburban): math 59% / reading 70% proficiency, ranked #151 of 1,400 in CA (top 11%) — acceptable for families but not a draw, mixed tenant base, ~2y average lease.
- Zoned schools: Allen Avenue Elementary (473 students, 32% FRL); Ramona Middle (1,304 students, 35% FRL); Bonita High (1,883 students, 28% FRL).
- Market conditions: Rents rising (+2.4%/yr); 97 active listings in the ZIP; 23 comparable units currently listed for rent nearby; rentals at typical pace (median 22d on market — plan ~3-4 weeks tenant-placement turnaround); 43% of comp listings sitting > 30 days — soft ceiling on asking rent; solid renter incomes; 19,697 units permitted in Los Angeles County in 2024 (9,426 in 5+ unit buildings).
Forward outlook
- Local home prices are declining (-3.0%/yr); year-one equity from $2k of loan paydown is wiped out by about $7k of value loss. Plan a longer hold.
- Los Angeles County population projected at +9% by 2050 — modest demand growth; plan on rents tracking national, not racing it.
Negotiation context
- It's been on market 76 days — a 6% lower offer ($221k) is reasonable based on typical stale-listing flexibility.
- 2 sale attempts with the ask held roughly flat each time — persistent listings suggest the price (not the market) is what's stuck; bring a comps-based counter.
Risks & watch-outs
- Climate carrying-cost: extreme-heat days projected 7→19/yr by 2055 (HVAC capex compounding) — expect insurance premiums to compound above CPI over the hold.
Questions for the listing agent
- It's been on market 76 days. Have you received any prior offers? Is the seller open to a 6% concession, seller financing, or rate buy-down credit?
- Why hasn't it sold? Are there any deal-killer items the seller is aware of (foundation, flood, title, zoning, code violations)?
- Is there a deadline driving the sale (1031 exchange, divorce, estate, relocation)? That informs how much negotiation room exists.
- Schools are A-rated — typically a magnet for longer-tenancy family renters. What's the average tenant stay here, and is there a school-zone premium baked into asking?
- What's the average days-on-market for RENTAL listings here right now (not sales)? A rising rental-DOM trend means longer vacancies and softer asking-rent achievability than the comps imply.
- What's the recent tenant-quality profile in this submarket — average credit score on applications, eviction rate, late-payment / NSF rate, and stable-employment percentage? A property-management company in the area should have these aggregated.
- How much new for-sale + rental construction is in the pipeline within 1–3 miles? Heavy new supply typically softens prices + rents 12–24 months out; constrained supply supports both.
Investment metrics
- 1% rule
- 0.99% ✗
- Cap rate
- 8.62%
- Cash-on-cash
- 8.32%
- DSCR
- 1.37
- GRM
- 8.4
CMA / ARV
- ARV (median comp)
- $233,500
- List price
- $235,000
- Delta
- 0.64%
- Verdict
- FAIR
- Comps
- 10 within 1.0 mi
Show comp detail 12 sales within ~0.75 mi
| Address | Dist | Beds/Ba | Sqft | Sold | Price | $/sf | Match |
|---|---|---|---|---|---|---|---|
| 3530 Damien #202 | 0.00mi | 2/2.0 | 1,344 (0%) | 6mo | $192,000 | $143 | 95 |
| 3530 Damien Ave #18 | 0.00mi | 2/2.0 | 1,344 (0%) | 16mo | $195,000 | $145 | 87 |
| 3530 Damien Ave #88 | 0.00mi | 2/2.0 | 1,440 (+7%) | 7mo | $91,000 | $63 | 82 |
| 3530 Damien #176 | 0.00mi | 3/2.0 (+1) | 1,434 (+7%) | 2mo | $240,000 | $167 | 82 |
| 3530 Damien Ave #152 | 0.00mi | 3/2.0 (+1) | 1,248 (-7%) | 8mo | $192,000 | $154 | 76 |
| 3620 Moreno # 47 | 0.25mi | 2/2.0 | 1,440 (+7%) | 2mo | $227,000 | $158 | 75 |
| 3530 Damien #83 | 0.00mi | 3/2.0 (+1) | 1,480 (+10%) | 4mo | $242,000 | $164 | 75 |
| 3620 Moreno Ave #64 | 0.23mi | 3/2.0 (+1) | 1,440 (+7%) | 1mo | $255,000 | $177 | 71 |
| 3620 Moreno Ave #139 | 0.23mi | 2/2.0 | 1,440 (+7%) | 12mo | $163,000 | $113 | 67 |
| 3620 Moreno Ave #127 | 0.23mi | 2/2.0 | 1,440 (+7%) | 14mo | $200,000 | $139 | 66 |
| 3530 Damien Ave #13 | 0.19mi | 2/2.0 | 1,220 (-9%) | 18mo | $155,000 | $127 | 61 |
| 3620 Moreno Ave #88 | 0.23mi | 2/2.0 | 1,200 (-11%) | 14mo | $187,000 | $156 | 60 |
Match score weights: distance 35% · size 25% · config 20% · recency 20%. Top-matched comps best support the ARV.
Projected returns pro-forma
-3.0% appreciation · 2.35% rent growth · sell at horizon
- IRR
- -4.4%
- Equity multiple
- 0.84×
- Total profit
- $-10,637
- Equity at exit
- $35,039
- IRR
- 4.6%
- Equity multiple
- 1.33×
- Total profit
- $21,585
- Equity at exit
- $20,319
Cash invested: $65,800 (down + closing). Projections, not guarantees.
Landlord ↔ Tenant lean methodology
- Overall (STATE)
- 18 Strongly Tenant-Friendly
- State California
- 18 Strongly Tenant-Friendly · D+13
- County
- — inherits STATE
- City
- — inherits STATE
ZIP-level market 91750
- Rents YoY
- 2.4%
- Active inventory
- 97
- Price-to-rent
- 8.4×
Monthly cashflow live
- Estimated rent
- $2,320 high interval (Pro) →
- Mortgage (P&I)
- −$1,232
- Tax from tax record
- −$46 /mo · $551/yr
- Insurance
- −$98
- HOA
- −$0
- Lot rent leased land?
- −$0
- Vacancy / Maint / Mgmt
- −$487
- Net cashflow
- $456
Break-even live
Sensitivity live
| Price | -10% $589 | -5% $523 | +0% $456 | +5% $390 | +10% $323 |
|---|---|---|---|---|---|
| Rent | -10% $273 | -5% $365 | +0% $456 | +5% $548 | +10% $640 |
| Rate | -1.0pp $575 | -0.5pp $516 | base $456 | +0.5pp $395 | +1.0pp $334 |
UW: 25.0% down · 7.5% · 30yr · 1.5% tax · 5.0% vac · 8.0% maint · 8.0% mgmt
Financing live
Cash to close
- Down payment
- $58,750
- Closing costs
- $7,050
- Reserves months
- —
- Total cash needed
- —
Loan-product check · same deal, 3 products live
Conventional
25% down · 7.5% · 30yr
- Down + closing
- —
- Monthly P&I
- —
- Monthly cashflow
- —
- DSCR
- —
- Eligible?
- —
Personal DTI + credit; lowest rate.
DSCR
20% down · 8.5% · 30yr
- Down + closing
- —
- Monthly P&I
- —
- Monthly cashflow
- —
- DSCR
- —
- Eligible?
- —
No personal income docs; deal must DSCR.
Hard money
10% down · 12.0% · 12mo
- Down + closing
- —
- Monthly P&I
- —
- Monthly cashflow
- —
- DSCR
- —
- Eligible?
- —
Short-term bridge; refi at stabilization.
Rent comps 23 comps
| Address | Beds | Baths | Sqft | Rent | $/sqft | DOM | Units | Dist |
|---|---|---|---|---|---|---|---|---|
| 3807 Abbey Way La Verne, CA | 3.0 | 2.0 | 1159 | $3,150 | $2.72 | 46d | 1 | 0.59mi |
| 834 Maria Ave Unit 834 La Verne, CA | 2.0 | 1.5 | 1200 | $2,700 | $2.25 | 46d | 1 | 0.63mi |
| 836 Maria Ave Unit 836 La Verne, CA | 2.0 | 1.5 | 1200 | $2,675 | $2.23 | 46d | 1 | 0.63mi |
| 1623 Heather Dr La Verne, CA | 3.0 | 1.5 | 1121 | $3,250 | $2.90 | 21d | 1 | 0.66mi |
| 2423 Pattiglen Ave Unit 2409 La Verne, CA | 2.0 | 2.0 | 960 | $2,595 | $2.70 | 1d | 1 | 0.66mi |
| 637 E Gaillard St San Dimas, CA | 3.0 | 2.0 | 1324 | $3,500 | $2.64 | 46d | 1 | 0.66mi |
| 2411 Pattiglen Ave Unit 2409 La Verne, CA | 2.0 | 2.0 | 960 | $2,595 | $2.70 | 20d | 1 | 0.67mi |
| 1825 Foothill Blvd La Verne, CA | 1.0–2.0 | 1.0–2.0 | 878 | $2,861 | $3.26 | 0d | 14 | 0.78mi |
| 205 N San Dimas Canyon Rd San Dimas, CA | 2.0 | 1.0–2.5 | 994 | $3,890 | $3.91 | 0d | 1 | 0.79mi |
| 2132 Blossom Ln La Verne, CA | 1.0–2.0 | 1.0 | 729 | $2,380 | $3.26 | 4d | 3 | 0.79mi |
| 2002 Canopy Ln La Verne, CA | 3.0 | 3.0 | 1759 | $3,450 | $1.96 | 47d | 1 | 0.85mi |
| 2063 Evergreen St La Verne, CA | 3.0 | 2.0 | 1300 | $3,200 | $2.46 | 46d | 1 | 0.95mi |
| 2064 Evergreen St La Verne, CA | 2.0 | 2.0 | 960 | $2,400 | $2.50 | 20d | 1 | 0.95mi |
| 923 Lotus Cir San Dimas, CA | 2.0 | 2.0 | 1187 | $3,200 | $2.70 | 27d | 1 | 0.97mi |
| 325 S San Dimas Canyon Rd San Dimas, CA | 4.0 | 1.0–2.0 | 1036 | $2,490 | $2.40 | 0d | 1 | 0.99mi |
| 477 E Bonita Ave San Dimas, CA | 3.0 | 1.0 | 950 | $2,395 | $2.52 | 0d | 1 | 1.03mi |
| 3748 Verdana Cir La Verne, CA | 3.0 | 3.0 | 1493 | $4,500 | $3.01 | 17d | 1 | 1.24mi |
| 3836 Verdana Cir La Verne, CA | 2.0 | 2.5 | 1243 | $3,500 | $2.82 | 46d | 1 | 1.26mi |
| 2013 Walnut St Unit B La Verne, CA | 2.0 | 1.0 | 900 | $2,800 | $3.11 | 46d | 1 | 1.28mi |
| 3816 Verdana Cir La Verne, CA | 2.0 | 2.5 | 1243 | $3,300 | $2.65 | 21d | 1 | 1.31mi |
| 168 E Baseline Rd San Dimas, CA | 3.0 | 2.5 | 1366 | $3,000 | $2.20 | 46d | 1 | 1.35mi |
| 203 Teague Dr San Dimas, CA | 2.0 | 2.0 | 1180 | $3,100 | $2.63 | 9d | 1 | 1.48mi |
| 206 Teague Dr San Dimas, CA | 2.0 | 3.0 | 1320 | $3,500 | $2.65 | 46d | 1 | 1.49mi |
Listing history 20 events
-
2026-06-22days on market $235,000 Active 76 DOM
-
2026-06-21days on market $235,000 Active 75 DOM
-
2026-06-18days on market $235,000 Active 72 DOM
-
2026-06-17days on market $235,000 Active 71 DOM
-
2026-06-16days on market $235,000 Active 70 DOM
-
2026-06-15days on market $235,000 Active 69 DOM
-
2026-06-13days on market $235,000 Active 67 DOM
-
2026-06-13days on market $235,000 Active 66 DOM
-
2026-06-09days on market $235,000 Active 63 DOM
-
2026-06-08days on market $235,000 Active 62 DOM
-
2026-06-07days on market $235,000 Active 61 DOM
-
2026-06-04days on market $235,000 Active 58 DOM
-
2026-06-03days on market $235,000 Active 57 DOM
-
2026-06-02days on market $235,000 Active 56 DOM
-
2026-06-01days on market $235,000 Active 55 DOM
-
2026-05-31days on market $235,000 Active 54 DOM
-
2026-04-07$240,000 Active 1380-char remark
Show marketing remark (1380 chars)
Located in The Fountains Mobile Home Park, a desirable senior community in La Verne, this 1993 home has been extensively remodeled and well maintained with modern upgrades throughout. The home offers 2 bedrooms plus an additional flexible room suitable for an office, den, or guest space. Interior features include CROWN MOLDING, recessed lighting, updated flooring, a FIREPLACE, and an open-concept layout that creates a comfortable and inviting living space. The kitchen has been upgraded with QUARTZ countertops, custom cabinetry, and a center island designed for both everyday use and entertaining. Bathrooms feature custom tile showers, beautiful cabinetry, and modern finishes that provide both style and functionality. All appliances are included in the sale, including the REFRIGERATOR, WASHER, and DRYER. A flat screen TV is also included. The water heater is approximately one year old. Accessibility features include a WHEELCHAIR LIFT for easy entry. Exterior amenities include a front patio, low-maintenance ARTIFICIAL TURF and a TUFF SHED for additional storage. Move-in ready, this home offers a blend of thoughtful upgrades and comfortable living in a well-maintained senior community in La Verne. This is a rare opportunity to own a move-in-ready home in one of La Verne’s most desirable senior parks, where comfort, convenience, and community come together.
-
2026-03-26historical
-
2026-02-24price $264,000
-
2025-11-02$269,000 Active
ⓘ Source: listings_history table (triggers on properties + properties_extension) + one-shot
backfill from property_details.listing_events for pre-trigger history.
Tax reassessment forecast CA · Resets to sale price
- Current annual tax
- $551 · $46/mo
- Projected year-2 tax
- $1,786 · $149/mo
- Expected delta
- +$1,235/yr (+$103/mo · 224.0%)
ⓘ Screening estimate from a state-policy table — verify with the county assessor before closing.
Climate risk First Street
- Flood 4/10 Moderate FEMA zone X (unshaded) · 22% chance over 30 yrs
- Wildfire 4/10 Moderate
- Heat 7/10 Severe 7 d/yr ≥98°F today · 19 d/yr by 30 yrs out
- Wind 1/10 Low
- Air quality 8/10 Severe 17 unhealthy d/yr today · 21 by 30 yrs out
Nearby sold comps map
Loading sold comps map…
Walkable amenities ~0.75 mi
Loading nearby amenities…
Taxation est. · year 1
- Rental income
- $27,837
- − Mortgage interest
- −$13,164
- − Property taxes
- −$551
- − Insurance
- −$1,175
- − Repairs & maintenance
- −$2,227
- − Management
- −$2,227
- − Depreciation
- −$6,836
- Taxable income
- $1,657
- Est. tax owed @ 24.0%
- −$398
- After-tax cash flow
- $5,079/yr
For passive investors: Depreciation is non-cash, so a rental often shows a tax loss while cash-flowing — sheltering income. Rental losses are passive: they offset passive income freely, and up to $25,000/yr can offset ordinary (W-2) income if you actively participate and your MAGI is under $100k (phasing out to $0 by $150k); unused losses carry forward. On sale, claimed depreciation is recaptured at up to 25%, and gains may owe capital-gains tax (a 1031 exchange can defer both). Figures are a year-1 estimate at your 24.0% rate — not tax advice; consult a CPA.
Condition & rehab AI · 12 photos
This well-maintained, extensively remodeled manufactured home in a desirable senior community offers a good investment opportunity with minimal repairs and updates needed.
Value-add opportunities
- Both Paint exterior siding — Enhances curb appeal and value
- Both Replace window screens — Improves energy efficiency and aesthetics
- Both Install smart home devices — Enhances convenience and marketability
Renovation cost estimate screening
Value-add ROI direction
- Both Paint exterior siding — Enhances curb appeal and value ↑
- Both Replace window screens — Improves energy efficiency and aesthetics ↑
- Both Install smart home devices — Enhances convenience and marketability ↑
ⓘ Cost ranges are severity-bucket heuristics (US national rule-of-thumb). Get contractor quotes + a written scope before underwriting a rehab budget.
Schools (NCES district)
- District
- Bonita Unified
- NCES district ID
- 0605610
- Math proficiency
- 59% ▲ 3.00%
- Reading proficiency
- 70% ▬ 0.00%
- Median HH income
- $76,196
- Composite
- 58.71/100
- National rank
- #2001
- State rank
- #151 of 1400 in CA
Livability — La Verne
- Score
- 75/100
- State rank
- #110
- US rank
- #3858
Category grades
Schools grade is shown separately in the Schools card above.
Census & demographics
- Census place
- La Verne, CA
- County
- Los Angeles County · 9,444,647 people
- City population
- 32,692
- Metro
- Los Angeles-Long Beach-Anaheim, CA
- Population (ZIP)
- 32,692
- Household income
- $104,195
- Rent vs Own
- Severe rent burden
- 872.0
Population outlook (Los Angeles County) Hauer SSP2
- Today (2025)
- 10,940,515 people
- By 2030
- 11,256,481 · +2.9%
- By 2040
- 11,729,929 · +7.2%
- By 2050
- 11,948,407 · +9.2%
- By 2075
- 11,818,114 · +8.0%
- By 2100
- 10,842,928 · -0.9%
Race, ethnicity, and origin ACS 2023
- Neighborhood character
- Diverse neighborhood (Simpson 0.67)
- Race & ethnicity
- White 44% Hispanic / Latino 36% Two or more races 20% Asian 10% Black 4%
- Hispanic origin (detail)
- Mexican 31%
- Common ancestry
- Lithuanian 3% Slovak 2% Romanian 1%
- Foreign-born
- 17% · Canada, China, South Korea
- Languages at home
- 75% English-only · Spanish 12% Chinese 3% Other Indo-European 3%
Political lean MEDSL · Los Angeles
- 2024 margin
- Solid D (+32.9) · D 64.8% · R 31.9% · Other 3.3%
- 2008→2024 swing
- -7.4pp toward R · 2008: 40.4pp · 2024: 32.9pp
- All cycles
- 2024: D+32.9 2020: D+44.2 2016: D+48.0 2012: D+40.0 2008: D+40.4
Not yet ingested
- Civics
- —
Market trends
- HPI YoY
- ▼ -729.79%
- Current HPI
- 373.7761
- Rent YoY
- ▲ 2.35%
- Metro
- Los Angeles-Long Beach-Anaheim, CA
- State GDP YoY
- ▲ 3.21%
- F500 in state
- 116
Industry mix (Fortune 500 HQ in CA)
| Industry | F500 HQs | Revenue |
|---|---|---|
| Technology | 27 | $1,492B |
|
||
| Financial Services | 3 | $174B |
|
||
| Retail | 3 | $44B |
|
||
| Insurance | 3 | $26B |
|
||
| Media / Entertainment | 2 | $115B |
|
||
| Pharmaceuticals / Biotech | 2 | $62B |
|
||
Price history
-10.8% since first listed4 events — show timeline
- 2026-04-07 Listed $240,000 CRMLS
- 2026-03-26 Listing Removed — CRMLS
- 2026-02-24 Price Changed $264,000 CRMLS
- 2025-11-02 Listed $269,000 CRMLS
Property tax history
+7.0%/yrLatest (2025): $551 · +7.0% YoY. Source: county tax records.
Cash-flow waterfall
monthlySold comps — $/sqft
last 12 mo · ≤1 miLoading sold comps…