3415 Twining · San Antonio, TX
Flood risk 1/10 · Minimal
- FEMA flood zone
- X (unshaded)
- Chance of flooding over 30 yrs
- 0.0%
- Est. flood insurance / yr
- $507 – $1,088
Fire risk 4/10 · Minor
- Est. fire insurance / yr
- $1,222 – $2,270
Heat risk 8/10 · Major
- Hot days now (above 109°F)
- 7 days/yr
- Hot days in 30 yrs
- 24 days/yr
Wind risk 8/10 · Major
- Chance of severe wind over 30 yrs
- 80.0%
Air-quality risk 2/10 · Minimal
- Unhealthy air days now
- 0 days/yr
- Unhealthy air days in 30 yrs
- 1 days/yr
Risk factors via First Street. Map © Google.
Why this score? — see what drove the C+ grade
The composite is a weighted blend of 9 inputs, each scored 0–100. Each bar is that input's sub-score; the figure is the points it added to the 100-point composite (weight × sub-score).
- Cash flow +18.2/30.0
- ARV discount +15.0/15.0
- 1% rule +6.8/10.0
- DSCR +5.7/10.0
- Appreciation +4.8/10.0
- Livability +4.0/5.0
- Rent growth +2.5/5.0
- Condition / age +2.5/5.0
- Schools +2.2/10.0
$130,000
🖨 Deal sheet (PDF) 📄 Offer letter ✓ Due diligence
Listing remarks MLS
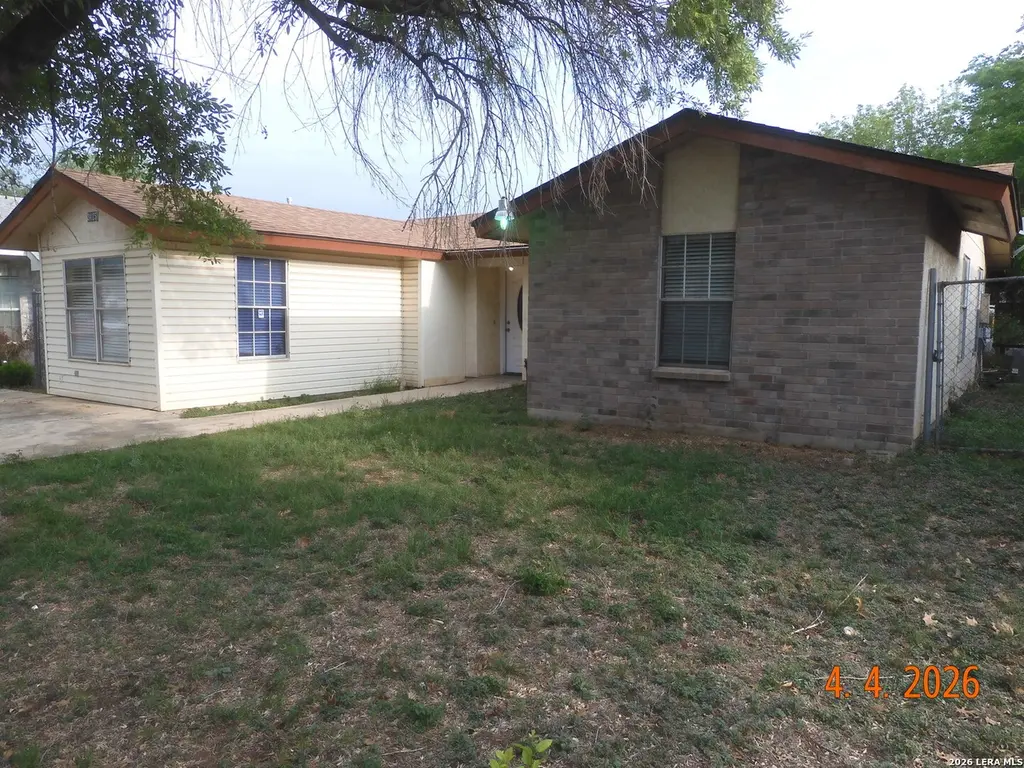
SCHEDULE YOUR PRIVATE SHOWING TODAY AND COME SEE ALL THIS HOME HAS TO OFFER! SUBMIT YOUR OFFER-THIS MOTIVATED SELLER IS OPEN TO NEGOTIATIONS AND EVEN OFFERING ASSISTANCE TO QUALIFIED BUYERS, MAKING THIS AN OPPORTUNITY YOU DON'T WANT TO MISS. Step into comfort and convenience with this charming 3-bedroom, 1.5-bath home designed for both everyday living and entertaining. Offering ample space throughout, you'll love the inviting family den-perfect for relaxing or hosting guests-along with a versatile converted garage that can easily serve as a home office, gym, or additional living area. This move-in ready property is ideally located close to shopping, dining, schools, and major routes, putting everything you need just minutes away. Best of all, it's priced to sell, making it an incredible opportunity for buyers looking to get great value without compromising on space or location.
Key facts
- Converted garage
- Close to dining
- Gym
Tags
Neighborhood map
What this means for you Summary
Snapshot
- This is a 3-bed/1.0-bath single-family listed at $130k.
Deal economics
- At list price, monthly cash flow is $116 ($1k/yr) — positive.
- The deal already cash-flows at list — no discount required.
- Meets the 1% rule at list price ($2k rent vs $130k).
- Recommended offer: $126k (3.0% below list) — sets the bar for market timing.
- Cap rate 7.4% vs local median 3.8% in San Antonio — top-decile yield for the area; either an underpriced asset or a hidden risk that comps aren't pricing in. Stress-test before assuming the spread holds.
Location & tenants
- Location reads 80/100 on livability (#31 in TX, #1,616 nationally) — a professional / high-income tenant draw. Strengths: amenities A+, commute A+, cost of living A+; Watch: crime F.
- Southwest ISD (rural): math 21% / reading 31% proficiency, ranked #701 of 826 in TX (top 85%) — low school quality limits family demand, transient renter base, plan for 1-2y turnover; 75% free/reduced lunch — lower-income household profile, screen leases tightly.
- Zoned schools: Bob Hope El (math 22% / reading 35%, grade F, #2,706 of 4,322 statewide, top 63%, 454 students, 87% FRL); Ronald E Mcnair Middle (math 27% / reading 31%, grade F, #1,103 of 1,662 statewide, top 67%, 748 students, 77% FRL); Southwest H S (math 17% / reading 39%, grade F, #1,170 of 1,632 statewide, top 72%, 2,152 students, 72% FRL) — zoned schools at 78% FRL track the district average.
- Market conditions: 162 active listings in the ZIP; 40 comparable units currently listed for rent nearby; rentals at typical pace (median 26d on market — plan ~3-4 weeks tenant-placement turnaround); 8,308 units permitted in Bexar County in 2024 (2,506 in 5+ unit buildings).
- This rent runs 33% of the median local income ($55k/yr) — at the standard rent-burdened threshold; future hikes will face affordability resistance.
Forward outlook
- In year one you build about $315 of equity ($899 loan paydown + $-584 appreciation (-0.5% local appreciation)).
- Bexar County population projected at +50% by 2050 — long-run rental-demand tailwind backs the buy-and-hold thesis.
Negotiation context
- It's been on market 60 days — a 3% lower offer ($126k) is reasonable based on typical stale-listing flexibility.
- 2 sale attempts; this cycle's ask has dropped $17k (12%) from the opening price — seller is motivated, your offer sets the floor, not the list.
Risks & watch-outs
- Watch-outs: property tax is 3.3% of price.
- Climate carrying-cost: severe wind risk, 80% chance of damaging wind over 30y; extreme-heat days projected 7→24/yr by 2055 (HVAC capex compounding) — expect insurance premiums to compound above CPI over the hold.
Questions for the listing agent
- It's been on market 60 days. Have you received any prior offers? Is the seller open to a 3% concession, seller financing, or rate buy-down credit?
- Property tax is high relative to price — has the assessment been appealed recently, and will the sale trigger a re-assessment?
- Is there a deadline driving the sale (1031 exchange, divorce, estate, relocation)? That informs how much negotiation room exists.
- Crime grade is F in this area — have there been break-ins, vandalism, or insurance claims at this property in the last 3 years? What carrier currently insures it and at what premium?
- What's the average days-on-market for RENTAL listings here right now (not sales)? A rising rental-DOM trend means longer vacancies and softer asking-rent achievability than the comps imply.
- What's the recent tenant-quality profile in this submarket — average credit score on applications, eviction rate, late-payment / NSF rate, and stable-employment percentage? A property-management company in the area should have these aggregated.
- How much new for-sale + rental construction is in the pipeline within 1–3 miles? Heavy new supply typically softens prices + rents 12–24 months out; constrained supply supports both.
Investment metrics
- 1% rule
- 1.18% ✓
- Cap rate
- 7.36%
- Cash-on-cash
- 3.82%
- DSCR
- 1.17
- GRM
- 7.1
CMA / ARV
- ARV (median comp)
- $190,959
- List price
- $130,000
- Delta
- -31.92%
- Verdict
- UNDERPRICED
- Comps
- 20 within 1.0 mi
Show comp detail 12 sales within ~0.75 mi
| Address | Dist | Beds/Ba | Sqft | Sold | Price | $/sf | Match |
|---|---|---|---|---|---|---|---|
| 3415 Twining | 0.00mi | 3/1.5 | 1,267 (0%) | 0mo | $130,000 | $103 | 98 |
| 446 Tedder | 0.29mi | 3/2.0 | 1,286 (+2%) | 3mo | $185,000 | $144 | 78 |
| 3311 Rosita | 0.30mi | 3/2.0 | 1,205 (-5%) | 5mo | $209,500 | $174 | 70 |
| 266 Ike St | 0.41mi | 3/2.0 | 1,200 (-5%) | 2mo | $179,700 | $150 | 66 |
| 9330 Graze Land Dr | 0.70mi | 3/2.0 | 1,249 (-1%) | 6mo | $224,990 | $180 | 56 |
| 3403 Old Almonte Dr | 0.55mi | 3/2.0 | 1,377 (+9%) | 6mo | $220,318 | $160 | 51 |
| 3027 Mission Gate | 0.65mi | 3/2.0 | 1,357 (+7%) | 4mo | $199,000 | $147 | 51 |
| 322 Spaatz | 0.63mi | 3/2.0 | 1,391 (+10%) | 4mo | $254,900 | $183 | 46 |
| 3111 Old Almonte | 0.68mi | 3/2.0 | 1,354 (+7%) | 8mo | $184,900 | $137 | 46 |
| 3327 Comanche Xing | 0.60mi | 3/2.0 | 1,416 (+12%) | 7mo | $211,238 | $149 | 42 |
| 147 Bradley | 0.63mi | 3/2.0 | 1,439 (+14%) | 2mo | $205,000 | $142 | 42 |
| 3011 Old Almonte | 0.74mi | 3/2.0 | 1,425 (+12%) | 4mo | $195,000 | $137 | 37 |
Match score weights: distance 35% · size 25% · config 20% · recency 20%. Top-matched comps best support the ARV.
Projected returns pro-forma
-0.45% appreciation · 3.0% rent growth · sell at horizon
- IRR
- 0.6%
- Equity multiple
- 1.03×
- Total profit
- $1,009
- Equity at exit
- $34,855
- IRR
- 6.7%
- Equity multiple
- 1.69×
- Total profit
- $25,022
- Equity at exit
- $39,653
Cash invested: $36,400 (down + closing). Projections, not guarantees.
Landlord ↔ Tenant lean methodology
- Overall (STATE)
- 87 Strongly Landlord-Friendly
- State Texas
- 87 Strongly Landlord-Friendly · R+5
- County
- — inherits STATE
- City
- — inherits STATE
ZIP-level market 78211
- Home prices YoY
- -0.2%
- Active inventory
- 162
- Price-to-rent
- 7.1×
Monthly cashflow live
- Estimated rent
- $1,534 high interval (Pro) →
- Mortgage (P&I)
- −$682
- Tax from tax record
- −$360 /mo · $4,323/yr
- Insurance
- −$54
- HOA
- −$0
- Vacancy / Maint / Mgmt
- −$322
- Net cashflow
- $116
Break-even live
Sensitivity live
| Price | -10% $190 | -5% $153 | +0% $116 | +5% $79 | +10% $42 |
|---|---|---|---|---|---|
| Rent | -10% $-5 | -5% $55 | +0% $116 | +5% $177 | +10% $237 |
| Rate | -1.0pp $181 | -0.5pp $149 | base $116 | +0.5pp $82 | +1.0pp $48 |
UW: 25.0% down · 7.5% · 30yr · 1.5% tax · 5.0% vac · 8.0% maint · 8.0% mgmt
Financing live
Cash to close
- Down payment
- $32,500
- Closing costs
- $3,900
- Reserves months
- —
- Total cash needed
- —
Loan-product check · same deal, 3 products live
Conventional
25% down · 7.5% · 30yr
- Down + closing
- —
- Monthly P&I
- —
- Monthly cashflow
- —
- DSCR
- —
- Eligible?
- —
Personal DTI + credit; lowest rate.
DSCR
20% down · 8.5% · 30yr
- Down + closing
- —
- Monthly P&I
- —
- Monthly cashflow
- —
- DSCR
- —
- Eligible?
- —
No personal income docs; deal must DSCR.
Hard money
10% down · 12.0% · 12mo
- Down + closing
- —
- Monthly P&I
- —
- Monthly cashflow
- —
- DSCR
- —
- Eligible?
- —
Short-term bridge; refi at stabilization.
Rent comps 40 comps
| Address | Beds | Baths | Sqft | Rent | $/sqft | DOM | Units | Dist |
|---|---|---|---|---|---|---|---|---|
| 3439 Twining Dr San Antonio, TX | 3.0 | 1.0 | 1124 | $1,500 | $1.33 | 19d | 1 | 0.03mi |
| 3411 Avoca Dr San Antonio, TX | 3.0 | 2.0 | 1426 | $1,460 | $1.02 | 6d | 1 | 0.12mi |
| 3411 Avoca Dr San Antonio, TX | 3.0 | 2.0 | 1426 | $1,460 | $1.02 | 19d | 1 | 0.12mi |
| 3331 Rosita Way San Antonio, TX | 3.0 | 2.5 | 1848 | $1,800 | $0.97 | 45d | 1 | 0.32mi |
| 3727 Aragon Dr San Antonio, TX | 3.0 | 1.0 | 1060 | $1,400 | $1.32 | 45d | 1 | 0.34mi |
| 12305 SW Loop 410 San Antonio, TX | 1.0–4.0 | 1.0–2.0 | 1036 | $1,318 | $1.27 | 18d | 1 | 0.40mi |
| 3723 Somers Crst San Antonio, TX | 3.0 | 2.5 | 1529 | $1,650 | $1.08 | 45d | 1 | 0.45mi |
| 9435 Dogwood Hl San Antonio, TX | 3.0 | 2.5 | 1529 | $1,600 | $1.05 | 45d | 1 | 0.49mi |
| 3263 Rancho Grande San Antonio, TX | 3.0 | 2.0 | 1500 | $1,650 | $1.10 | 25d | 1 | 0.50mi |
| 3811 Somers Crst San Antonio, TX | 3.0 | 2.5 | 1529 | $1,650 | $1.08 | 45d | 1 | 0.51mi |
| 9422 Somers Bnd San Antonio, TX | 3.0 | 2.5 | 1419 | $1,575 | $1.11 | 45d | 1 | 0.52mi |
| 9402 Somers Bnd San Antonio, TX | 3.0 | 2.5 | 1529 | $1,600 | $1.05 | 12d | 1 | 0.52mi |
| 9334 Somers Bnd San Antonio, TX | 3.0 | 2.5 | 1272 | $1,515 | $1.19 | 6d | 1 | 0.53mi |
| 9306 Somers Bnd San Antonio, TX | 3.0 | 2.5 | 1420 | $1,600 | $1.13 | 25d | 1 | 0.53mi |
| 9407 Somers Bnd San Antonio, TX | 3.0 | 2.5 | 1310 | $1,525 | $1.16 | 25d | 1 | 0.55mi |
| 10127 State Highway 16 S San Antonio, TX | 2.0–4.0 | 2.0 | 1125 | $1,200 | $1.07 | 4d | 26 | 0.60mi |
| 10127 Texas 16 Unit 710 San Antonio, TX | 2.0 | 2.0 | 950 | $807 | $0.85 | 18d | 1 | 0.60mi |
| 10414 Espada Pass San Antonio, TX | 3.0 | 2.0 | 1416 | $1,600 | $1.13 | 45d | 1 | 0.61mi |
| 9419 Graze Br San Antonio, TX | 3.0 | 2.0 | 1242 | $1,550 | $1.25 | 19d | 1 | 0.65mi |
| 4007 Somers Crst San Antonio, TX | 3.0 | 2.0 | 1242 | $1,525 | $1.23 | 6d | 1 | 0.67mi |
| 9323 Somerset Rd Unit 710 San Antonio, TX | 2.0 | 2.0 | 954 | $973 | $1.02 | 0d | 1 | 0.78mi |
| 9257 Somerset Rd Unit 710 San Antonio, TX | 2.0 | 2.0 | 1133 | $1,165 | $1.03 | 0d | 1 | 0.86mi |
| 9447 Tarbutton Trl San Antonio, TX | 3.0 | 2.0 | 1007 | $1,550 | $1.54 | 18d | 1 | 0.95mi |
| 4039 Imogene Ivy San Antonio, TX | 3.0 | 2.0 | 1200 | $1,550 | $1.29 | 25d | 1 | 1.01mi |
| 4111 Imogene Ivy San Antonio, TX | 3.0 | 2.0 | 1276 | $1,700 | $1.33 | 5d | 1 | 1.04mi |
| 11009 Valley Star Dr San Antonio, TX | 4.0 | 1.5 | 1004 | $1,450 | $1.44 | 6d | 1 | 1.08mi |
| 3911 Bates Pl San Antonio, TX | 3.0 | 2.0 | 1200 | $1,450 | $1.21 | 25d | 1 | 1.14mi |
| 9122 Campbell Way San Antonio, TX | 3.0 | 2.0 | 1354 | $1,495 | $1.10 | 4d | 1 | 1.15mi |
| 3810 Kurz Plz S San Antonio, TX | 3.0 | 2.0 | 1266 | $550 | $0.43 | 25d | 1 | 1.16mi |
| 9018 Chaminade Dr San Antonio, TX | 3.0 | 1.5 | 1056 | $1,675 | $1.59 | 45d | 1 | 1.18mi |
| 3903 Kurz Plz S San Antonio, TX | 4.0 | 2.0 | 1627 | $2,000 | $1.23 | 0d | 1 | 1.22mi |
| 2350 Redlove Dr San Antonio, TX | 3.0 | 2.5 | 1420 | $1,675 | $1.18 | 25d | 1 | 1.22mi |
| 2343 Applewhite Mdw San Antonio, TX | 4.0 | 2.5 | 1798 | $1,795 | $1.00 | 25d | 1 | 1.25mi |
| 2330 Redlove Dr San Antonio, TX | 3.0 | 2.5 | 1420 | $1,600 | $1.13 | 6d | 1 | 1.25mi |
| 2335 Applewhite Mdw San Antonio, TX | 3.0 | 2.5 | 1529 | $1,550 | $1.01 | 6d | 1 | 1.26mi |
| 2350 Dry Moss Way San Antonio, TX | 3.0 | 2.5 | 1420 | $1,650 | $1.16 | 45d | 1 | 1.29mi |
| 2318 Applewhite Mdw San Antonio, TX | 4.0 | 2.5 | 1798 | $1,795 | $1.00 | 25d | 1 | 1.30mi |
| 2307 Applewhite Mdw San Antonio, TX | 4.0 | 2.5 | 1798 | $1,750 | $0.97 | 45d | 1 | 1.30mi |
| 11318 Clearmine St Unit 103 South Southwest, TX | 3.0 | 2.5 | 1362 | $1,514 | $1.11 | 45d | 1 | 1.36mi |
| 11318 Clearmine St Unit 104 South Southwest, TX | 3.0 | 2.5 | 1362 | $1,700 | $1.25 | 45d | 1 | 1.36mi |
Listing history 12 events
-
2026-06-04status $130,000 Pending 60 DOM
-
2026-06-03days on market $130,000 Active Option 60 DOM
-
2026-06-02days on market $130,000 Active Option 59 DOM
-
2026-06-01days on market $130,000 Active Option 58 DOM
-
2026-05-31days on market $130,000 Active Option 57 DOM
-
2026-04-29price $130,000 891-char remark
Show marketing remark (891 chars)
SCHEDULE YOUR PRIVATE SHOWING TODAY AND COME SEE ALL THIS HOME HAS TO OFFER! SUBMIT YOUR OFFER-THIS MOTIVATED SELLER IS OPEN TO NEGOTIATIONS AND EVEN OFFERING ASSISTANCE TO QUALIFIED BUYERS, MAKING THIS AN OPPORTUNITY YOU DON'T WANT TO MISS. Step into comfort and convenience with this charming 3-bedroom, 1.5-bath home designed for both everyday living and entertaining. Offering ample space throughout, you'll love the inviting family den-perfect for relaxing or hosting guests-along with a versatile converted garage that can easily serve as a home office, gym, or additional living area. This move-in ready property is ideally located close to shopping, dining, schools, and major routes, putting everything you need just minutes away. Best of all, it's priced to sell, making it an incredible opportunity for buyers looking to get great value without compromising on space or location.
-
2026-04-04$146,900 New 891-char remark
Show marketing remark (891 chars)
SCHEDULE YOUR PRIVATE SHOWING TODAY AND COME SEE ALL THIS HOME HAS TO OFFER! SUBMIT YOUR OFFER-THIS MOTIVATED SELLER IS OPEN TO NEGOTIATIONS AND EVEN OFFERING ASSISTANCE TO QUALIFIED BUYERS, MAKING THIS AN OPPORTUNITY YOU DON'T WANT TO MISS. Step into comfort and convenience with this charming 3-bedroom, 1.5-bath home designed for both everyday living and entertaining. Offering ample space throughout, you'll love the inviting family den-perfect for relaxing or hosting guests-along with a versatile converted garage that can easily serve as a home office, gym, or additional living area. This move-in ready property is ideally located close to shopping, dining, schools, and major routes, putting everything you need just minutes away. Best of all, it's priced to sell, making it an incredible opportunity for buyers looking to get great value without compromising on space or location.
-
2025-12-31historical
-
2025-12-05price $174,999
-
2025-06-12$179,999 New
-
2005-02-04soldstatus
-
1987-05-01soldstatus
ⓘ Source: listings_history table (triggers on properties + properties_extension) + one-shot
backfill from property_details.listing_events for pre-trigger history.
Tax reassessment forecast TX · Resets to sale price
- Current annual tax
- $4,323 · $360/mo
- Projected year-2 tax
- $4,323 · $360/mo
- Expected delta
- $0/yr ($0/mo · 0.0%)
ⓘ Screening estimate from a state-policy table — verify with the county assessor before closing.
Climate risk First Street
- Flood 1/10 Low FEMA zone X (unshaded) · 0% chance over 30 yrs
- Wildfire 4/10 Moderate
- Heat 8/10 Severe 7 d/yr ≥109°F today · 24 d/yr by 30 yrs out
- Wind 8/10 Severe 80% chance of damaging wind over 30 yrs
- Air quality 2/10 Low 0 unhealthy d/yr today · 1 by 30 yrs out
Nearby sold comps map
Loading sold comps map…
Walkable amenities ~0.75 mi
Loading nearby amenities…
Taxation est. · year 1
- Rental income
- $18,413
- − Mortgage interest
- −$7,282
- − Property taxes
- −$4,323
- − Insurance
- −$650
- − Repairs & maintenance
- −$1,473
- − Management
- −$1,473
- − Depreciation
- −$3,782
- Taxable loss
- −$571
- Est. tax savings @ 24.0%
- +$137
- After-tax cash flow
- $1,529/yr
For passive investors: Depreciation is non-cash, so a rental often shows a tax loss while cash-flowing — sheltering income. Rental losses are passive: they offset passive income freely, and up to $25,000/yr can offset ordinary (W-2) income if you actively participate and your MAGI is under $100k (phasing out to $0 by $150k); unused losses carry forward. On sale, claimed depreciation is recaptured at up to 25%, and gains may owe capital-gains tax (a 1031 exchange can defer both). Figures are a year-1 estimate at your 24.0% rate — not tax advice; consult a CPA.
Schools (NCES district)
- District
- Southwest ISD
- NCES district ID
- 4840950
- Math proficiency
- 21% ▼ -21.00%
- Reading proficiency
- 31% ▼ -5.00%
- Median HH income
- $43,362
- Composite
- 22.22/100
- National rank
- #8153
- State rank
- #701 of 826 in TX
Livability — San Antonio
- Score
- 80/100
- State rank
- #31
- US rank
- #1616
Category grades
Schools grade is shown separately in the Schools card above.
Census & demographics
- Census place
- San Antonio, TX
- County
- Bexar County · 1,990,555 people
- City population
- 1,806,925
- Metro
- San Antonio-New Braunfels, TX
- Population (ZIP)
- 30,857
- Household income
- $55,436
- Rent vs Own
- Severe rent burden
- 729.0
Population outlook (Bexar County) Hauer SSP2
- Today (2025)
- 2,336,851 people
- By 2030
- 2,560,728 · +9.6%
- By 2040
- 3,020,569 · +29.3%
- By 2050
- 3,493,522 · +49.5%
- By 2075
- 4,668,459 · +99.8%
- By 2100
- 5,533,242 · +136.8%
Race, ethnicity, and origin ACS 2023
- Neighborhood character
- Predominantly Hispanic (93%)
- Race & ethnicity
- Hispanic / Latino 93% Two or more races 30% White 5% Black 1% Native American 1%
- Hispanic origin (detail)
- Mexican 76%
- Foreign-born
- 18% · Canada
- Languages at home
- 35% English-only · Spanish 65%
Political lean MEDSL · Bexar
- 2024 margin
- Lean D (+9.8) · D 54.3% · R 44.6% · Other 1.1%
- 2008→2024 swing
- +4.2pp toward D · 2008: 5.6pp · 2024: 9.8pp
- All cycles
- 2024: D+9.8 2020: D+18.2 2016: D+13.5 2012: D+4.6 2008: D+5.6
Not yet ingested
- Civics
- —
Market trends
- HPI YoY
- ▼ -0.45%
- Current HPI
- 241.1709
- Rent YoY
- —
- Metro
- San Antonio-New Braunfels, TX
- State GDP YoY
- ▲ 3.95%
- F500 in state
- 110
Industry mix (Fortune 500 HQ in TX)
| Industry | F500 HQs | Revenue |
|---|---|---|
| Energy | 16 | $1,198B |
|
||
| Technology | 5 | $198B |
|
||
| Engineering / Construction | 4 | $72B |
|
||
| Energy Services | 3 | $60B |
|
||
| Utilities | 3 | $41B |
|
||
| Healthcare | 2 | $330B |
|
||
Price history
-27.8% since first listed7 events — show timeline
- 2026-04-29 Price Changed $130,000 LERA
- 2026-04-04 Listed $146,900 LERA
- 2025-12-31 Listing Removed — LERA
- 2025-12-05 Price Changed $174,999 LERA
- 2025-06-12 Listed $179,999 LERA
- 2005-02-04 Sold (Public Records) — Public Records
- 1987-05-01 Sold (Public Records) — Public Records
Property tax history
+6.1%/yrLatest (2025): $4,323 · +8.3% YoY. Source: county tax records.
Cash-flow waterfall
monthlySold comps — $/sqft
last 12 mo · ≤1 miLoading sold comps…