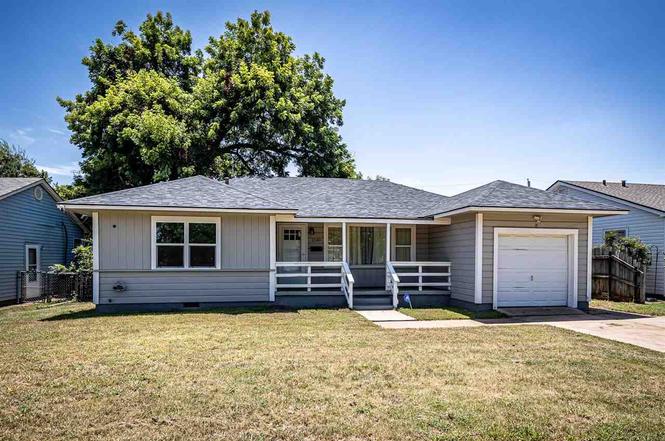
2140 NW Smith Ave · Lawton, OK
Flood risk 1/10 · Minimal
- FEMA flood zone
- X (unshaded)
- Chance of flooding over 30 yrs
- 0.0%
- Est. flood insurance / yr
- $507 – $1,088
Fire risk 6/10 · Moderate
- Est. fire insurance / yr
- $2,463 – $4,575
Heat risk 6/10 · Moderate
- Hot days now (above 108°F)
- 7 days/yr
- Hot days in 30 yrs
- 19 days/yr
Wind risk 2/10 · Minimal
- Chance of severe wind over 30 yrs
- 4.0%
Air-quality risk 1/10 · Minimal
- Unhealthy air days now
- 0 days/yr
- Unhealthy air days in 30 yrs
- 0 days/yr
Risk factors via First Street. Map © Google.
Why this score? — see what drove the C- grade
The composite is a weighted blend of 9 inputs, each scored 0–100. Each bar is that input's sub-score; the figure is the points it added to the 100-point composite (weight × sub-score).
- Cash flow +22.6/30.0
- ARV discount +7.5/15.0
- DSCR +7.2/10.0
- 1% rule +5.5/10.0
- Rent growth +3.8/5.0
- Livability +3.2/5.0
- Condition / age +2.5/5.0
- Schools +2.0/10.0
- Appreciation +0.0/10.0
$118,000
🖨 Deal sheet (PDF) 📄 Offer letter ✓ Due diligence
Listing remarks
Welcome to 2140 NW Smith Ave. , a beautifully maintained home nestled in a quiet, established neighborhood in Lawton. This charming property offers a perfect blend of comfort, functionality, and location. Step inside to discover a spacious living area with abundant natural light and neutral tones throughout—ready for your personal touch. The kitchen features ample cabinetry and counter space, ideal for everyday living or entertaining guests. Generously sized bedrooms provide peaceful retreats, and the backyard offers plenty of space for outdoor activities or relaxing evenings under the stars. Conveniently located near schools, parks, shopping, and Fort Sill, this home is move-in ready
Key facts
- Ample cabinetry
- Near shopping
- Spacious living area
Tags
Property features AI
Exterior
- Parking: 1 total parking space; 1 covered space; 1-car garage with side-facing door and opener
- Security: Smoke detector(s); Carbon monoxide detector(s)
- Utilities: Public water; Public sewer; Natural gas available
- Home design: Single family residence; Single-story; Residential property; R-1 Single Family zoning
- Construction: Vinyl siding; Composition roof; Built on crawl space
- Exterior features: Covered porch; Covered patio; Chain link fencing; Storm doors
Interior
- Kitchen: Microwave; Dishwasher; Refrigerator; Oven; Gas water heater
- Bedrooms:
- Flooring: Ceramic tile; Hardwood
- Bathrooms: 1 full bathroom
- Heating & cooling: Central heating; Central air; Electric cooling; Ceiling fan(s)
- Interior features: Double pane windows; Updated/remodeled condition; Crawl space basement
- Laundry & utility: Washer hookup; Laundry area in garage
Neighborhood map
What this means for you Summary
Snapshot
- This is a 3-bed/1.0-bath single-family listed at $118k.
Deal economics
- At list price, monthly cash flow is $201 ($2k/yr) — positive.
- The deal already cash-flows at list — no discount required.
- Meets the 1% rule at list price ($1k rent vs $118k).
- Recommended offer: $104k (12.0% below list) — sets the bar for market timing.
- Cap rate 8.3% vs local median 6.0% in Lawton — top-decile yield for the area; either an underpriced asset or a hidden risk that comps aren't pricing in. Stress-test before assuming the spread holds.
Location & tenants
- Location reads 63/100 on livability (#206 in OK) — a middle-class / working-renter tenant base. Strengths: cost of living A+, housing A+; Watch: employment D, crime F, commute F.
- Lawton (urban): math 20% / reading 26% proficiency, ranked #137 of 270 in OK (top 51%) — low school quality limits family demand, transient renter base, plan for 1-2y turnover.
- Zoned schools: Ridgecrest Es (math 27% / reading 17%, grade F, #413 of 845 statewide, top 54%, 453 students, 0% FRL); Central Ms (math 17% / reading 24%, grade F, #153 of 345 statewide, top 45%, 994 students, 0% FRL); Lawton Hs (math 16% / reading 21%, grade F, #302 of 447 statewide, top 68%, 1,417 students, 0% FRL) — zoned schools average 0% FRL vs 54% district-wide (54 pts lower); this property's tenant base skews higher-income than the district average.
- Market conditions: Rents rising fast (+5.1%/yr); 403 active listings in the ZIP; 133 units permitted in Comanche County in 2024 (0 in 5+ unit buildings).
Forward outlook
- Local home prices are declining (-3.0%/yr); year-one equity from $816 of loan paydown is wiped out by about $4k of value loss. Plan a longer hold.
- Comanche County population projected to shrink 3% by 2050 — rents likely to lag national; underwrite the cash flow, not the appreciation.
- At projected returns (-3.0% appreciation + 5.1% rent growth), your $33k cash investment doubles in ~10 years — after that, you're playing with house money.
Negotiation context
- It's been on market 124 days — a 12% lower offer ($104k) is reasonable based on typical stale-listing flexibility.
- 8 sale attempts since 3y ago with the ask held roughly flat each time — persistent listings suggest the price (not the market) is what's stuck; bring a comps-based counter.
Risks & watch-outs
- Watch-outs: built in 1952 — expect roof / HVAC / electrical / plumbing capex.
- Climate carrying-cost: major wildfire risk; extreme-heat days projected 7→19/yr by 2055 (HVAC capex compounding) — expect insurance premiums to compound above CPI over the hold.
Questions for the listing agent
- It's been on market 124 days. Have you received any prior offers? Is the seller open to a 12% concession, seller financing, or rate buy-down credit?
- Built in 1952 — when were the roof, HVAC, electrical panel, plumbing, and water heater last replaced?
- Why hasn't it sold? Are there any deal-killer items the seller is aware of (foundation, flood, title, zoning, code violations)?
- Is there a deadline driving the sale (1031 exchange, divorce, estate, relocation)? That informs how much negotiation room exists.
- Schools are D-rated, which usually means shorter tenancies and higher turnover. Who's the typical renter profile here, and what's been the actual vacancy rate?
- Crime grade is F in this area — have there been break-ins, vandalism, or insurance claims at this property in the last 3 years? What carrier currently insures it and at what premium?
- What's the average days-on-market for RENTAL listings here right now (not sales)? A rising rental-DOM trend means longer vacancies and softer asking-rent achievability than the comps imply.
- What's the recent tenant-quality profile in this submarket — average credit score on applications, eviction rate, late-payment / NSF rate, and stable-employment percentage? A property-management company in the area should have these aggregated.
- How much new for-sale + rental construction is in the pipeline within 1–3 miles? Heavy new supply typically softens prices + rents 12–24 months out; constrained supply supports both.
Investment metrics
- 1% rule
- 1.05% ✓
- Cap rate
- 8.33%
- Cash-on-cash
- 7.29%
- DSCR
- 1.32
- GRM
- 7.9
CMA / ARV
- ARV (on-the-fly)
- $72,336
- Comps found
- 12
Show comp detail 12 sales within ~0.75 mi
| Address | Dist | Beds/Ba | Sqft | Sold | Price | $/sf | Match |
|---|---|---|---|---|---|---|---|
| 2811 NW 21st Pl | 0.30mi | 3/1.0 | 1,100 (+0%) | 9mo | $50,000 | $45 | 78 |
| 2204 NW Williams Ave | 0.07mi | 3/2.0 | 1,200 (+10%) | 0mo | $80,000 | $67 | 77 |
| 2112 NW Bessie Ave | 0.09mi | 3/1.0 | 940 (-14%) | 0mo | $62,500 | $66 | 72 |
| 2136 NW Carroll Ave | 0.28mi | 3/1.5 | 1,200 (+10%) | 2mo | $114,000 | $95 | 67 |
| 2523 NW 17th St | 0.59mi | 3/1.5 | 1,100 (+0%) | 3mo | $103,000 | $94 | 67 |
| 2205 NW Lindy Ave | 0.25mi | 2/1.0 (-1) | 1,000 (-9%) | 5mo | $49,500 | $50 | 64 |
| 1419 NW 23rd St | 0.52mi | 3/1.0 | 1,000 (-9%) | 4mo | $19,900 | $20 | 58 |
| 1809 NW Kingsbury | 0.58mi | 2/1.0 (-1) | 1,146 (+5%) | 3mo | $35,000 | $31 | 58 |
| 1816 NW Floyd | 0.38mi | 3/2.0 | 960 (-12%) | 8mo | $75,800 | $79 | 51 |
| 1708 NW Floyd | 0.51mi | 3/2.0 | 1,200 (+10%) | 6mo | $45,000 | $38 | 51 |
| 2414 NW 30th St | 0.59mi | 3/2.0 | 1,200 (+10%) | 2mo | $45,000 | $38 | 51 |
| 3512 NW Rogers Ln | 0.75mi | 2/1.0 (-1) | 1,200 (+10%) | 2mo | $94,700 | $79 | 42 |
Match score weights: distance 35% · size 25% · config 20% · recency 20%. Top-matched comps best support the ARV.
Projected returns pro-forma
-3.0% appreciation · 5.14% rent growth · sell at horizon
- IRR
- -2.8%
- Equity multiple
- 0.89×
- Total profit
- $-3,604
- Equity at exit
- $17,594
- IRR
- 9.0%
- Equity multiple
- 1.76×
- Total profit
- $25,031
- Equity at exit
- $10,202
Cash invested: $33,040 (down + closing). Projections, not guarantees.
Landlord ↔ Tenant lean methodology
- Overall (STATE)
- 83 Strongly Landlord-Friendly
- State Oklahoma
- 83 Strongly Landlord-Friendly · R+20
- County
- — inherits STATE
- City
- — inherits STATE
ZIP-level market 73505
- Rents YoY
- 5.1%
- Active inventory
- 403
- Price-to-rent
- 7.9×
Monthly cashflow live
- Estimated rent
- $1,242 medium interval (Pro) →
- Mortgage (P&I)
- −$619
- Tax from tax record
- −$113 /mo · $1,353/yr
- Insurance
- −$49
- HOA
- −$0
- Vacancy / Maint / Mgmt
- −$261
- Net cashflow
- $201
Break-even live
Sensitivity live
| Price | -10% $268 | -5% $234 | +0% $201 | +5% $167 | +10% $134 |
|---|---|---|---|---|---|
| Rent | -10% $103 | -5% $152 | +0% $201 | +5% $250 | +10% $299 |
| Rate | -1.0pp $260 | -0.5pp $231 | base $201 | +0.5pp $170 | +1.0pp $139 |
UW: 25.0% down · 7.5% · 30yr · 1.5% tax · 5.0% vac · 8.0% maint · 8.0% mgmt
Financing live
Cash to close
- Down payment
- $29,500
- Closing costs
- $3,540
- Reserves months
- —
- Total cash needed
- —
Loan-product check · same deal, 3 products live
Conventional
25% down · 7.5% · 30yr
- Down + closing
- —
- Monthly P&I
- —
- Monthly cashflow
- —
- DSCR
- —
- Eligible?
- —
Personal DTI + credit; lowest rate.
DSCR
20% down · 8.5% · 30yr
- Down + closing
- —
- Monthly P&I
- —
- Monthly cashflow
- —
- DSCR
- —
- Eligible?
- —
No personal income docs; deal must DSCR.
Hard money
10% down · 12.0% · 12mo
- Down + closing
- —
- Monthly P&I
- —
- Monthly cashflow
- —
- DSCR
- —
- Eligible?
- —
Short-term bridge; refi at stabilization.
Listing history 37 events
-
2026-06-21days on market $118,000 Active 124 DOM
-
2026-06-19days on market $118,000 Active 122 DOM
-
2026-06-18days on market $118,000 Active 121 DOM
-
2026-06-17days on market $118,000 Active 120 DOM
-
2026-06-16days on market $118,000 Active 119 DOM
-
2026-06-15days on market $118,000 Active 118 DOM
-
2026-06-14days on market $118,000 Active 116 DOM
-
2026-06-13days on market $118,000 Active 115 DOM
-
2026-06-10days on market $118,000 Active 113 DOM
-
2026-06-09days on market $118,000 Active 112 DOM
-
2026-06-08days on market $118,000 Active 111 DOM
-
2026-06-07days on market $118,000 Active 110 DOM
-
2026-06-05days on market $118,000 Active 107 DOM
-
2026-06-03days on market $118,000 Active 106 DOM
-
2026-06-02days on market $118,000 Active 105 DOM
-
2026-06-01days on market $118,000 Active 104 DOM
-
2026-05-31days on market $118,000 Active 103 DOM
-
2026-05-30days on market $118,000 Active 102 DOM
-
2026-02-17$118,000 Active
-
2025-10-27price $118,000
-
2025-08-20status Active
-
2025-08-20price $120,000
-
2025-08-04historical Active Under Contract
-
2025-07-30$110,000 Active
-
2025-02-28historical
-
2025-02-06price $120,000
-
2025-01-19price $125,000
-
2025-01-12historical $1,150
-
2025-01-07$130,000 Active
-
2024-12-31price $1,150
-
2024-12-22$1,450
-
2024-10-21price $130,000
-
2024-10-18$120,000 Active
-
2023-10-12soldstatus $105,000 Closed
-
2023-10-12soldstatus $105,000
-
2023-10-04status Active Under Contract
-
2023-08-01$110,000 Active
ⓘ Source: listings_history table (triggers on properties + properties_extension) + one-shot
backfill from property_details.listing_events for pre-trigger history.
Tax reassessment forecast OK · Resets to sale price
- Current annual tax
- $1,353 · $113/mo
- Projected year-2 tax
- $1,353 · $113/mo
- Expected delta
- $0/yr ($0/mo · 0.0%)
ⓘ Screening estimate from a state-policy table — verify with the county assessor before closing.
Climate risk First Street
- Flood 1/10 Low FEMA zone X (unshaded) · 0% chance over 30 yrs
- Wildfire 6/10 Major
- Heat 6/10 Major 7 d/yr ≥108°F today · 19 d/yr by 30 yrs out
- Wind 2/10 Low 4% chance of damaging wind over 30 yrs
- Air quality 1/10 Low 0 unhealthy d/yr today · 0 by 30 yrs out
Nearby sold comps map
Loading sold comps map…
Walkable amenities ~0.75 mi
Loading nearby amenities…
Taxation est. · year 1
- Rental income
- $14,909
- − Mortgage interest
- −$6,610
- − Property taxes
- −$1,353
- − Insurance
- −$590
- − Repairs & maintenance
- −$1,193
- − Management
- −$1,193
- − Depreciation
- −$3,433
- Taxable income
- $538
- Est. tax owed @ 24.0%
- −$129
- After-tax cash flow
- $2,280/yr
For passive investors: Depreciation is non-cash, so a rental often shows a tax loss while cash-flowing — sheltering income. Rental losses are passive: they offset passive income freely, and up to $25,000/yr can offset ordinary (W-2) income if you actively participate and your MAGI is under $100k (phasing out to $0 by $150k); unused losses carry forward. On sale, claimed depreciation is recaptured at up to 25%, and gains may owe capital-gains tax (a 1031 exchange can defer both). Figures are a year-1 estimate at your 24.0% rate — not tax advice; consult a CPA.
Schools (NCES district)
- District
- Lawton
- NCES district ID
- 4017250
- Math proficiency
- 20% ▼ -12.00%
- Reading proficiency
- 26% ▼ -9.00%
- Median HH income
- $42,618
- Composite
- 19.68/100
- National rank
- #8732
- State rank
- #137 of 270 in OK
Livability — Lawton
- Score
- 63/100
- State rank
- #206
- US rank
- #15131
Category grades
Schools grade is shown separately in the Schools card above.
Census & demographics
- Census place
- Lawton, OK
- County
- Comanche County · 96,361 people
- City population
- 89,233
- Metro
- Lawton, OK
- Population (ZIP)
- 47,790
- Household income
- $58,272
- Rent vs Own
- Severe rent burden
- 1986.0
Population outlook (Comanche County) Hauer SSP2
- Today (2025)
- 124,518 people
- By 2030
- 124,231 · -0.2%
- By 2040
- 122,193 · -1.9%
- By 2050
- 120,368 · -3.3%
- By 2075
- 120,492 · -3.2%
- By 2100
- 123,113 · -1.1%
Race, ethnicity, and origin ACS 2023
- Neighborhood character
- Diverse neighborhood (Simpson 0.70)
- Race & ethnicity
- White 50% Black 17% Two or more races 16% Hispanic / Latino 16% Native American 4% Asian 3%
- Hispanic origin (detail)
- Mexican 11% Puerto Rican 2%
- Common ancestry
- Lithuanian 2% Slovak 2% Romanian 1%
- Foreign-born
- 6% · Canada, South Korea
- Languages at home
- 88% English-only · Spanish 6% German/W. Germanic 2% Korean 1%
Political lean MEDSL · Comanche
- 2024 margin
- Strong R (+23.3) · D 37.4% · R 60.7% · Other 1.9%
- 2008→2024 swing
- -5.8pp toward R · 2008: -17.5pp · 2024: -23.3pp
- All cycles
- 2024: R+23.3 2020: R+20.1 2016: R+23.7 2012: R+17.0 2008: R+17.5
Not yet ingested
- Civics
- —
Market trends
- HPI YoY
- ▼ -134.88%
- Current HPI
- 169.4524
- Rent YoY
- ▲ 5.14%
- Metro
- Lawton, OK
- State GDP YoY
- ▲ 1.55%
- F500 in state
- 6
Industry mix (Fortune 500 HQ in OK)
| Industry | F500 HQs | Revenue |
|---|---|---|
| Energy | 3 | $48B |
|
||
Price history
+7.3% since first listed19 events — show timeline
- 2026-02-17 Listed $118,000 LBRMLS
- 2025-10-27 Price Changed $118,000 LBRMLS
- 2025-08-20 Relisted — LBRMLS
- 2025-08-20 Price Changed $120,000 LBRMLS
- 2025-08-04 Contingent — LBRMLS
- 2025-07-30 Listed $110,000 LBRMLS
- 2025-02-28 Listing Removed — MLSOK
- 2025-02-06 Price Changed $120,000 MLSOK
- 2025-01-19 Price Changed $125,000 MLSOK
- 2025-01-12 Rental Removed $1,150 SHOWMOJO
- 2025-01-07 Listed $130,000 MLSOK
- 2024-12-31 Price Changed $1,150 SHOWMOJO
- 2024-12-22 Listed for Rent $1,450 SHOWMOJO
- 2024-10-21 Price Changed $130,000 LBRMLS
- 2024-10-18 Listed $120,000 LBRMLS
- 2023-10-12 Sold (Public Records) $105,000 Public Records
- 2023-10-12 Sold (MLS) $105,000 LBRMLS
- 2023-10-04 Relisted — LBRMLS
- 2023-08-01 Listed $110,000 LBRMLS
Property tax history
+9.4%/yrLatest (2025): $1,353 · +4.4% YoY. Source: county tax records.
Cash-flow waterfall
monthlySold comps — $/sqft
last 12 mo · ≤1 miLoading sold comps…