7417 Hanover St · Detroit, MI
Flood risk 1/10 · Minimal
- FEMA flood zone
- X (unshaded)
- Chance of flooding over 30 yrs
- 0.0%
- Est. flood insurance / yr
- $473 – $860
Fire risk 1/10 · Minimal
- Est. fire insurance / yr
- $784 – $1,456
Heat risk 3/10 · Minor
- Hot days now (above 96°F)
- 7 days/yr
- Hot days in 30 yrs
- 15 days/yr
Wind risk 2/10 · Minimal
- Chance of severe wind over 30 yrs
- —
Air-quality risk 4/10 · Minor
- Unhealthy air days now
- 4 days/yr
- Unhealthy air days in 30 yrs
- 6 days/yr
Risk factors via First Street. Map © Google.
Why this score? — see what drove the C grade
The composite is a weighted blend of 9 inputs, each scored 0–100. Each bar is that input's sub-score; the figure is the points it added to the 100-point composite (weight × sub-score).
- Cash flow +20.0/30.0
- ARV discount +15.0/15.0
- DSCR +6.3/10.0
- 1% rule +4.5/10.0
- Rent growth +3.8/5.0
- Livability +3.7/5.0
- Condition / age +2.5/5.0
- Schools +1.3/10.0
- Appreciation +0.0/10.0
$157,900
🖨 Deal sheet 📄 Offer letter ✓ Due diligence
Listing remarks MLS
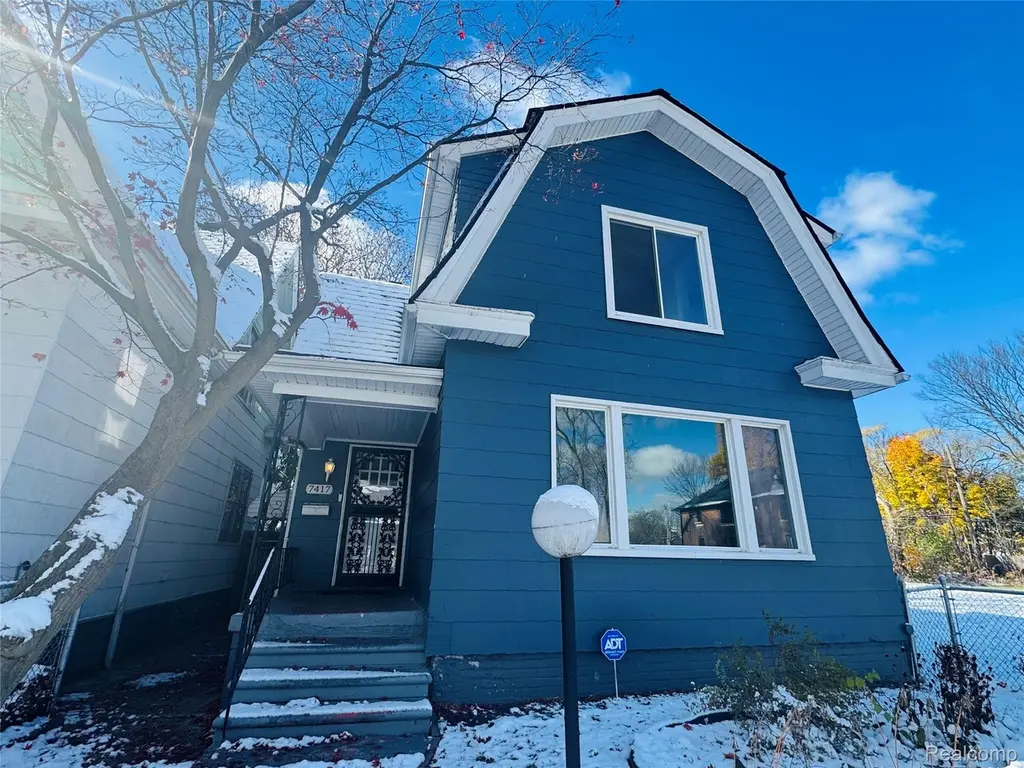
Fully renovated single-family residence in Virginia Park that stands ready to welcome you home. This inviting home offers a blend of classic charm and modern convenience. Envision mornings spent on the balcony, breathing in the fresh air and enjoying a peaceful moment before the day begins. The gambrel roof adds a distinctive architectural touch, providing character and curb appeal to this delightful home. The fenced backyard offers a private outdoor sanctuary, a perfect space for relaxation and recreation. Conveniently located near Henry Ford Hospital right off Grand Blvd, major expressways, downtown and Midtown. Furnace and hot water heater to be installed at closing. Please dress accordingly as it is chilly inside. Don't hesitate! Schedule your private showing today with easy go and show.
Key facts
- Fully renovated
- Gambrel roof
- Fenced backyard
Tags
Neighborhood map
What this means for you Summary
Snapshot
- This is a 3-bed/1.0-bath single-family listed at $158k.
Deal economics
- At list price, monthly cash flow is $194 ($2k/yr) — positive.
- The deal already cash-flows at list — no discount required.
- To meet the 1% rule (rent ≥ 1% of price), the offer needs to be $150k (5.0% below list).
- Recommended offer: $148k (6.0% below list) — sets the bar for market timing.
- Cap rate 7.8% vs local median 10.2% in Detroit — below-typical yield; the buyer is paying a premium for something (appreciation thesis, condition, location) that the cap rate doesn't capture.
Location & tenants
- Location reads 73/100 on livability (#218 in MI) — a middle-class / working-renter tenant base. Strengths: amenities A+, commute A+, cost of living A+; Watch: schools F, crime F, employment F.
- Detroit Public Schools Community District (urban): math 10% / reading 24% proficiency, ranked #499 of 540 in MI (top 92%) — low school quality limits family demand, transient renter base, plan for 1-2y turnover; 90% free/reduced lunch — lower-income household profile, screen leases tightly.
- Market conditions: Rents rising fast (+5.2%/yr); 271 active listings in the ZIP; 40 comparable units currently listed for rent nearby; rentals at typical pace (median 24d on market — plan ~3-4 weeks tenant-placement turnaround); 40% of comp listings sitting > 30 days — soft ceiling on asking rent; 2,639 units permitted in Wayne County in 2024 (1,216 in 5+ unit buildings).
- This rent runs 40% of the median local income ($45k/yr) — at the standard rent-burdened threshold; future hikes will face affordability resistance.
Forward outlook
- Local home prices are declining (-3.0%/yr); year-one equity from $1k of loan paydown is wiped out by about $5k of value loss. Plan a longer hold.
- Wayne County population projected at -17% by 2050 — secular population decline; favor cash flow + early exit over multi-decade hold.
Negotiation context
- It's been on market 77 days — a 6% lower offer ($148k) is reasonable based on typical stale-listing flexibility.
- 17 sale attempts since 5y ago with the ask held roughly flat each time — persistent listings suggest the price (not the market) is what's stuck; bring a comps-based counter.
- Current owner paid $43k; list at $158k implies a 267% gain — meaningful room to come down on a strong offer.
Risks & watch-outs
- Watch-outs: built in 1915 — expect roof / HVAC / electrical / plumbing capex.
Questions for the listing agent
- It's been on market 77 days. Have you received any prior offers? Is the seller open to a 6% concession, seller financing, or rate buy-down credit?
- Built in 1915 — when were the roof, HVAC, electrical panel, plumbing, and water heater last replaced?
- Why hasn't it sold? Are there any deal-killer items the seller is aware of (foundation, flood, title, zoning, code violations)?
- Is there a deadline driving the sale (1031 exchange, divorce, estate, relocation)? That informs how much negotiation room exists.
- Schools are F-rated, which usually means shorter tenancies and higher turnover. Who's the typical renter profile here, and what's been the actual vacancy rate?
- Crime grade is F in this area — have there been break-ins, vandalism, or insurance claims at this property in the last 3 years? What carrier currently insures it and at what premium?
- What's the average days-on-market for RENTAL listings here right now (not sales)? A rising rental-DOM trend means longer vacancies and softer asking-rent achievability than the comps imply.
- What's the recent tenant-quality profile in this submarket — average credit score on applications, eviction rate, late-payment / NSF rate, and stable-employment percentage? A property-management company in the area should have these aggregated.
- How much new for-sale + rental construction is in the pipeline within 1–3 miles? Heavy new supply typically softens prices + rents 12–24 months out; constrained supply supports both.
Investment metrics
- 1% rule
- 0.95% ✗
- Cap rate
- 7.77%
- Cash-on-cash
- 5.26%
- DSCR
- 1.23
- GRM
- 8.8
CMA / ARV
- ARV (median comp)
- $213,446
- List price
- $157,900
- Delta
- -26.02%
- Verdict
- UNDERPRICED
- Comps
- 20 within 1.0 mi
Show comp detail 12 sales within ~0.75 mi
| Address | Dist | Beds/Ba | Sqft | Sold | Price | $/sf | Match |
|---|---|---|---|---|---|---|---|
| 6154 16th St | 0.32mi | 3/2.5 | 1,464 (+1%) | 4mo | $365,000 | $249 | 74 |
| 7423 Kipling St | 0.36mi | 3/2.0 | 1,482 (+2%) | 3mo | $278,000 | $188 | 74 |
| 6247 Hecla St | 0.32mi | 3/1.5 | 1,512 (+4%) | 9mo | $269,000 | $178 | 68 |
| 5947 Vermont St | 0.51mi | 3/1.0 | 1,342 (-8%) | 2mo | $55,000 | $41 | 62 |
| 5962 Stanton St | 0.51mi | 3/1.5 | 1,344 (-8%) | 1mo | $55,000 | $41 | 60 |
| 3239 Lothrop St | 0.69mi | 3/1.5 | 1,483 (+2%) | 9mo | $60,000 | $40 | 54 |
| 3011 Virginia Park St | 0.70mi | 3/1.5 | 1,360 (-6%) | 2mo | $35,000 | $26 | 54 |
| 3232 Montgomery Ave | 0.74mi | 3/2.5 | 1,494 (+3%) | 2mo | $166,000 | $111 | 54 |
| 2921 W Euclid St | 0.66mi | 3/2.0 | 1,339 (-8%) | 2mo | $20,000 | $15 | 50 |
| 2688 W Philadelphia St W | 0.64mi | 4/1.5 (+1) | 1,564 (+8%) | 3mo | $52,000 | $33 | 48 |
| 2988 Montgomery St | 0.65mi | 3/1.5 | 1,619 (+11%) | 9mo | $50,000 | $31 | 42 |
| 3283 Northwestern St | 0.74mi | 3/1.0 | 1,259 (-13%) | 7mo | $55,000 | $44 | 37 |
Match score weights: distance 35% · size 25% · config 20% · recency 20%. Top-matched comps best support the ARV.
Projected returns pro-forma
-3.0% appreciation · 5.2% rent growth · sell at horizon
- IRR
- -5.9%
- Equity multiple
- 0.78×
- Total profit
- $-9,883
- Equity at exit
- $23,543
- IRR
- 6.0%
- Equity multiple
- 1.49×
- Total profit
- $21,708
- Equity at exit
- $13,652
Cash invested: $44,212 (down + closing). Projections, not guarantees.
Landlord ↔ Tenant lean methodology
- Overall (STATE)
- 62 Landlord-Friendly
- State Michigan
- 62 Landlord-Friendly · EVEN
- County
- — inherits STATE
- City
- — inherits STATE
ZIP-level market 48206
- Rents YoY
- 5.2%
- Active inventory
- 271
- Price-to-rent
- 8.8×
Monthly cashflow live
- Estimated rent
- $1,501 high interval (Pro) →
- Mortgage (P&I)
- −$828
- Tax from tax record
- −$98 /mo · $1,173/yr
- Insurance
- −$66
- HOA
- −$0
- Vacancy / Maint / Mgmt
- −$315
- Net cashflow
- $194
Break-even live
UW: 25.0% down · 7.5% · 30yr · 1.5% tax · 5.0% vac · 8.0% maint · 8.0% mgmt
Financing live
Cash to close
- Down payment
- $39,475
- Closing costs
- $4,737
- Reserves months
- —
- Total cash needed
- —
Loan-product check · same deal, 3 products live
Conventional
25% down · 7.5% · 30yr
- Down + closing
- —
- Monthly P&I
- —
- Monthly cashflow
- —
- DSCR
- —
- Eligible?
- —
Personal DTI + credit; lowest rate.
DSCR
20% down · 8.5% · 30yr
- Down + closing
- —
- Monthly P&I
- —
- Monthly cashflow
- —
- DSCR
- —
- Eligible?
- —
No personal income docs; deal must DSCR.
Hard money
10% down · 12.0% · 12mo
- Down + closing
- —
- Monthly P&I
- —
- Monthly cashflow
- —
- DSCR
- —
- Eligible?
- —
Short-term bridge; refi at stabilization.
Rent comps 40 comps
| Address | Beds | Baths | Sqft | Rent | $/sqft | DOM | Units | Dist |
|---|---|---|---|---|---|---|---|---|
| 1800 W Bethune St Unit 1228665P Detroit, MI | 2.0 | 1.0 | 904 | $3,135 | $3.47 | 43d | 1 | 0.24mi |
| 7340 Churchill St Unit 2 Detroit, MI | 2.0 | 1.0 | 1046 | $1,100 | $1.05 | 24d | 1 | 0.27mi |
| 2047 Seward St Detroit, MI | 3.0 | 1.0 | 1421 | $1,523 | $1.07 | 4d | 1 | 0.29mi |
| 6144 16th St Detroit, MI | 3.0 | 1.0 | 1284 | $1,200 | $0.93 | 43d | 1 | 0.33mi |
| 7640 Woodrow Wilson St Unit 1 Detroit, MI | 3.0 | 1.5 | 1095 | $1,400 | $1.28 | 43d | 1 | 0.34mi |
| 6183 Hecla St Detroit, MI | 3.0 | 1.0 | 1100 | $1,700 | $1.55 | 24d | 1 | 0.36mi |
| 1974 Virginia Park St Detroit, MI | 2.0 | 2.0 | 1200 | $1,995 | $1.66 | 43d | 1 | 0.39mi |
| 1710 Virginia Park St Detroit, MI | 2.0 | 2.0 | 1350 | $1,300 | $0.96 | 4d | 1 | 0.44mi |
| 6077 Linwood St Detroit, MI | 2.0 | 1.0 | 1200 | $2,000 | $1.67 | 43d | 1 | 0.50mi |
| 2504 W Euclid St Unit 2504 Detroit, MI | 3.0 | 1.0 | 1475 | $1,650 | $1.12 | 43d | 1 | 0.52mi |
| 2504 W Euclid St Unit 2506 Detroit, MI | 3.0 | 1.0 | 1475 | $1,675 | $1.14 | 43d | 1 | 0.52mi |
| 2506 W Euclid St Detroit, MI | 3.0 | 1.0 | 1475 | $1,675 | $1.14 | 43d | 1 | 0.52mi |
| 1400 Seward Ave Unit 305 Detroit, MI | 2.0 | 1.0 | 950 | $1,295 | $1.36 | 4d | 1 | 0.52mi |
| 1400 Seward Ave Detroit, MI | 2.0 | 1.0 | 950 | $1,295 | $1.36 | 4d | 1 | 0.52mi |
| 1400 Seward Ave Unit 305 Detroit, MI | 2.0 | 1.0 | 950 | $1,295 | $1.36 | 2d | 1 | 0.52mi |
| 1542 W Euclid St Detroit, MI | 2.0 | 1.0 | 1100 | $1,150 | $1.05 | 4d | 1 | 0.57mi |
| 1534 W Euclid St Detroit, MI | 2.0 | 1.0 | 1200 | $1,150 | $0.96 | 12d | 1 | 0.58mi |
| 1534 W Euclid St Unit 1534 Euclid Detroit, MI | 2.0 | 1.0 | 1200 | $1,150 | $0.96 | 43d | 1 | 0.58mi |
| 3012 Lothrop Detroit, MI | 2.0 | 1.0 | 1800 | $1,300 | $0.72 | 2d | 1 | 0.62mi |
| 2531 Pingree St Unit 2 (FL 2) Detroit, MI | 3.0 | 1.0 | 893 | $1,100 | $1.23 | 2d | 1 | 0.62mi |
| 8263 Merrill St Detroit, MI | 2.0 | 1.5 | 1092 | $1,600 | $1.47 | 43d | 1 | 0.63mi |
| 1226 Virginia Park St Unit 1226 Virginia Park, Upper V 1/10/26 (T) Detroit, MI | 3.0 | 1.0 | 1100 | $1,200 | $1.09 | 43d | 1 | 0.67mi |
| 2302 Hazelwood St Unit 1 Detroit, MI | 3.0 | 1.0 | 1550 | $1,273 | $0.82 | 24d | 1 | 0.77mi |
| 2911 W Grand Blvd Detroit, MI | 2.0 | 1.0–2.0 | 859 | $2,540 | $2.96 | 1d | 7 | 0.81mi |
| 2254 Taylor St Unit Taylor St unit Detroit, MI | 3.0 | 1.0 | 1307 | $1,550 | $1.19 | 3d | 1 | 0.83mi |
| 2463 Taylor St Detroit, MI | 3.0 | 1.0 | 1350 | $1,100 | $0.81 | 43d | 1 | 0.83mi |
| 3259 W Philadelphia St Detroit, MI | 3.0 | 1.0 | 1293 | $1,400 | $1.08 | 16d | 1 | 0.86mi |
| 700 Seward Ave Detroit, MI | 2.0 | 1.0 | 988 | $1,845 | $1.87 | 1d | 2 | 0.95mi |
| 3220 Gladstone St Detroit, MI | 3.0 | 1.0 | 1248 | $1,200 | $0.96 | 43d | 1 | 0.99mi |
| 4016 Hogarth St Unit 4018 Hogarth Lower Detroit, MI | 2.0 | 1.0 | 1200 | $1,100 | $0.92 | 3d | 1 | 1.00mi |
| 7430 2nd Ave Unit 1012 Detroit, MI | 2.0 | 2.0 | 1100 | $3,500 | $3.18 | 43d | 1 | 1.05mi |
| 7430 2nd Ave Unit 0312 Detroit, MI | 2.0 | 2.0 | 877 | $2,150 | $2.45 | 43d | 1 | 1.05mi |
| 6200 2nd Ave Detroit, MI | 1.0–2.0 | 1.0 | 914 | $1,860 | $2.03 | 2d | 2 | 1.06mi |
| 3757 Blaine St Detroit, MI | 3.0 | 1.0 | 1169 | $1,480 | $1.27 | 16d | 1 | 1.07mi |
| 450 Amsterdam St Detroit, MI | 2.0 | 1.0–2.0 | 630 | $2,720 | $4.32 | 1d | 21 | 1.09mi |
| 715 Gladstone Ave Detroit, MI | 2.0 | 1.0 | 1200 | $1,750 | $1.46 | 20d | 1 | 1.10mi |
| 719 Gladstone Ave Detroit, MI | 2.0 | 1.0 | 1200 | $1,750 | $1.46 | 20d | 1 | 1.10mi |
| 100 Seward Ave Detroit, MI | 2.0 | 1.0–2.0 | 905 | $1,575 | $1.74 | 21d | 1 | 1.12mi |
| 3786 Carter St Unit 2 Detroit, MI | 3.0 | 1.0 | 1400 | $1,100 | $0.79 | 24d | 1 | 1.14mi |
| 30 W Bethune St Detroit, MI | 2.0 | 1.5 | 1254 | $2,100 | $1.67 | 43d | 1 | 1.15mi |
Listing history 50 events
-
2026-06-13statusdays on market $157,900 Pending 77 DOM
-
2026-06-09days on market $157,900 Active 75 DOM
-
2026-06-08days on market $157,900 Active 74 DOM
-
2026-06-07days on market $157,900 Active 73 DOM
-
2026-06-04days on market $157,900 Active 70 DOM
-
2026-06-03days on market $157,900 Active 69 DOM
-
2026-06-02days on market $157,900 Active 68 DOM
-
2026-06-01days on market $157,900 Active 67 DOM
-
2026-05-31days on market $157,900 Active 66 DOM
-
2026-03-26$157,900 Active 802-char remark
Show marketing remark (802 chars)
Fully renovated single-family residence in Virginia Park that stands ready to welcome you home. This inviting home offers a blend of classic charm and modern convenience. Envision mornings spent on the balcony, breathing in the fresh air and enjoying a peaceful moment before the day begins. The gambrel roof adds a distinctive architectural touch, providing character and curb appeal to this delightful home. The fenced backyard offers a private outdoor sanctuary, a perfect space for relaxation and recreation. Conveniently located near Henry Ford Hospital right off Grand Blvd, major expressways, downtown and Midtown. Furnace and hot water heater to be installed at closing. Please dress accordingly as it is chilly inside. Don't hesitate! Schedule your private showing today with easy go and show.
-
2026-03-02historical
-
2026-03-02historical
-
2026-02-10historical
-
2026-02-10historical
-
2025-12-01$159,900 Active
-
2025-12-01$159,900 Active
-
2025-12-01$159,900 Active
-
2025-12-01$159,900 Active
-
2025-07-01historical
-
2025-07-01historical
-
2025-04-23status Active
-
2025-04-09historical
-
2025-03-13price $140,000
-
2025-03-13price $140,000
-
2025-02-12price $148,000
-
2025-02-11price $148,000
-
2025-01-07price $149,000
-
2025-01-06price $149,000
-
2024-12-11$149,999 Active
-
2024-12-11$149,999 Active
-
2024-12-09historical
-
2024-12-09historical
-
2024-08-15historical
-
2024-08-15historical
-
2024-08-01$148,999 Active
-
2024-08-01historical
-
2024-08-01historical
-
2024-04-10price $149,998
-
2024-04-10price $149,998
-
2024-02-16$149,999 Active
-
2024-02-15$148,999 Active
-
2024-02-15$149,999 Active
-
2021-04-09soldstatus $43,000 Sold
-
2021-04-09soldstatus $43,000 Closed
-
2021-04-01status Pending
-
2021-04-01status Pending
-
2021-03-28historical Accepting Backup Offers
-
2021-03-28historical Accepting Backup Offers
-
2021-03-15status Active
ⓘ Source: listings_history table (triggers on properties + properties_extension) + one-shot
backfill from property_details.listing_events for pre-trigger history.
Tax reassessment forecast MI · Partial reset (capped growth)
- Current annual tax
- $1,173 · $98/mo
- Projected year-2 tax
- $1,802 · $150/mo
- Expected delta
- +$629/yr (+$52/mo · 53.7%)
ⓘ Screening estimate from a state-policy table — verify with the county assessor before closing.
Climate risk First Street
- Flood 1/10 Low FEMA zone X (unshaded) · 0% chance over 30 yrs
- Wildfire 1/10 Low
- Heat 3/10 Moderate 7 d/yr ≥96°F today · 15 d/yr by 30 yrs out
- Wind 2/10 Low
- Air quality 4/10 Moderate 4 unhealthy d/yr today · 6 by 30 yrs out
Nearby sold comps map
Loading sold comps map…
Walkable amenities ~0.75 mi
Loading nearby amenities…
Taxation est. · year 1
- Rental income
- $18,007
- − Mortgage interest
- −$8,845
- − Property taxes
- −$1,173
- − Insurance
- −$790
- − Repairs & maintenance
- −$1,441
- − Management
- −$1,441
- − Depreciation
- −$4,593
- Taxable loss
- −$275
- Est. tax savings @ 24.0%
- +$66
- After-tax cash flow
- $2,392/yr
For passive investors: Depreciation is non-cash, so a rental often shows a tax loss while cash-flowing — sheltering income. Rental losses are passive: they offset passive income freely, and up to $25,000/yr can offset ordinary (W-2) income if you actively participate and your MAGI is under $100k (phasing out to $0 by $150k); unused losses carry forward. On sale, claimed depreciation is recaptured at up to 25%, and gains may owe capital-gains tax (a 1031 exchange can defer both). Figures are a year-1 estimate at your 24.0% rate — not tax advice; consult a CPA.
Schools (NCES district)
- District
- Detroit Public Schools Community District
- NCES district ID
- 2601103
- Math proficiency
- 10% ▼ -2.00%
- Reading proficiency
- 24% ▲ 6.00%
- Median HH income
- $25,815
- Composite
- 13.06/100
- National rank
- #9564
- State rank
- #499 of 540 in MI
Livability — Detroit
- Score
- 73/100
- State rank
- #218
- US rank
- #5427
Category grades
Schools grade is shown separately in the Schools card above.
Census & demographics
- Census place
- Detroit, MI
- County
- Wayne County · 1,562,939 people
- City population
- 572,865
- Metro
- Detroit-Warren-Dearborn, MI
- Population (ZIP)
- 15,227
- Household income
- $45,046
- Rent vs Own
- Severe rent burden
- 646.0
Population outlook (Wayne County) Hauer SSP2
- Today (2025)
- 1,675,273 people
- By 2030
- 1,620,300 · -3.3%
- By 2040
- 1,502,341 · -10.3%
- By 2050
- 1,384,039 · -17.4%
- By 2075
- 1,124,592 · -32.9%
- By 2100
- 881,193 · -47.4%
Race, ethnicity, and origin ACS 2023
- Neighborhood character
- Predominantly Black (81%)
- Race & ethnicity
- Black 81% White 12% Two or more races 5% Hispanic / Latino 3%
- Common ancestry
- Iranian 3% Romanian 1% Slovak 1%
- Foreign-born
- 4% · Canada
- Languages at home
- 94% English-only · Spanish 4% Other Indo-European 1%
Political lean MEDSL · Wayne
- 2024 margin
- Strong D (+29.0) · D 62.7% · R 33.7% · Other 3.6%
- 2008→2024 swing
- -20.5pp toward R · 2008: 49.5pp · 2024: 29.0pp
- All cycles
- 2024: D+29.0 2020: D+38.1 2016: D+37.3 2012: D+46.9 2008: D+49.5
Not yet ingested
- Civics
- —
Market trends
- HPI YoY
- ▼ -139.60%
- Current HPI
- 130.9545
- Rent YoY
- ▲ 5.20%
- Metro
- Detroit-Warren-Dearborn, MI
- State GDP YoY
- ▲ 1.37%
- F500 in state
- 28
Industry mix (Fortune 500 HQ in MI)
| Industry | F500 HQs | Revenue |
|---|---|---|
| Automotive Parts | 3 | $48B |
|
||
| Automotive | 2 | $372B |
|
||
| Chemicals | 1 | $45B |
|
||
| Automotive Retail | 1 | $29B |
|
||
| Healthcare / Medical Devices | 1 | $23B |
|
||
| Automotive Technology | 1 | $20B |
|
||
Price history
+216.4% since first listed46 events — show timeline
- 2026-03-26 Listed $157,900 REALCOMP
- 2026-03-26 Listed $157,900 MiRealSource-MiMLS
- 2026-03-02 Listing Removed — REALCOMP
- 2026-03-02 Listing Removed — MiRealSource-MiMLS
- 2026-02-10 Listing Removed — MiRealSource-MiMLS
- 2026-02-10 Listing Removed — REALCOMP
- 2025-12-01 Listed $159,900 REALCOMP
- 2025-12-01 Listed $159,900 MiRealSource-MiMLS
- 2025-12-01 Listed $159,900 MiRealSource-MiMLS
- 2025-12-01 Listed $159,900 REALCOMP
- 2025-07-01 Listing Removed — MiRealSource-MiMLS
- 2025-07-01 Listing Removed — REALCOMP
- 2025-04-23 Relisted — REALCOMP
- 2025-04-09 Listing Removed — REALCOMP
- 2025-03-13 Price Changed $140,000 MiRealSource-MiMLS
- 2025-03-13 Price Changed $140,000 REALCOMP
- 2025-02-12 Price Changed $148,000 MiRealSource-MiMLS
- 2025-02-11 Price Changed $148,000 REALCOMP
- 2025-01-07 Price Changed $149,000 MiRealSource-MiMLS
- 2025-01-06 Price Changed $149,000 REALCOMP
- 2024-12-11 Listed $149,999 MiRealSource-MiMLS
- 2024-12-11 Listed $149,999 REALCOMP
- 2024-12-09 Coming Soon — MiRealSource-MiMLS
- 2024-12-09 Coming Soon — REALCOMP
- 2024-08-15 Listing Removed — MiRealSource-MiMLS
- 2024-08-15 Listing Removed — REALCOMP
- 2024-08-01 Listing Removed — MiRealSource-MiMLS
- 2024-08-01 Listing Removed — REALCOMP
- 2024-08-01 Listed $148,999 REALCOMP
- 2024-04-10 Price Changed $149,998 MiRealSource-MiMLS
- 2024-04-10 Price Changed $149,998 REALCOMP
- 2024-02-16 Listed $149,999 REALCOMP
- 2024-02-15 Listed $149,999 MiRealSource-MiMLS
- 2024-02-15 Listed $148,999 MiRealSource-MiMLS
- 2021-04-09 Sold (MLS) $43,000 MiRealSource-MiMLS
- 2021-04-09 Sold (MLS) $43,000 REALCOMP
- 2021-04-01 Pending — MiRealSource-MiMLS
- 2021-04-01 Pending — REALCOMP
- 2021-03-28 Contingent — MiRealSource-MiMLS
- 2021-03-28 Contingent — REALCOMP
- 2021-03-15 Relisted — MiRealSource-MiMLS
- 2021-03-15 Relisted — REALCOMP
- 2021-03-03 Contingent — MiRealSource-MiMLS
- 2021-03-03 Contingent — REALCOMP
- 2021-02-15 Listed $49,900 MiRealSource-MiMLS
- 2021-02-15 Listed $49,900 REALCOMP
Property tax history
+7.0%/yrLatest (2025): $1,173 · -53.9% YoY. Source: county tax records.
Cash-flow waterfall
monthlySold comps — $/sqft
last 12 mo · ≤1 miLoading sold comps…