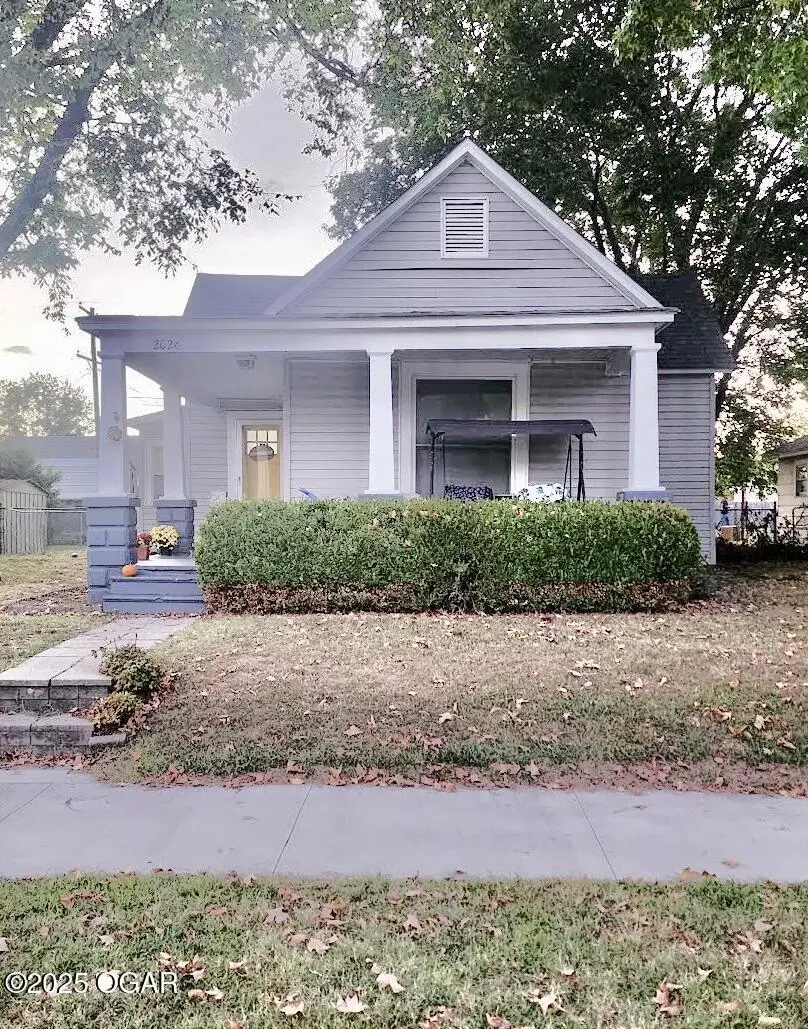
2026 Bird Ave · Joplin, MO
Flood risk 1/10 · Minimal
- FEMA flood zone
- X (unshaded)
- Chance of flooding over 30 yrs
- 0.0%
- Est. flood insurance / yr
- $507 – $1,088
Fire risk 2/10 · Minimal
- Est. fire insurance / yr
- $1,054 – $1,958
Heat risk 5/10 · Moderate
- Hot days now (above 107°F)
- 7 days/yr
- Hot days in 30 yrs
- 20 days/yr
Wind risk 2/10 · Minimal
- Chance of severe wind over 30 yrs
- 2.0%
Air-quality risk 2/10 · Minimal
- Unhealthy air days now
- 1 days/yr
- Unhealthy air days in 30 yrs
- 1 days/yr
Risk factors via First Street. Map © Google.
Why this score? — see what drove the B- grade
The composite is a weighted blend of 9 inputs, each scored 0–100. Each bar is that input's sub-score; the figure is the points it added to the 100-point composite (weight × sub-score).
- Cash flow +27.9/30.0
- DSCR +9.9/10.0
- ARV discount +7.5/15.0
- 1% rule +6.6/10.0
- Rent growth +5.0/5.0
- Livability +3.2/5.0
- Schools +2.9/10.0
- Condition / age +2.5/5.0
- Appreciation +0.0/10.0
$117,950
🖨 Deal sheet 📄 Offer letter ✓ Due diligence
Listing remarks MLS
Adorable Joplin home! Close to the Medical School. Spacious rooms and natural light throughout. New carpet and paint throughout. Oversized garage. Perfect home to raise your family!
Key facts
- Updated appliances
- Detached yard
- Fenced backyard
Tags
Property features AI
Finance
- Other: Property listed by KELLER WILLIAMS REALTY ELEVATE
Exterior
- Parking: Detached 1-car garage; Additional 1-car detached garage parking
- Utilities: Cable available; Public sewer
- Home design: Single-family residence, freestanding; Residential property
- Construction: Vinyl siding; Shingle roof
- Exterior features: Porch; Chain link fence; Level topography; Lot dimensions approximately 50 x 125
Interior
- Kitchen: Electric range; Refrigerator; Dishwasher
- Flooring: Carpet
- Bathrooms: 1 full bathroom
- Heating & cooling: Natural gas central heating; Cooling present
- Interior features: Electric range, refrigerator, dishwasher; No fireplace; Crawl space basement; 6 total rooms
Neighborhood map
What this means for you Summary
Snapshot
- This is a 3-bed/1.0-bath other listed at $118k.
Deal economics
- At list price, monthly cash flow is $363 ($4k/yr) — positive.
- The deal already cash-flows at list — no discount required.
- Meets the 1% rule at list price ($1k rent vs $118k).
- Recommended offer: $114k (3.0% below list) — sets the bar for market timing.
- Cap rate 10.0% vs local median 5.1% in Joplin — top-decile yield for the area; either an underpriced asset or a hidden risk that comps aren't pricing in. Stress-test before assuming the spread holds.
Location & tenants
- Location reads 64/100 on livability (#318 in MO) — a middle-class / working-renter tenant base. Strengths: cost of living A+, housing A+; Watch: crime F, amenities F, commute F.
- Joplin Schools (urban): math 30% / reading 39% proficiency, ranked #231 of 324 in MO (top 71%) — families likely to look elsewhere, expect single-tenant / working-renter base with shorter leases.
- Zoned schools: Irving Elementary (math 29% / reading 30%, grade F, #813 of 1,115 statewide, top 75%, 527 students, 67% FRL); South Middle (math 40% / reading 48%, grade D, #121 of 391 statewide, top 32%, 573 students, 47% FRL) — zoned schools at 57% FRL track the district average.
- Market conditions: Rents rising fast (+15.7%/yr); 353 active listings in the ZIP; 15 comparable units currently listed for rent nearby; rentals at typical pace (median 22d on market — plan ~3-4 weeks tenant-placement turnaround); 602 units permitted in Jasper County in 2024 (0 in 5+ unit buildings).
Forward outlook
- Local home prices are declining (-3.0%/yr); year-one equity from $816 of loan paydown is wiped out by about $4k of value loss. Plan a longer hold.
- At projected returns (-3.0% appreciation + 8.0% rent growth), your $33k cash investment doubles in ~7 years — after that, you're playing with house money.
Negotiation context
- It's been on market 56 days — a 3% lower offer ($114k) is reasonable based on typical stale-listing flexibility.
- 2 sale attempts since 5y ago with the ask held roughly flat each time — persistent listings suggest the price (not the market) is what's stuck; bring a comps-based counter.
Risks & watch-outs
- Watch-outs: built in 1920 — expect roof / HVAC / electrical / plumbing capex.
- Climate carrying-cost: extreme-heat days projected 7→20/yr by 2055 (HVAC capex compounding) — expect insurance premiums to compound above CPI over the hold.
Questions for the listing agent
- It's been on market 56 days. Have you received any prior offers? Is the seller open to a 3% concession, seller financing, or rate buy-down credit?
- Built in 1920 — when were the roof, HVAC, electrical panel, plumbing, and water heater last replaced?
- Is there a deadline driving the sale (1031 exchange, divorce, estate, relocation)? That informs how much negotiation room exists.
- Schools are D-rated, which usually means shorter tenancies and higher turnover. Who's the typical renter profile here, and what's been the actual vacancy rate?
- Crime grade is F in this area — have there been break-ins, vandalism, or insurance claims at this property in the last 3 years? What carrier currently insures it and at what premium?
- What's the average days-on-market for RENTAL listings here right now (not sales)? A rising rental-DOM trend means longer vacancies and softer asking-rent achievability than the comps imply.
- What's the recent tenant-quality profile in this submarket — average credit score on applications, eviction rate, late-payment / NSF rate, and stable-employment percentage? A property-management company in the area should have these aggregated.
- How much new for-sale + rental construction is in the pipeline within 1–3 miles? Heavy new supply typically softens prices + rents 12–24 months out; constrained supply supports both.
Investment metrics
- 1% rule
- 1.16% ✓
- Cap rate
- 9.98%
- Cash-on-cash
- 13.19%
- DSCR
- 1.59
- GRM
- 7.2
CMA / ARV
No comps found within radius.
Projected returns pro-forma
-3.0% appreciation · 8.0% rent growth · sell at horizon
- IRR
- 8.2%
- Equity multiple
- 1.34×
- Total profit
- $11,191
- Equity at exit
- $17,587
- IRR
- 21.1%
- Equity multiple
- 3.19×
- Total profit
- $72,259
- Equity at exit
- $10,198
Cash invested: $33,026 (down + closing). Projections, not guarantees.
Landlord ↔ Tenant lean methodology
- Overall (STATE)
- 81 Strongly Landlord-Friendly
- State Missouri
- 81 Strongly Landlord-Friendly · R+10
- County
- — inherits STATE
- City
- — inherits STATE
ZIP-level market 64804
- Rents YoY
- 15.7%
- Active inventory
- 353
- Price-to-rent
- 7.2×
Monthly cashflow live
- Estimated rent
- $1,368 high interval (Pro) →
- Mortgage (P&I)
- −$619
- Tax from tax record
- −$50 /mo · $604/yr
- Insurance
- −$49
- HOA
- −$0
- Vacancy / Maint / Mgmt
- −$287
- Net cashflow
- $363
Break-even live
UW: 25.0% down · 7.5% · 30yr · 1.5% tax · 5.0% vac · 8.0% maint · 8.0% mgmt
Financing live
Cash to close
- Down payment
- $29,488
- Closing costs
- $3,538
- Reserves months
- —
- Total cash needed
- —
Loan-product check · same deal, 3 products live
Conventional
25% down · 7.5% · 30yr
- Down + closing
- —
- Monthly P&I
- —
- Monthly cashflow
- —
- DSCR
- —
- Eligible?
- —
Personal DTI + credit; lowest rate.
DSCR
20% down · 8.5% · 30yr
- Down + closing
- —
- Monthly P&I
- —
- Monthly cashflow
- —
- DSCR
- —
- Eligible?
- —
No personal income docs; deal must DSCR.
Hard money
10% down · 12.0% · 12mo
- Down + closing
- —
- Monthly P&I
- —
- Monthly cashflow
- —
- DSCR
- —
- Eligible?
- —
Short-term bridge; refi at stabilization.
Rent comps 15 comps
| Address | Beds | Baths | Sqft | Rent | $/sqft | DOM | Units | Dist |
|---|---|---|---|---|---|---|---|---|
| 2012 S Connor Ave Joplin, MO | 3.0 | 2.0 | 1379 | $1,595 | $1.16 | 21d | 1 | 0.08mi |
| 1907 S Picher Ave Joplin, MO | 2.0 | 1.0 | 1032 | $900 | $0.87 | 21d | 1 | 0.13mi |
| 2010 S Moffet Ave Joplin, MO | 2.0 | 1.0 | 1000 | $950 | $0.95 | 21d | 1 | 0.27mi |
| 2201 S Pearl Ave Joplin, MO | 3.0 | 2.0 | 1487 | $1,475 | $0.99 | 21d | 1 | 0.45mi |
| 2602 S Moffet Ave Joplin, MO | 3.0 | 2.0 | 1214 | $1,300 | $1.07 | 21d | 1 | 0.53mi |
| 623 W Junge Blvd Joplin, MO | 3.0 | 2.0 | 1217 | $1,500 | $1.23 | 21d | 1 | 0.62mi |
| 1806 Pennsylvania Ave Joplin, MO | 3.0 | 1.0 | 1295 | $1,050 | $0.81 | 21d | 1 | 0.74mi |
| 2521 S Tyler Ave Joplin, MO | 3.0 | 2.0 | 1500 | $1,700 | $1.13 | 21d | 1 | 0.78mi |
| 2830 S Pearl Ave Joplin, MO | 2.0 | 2.0 | 1000 | $1,200 | $1.20 | 21d | 1 | 0.79mi |
| 2515 S Willard Ave Joplin, MO | 3.0 | 2.0 | 1500 | $1,600 | $1.07 | 21d | 1 | 0.91mi |
| 2019 W 26th St Joplin, MO | 2.0 | 2.0 | 1000 | $1,100 | $1.10 | 21d | 1 | 0.92mi |
| 3117 S Wall Ave Joplin, MO | 2.0 | 1.0 | 944 | $1,095 | $1.16 | 21d | 1 | 1.03mi |
| 2002 W 11th St Joplin, MO | 3.0 | 1.0 | 1200 | $1,200 | $1.00 | 21d | 1 | 1.09mi |
| 524 S Moffet Ave Joplin, MO | 3.0 | 1.0 | 900 | $855 | $0.95 | 21d | 1 | 1.22mi |
| 1715 Wisconsin Ave #2 Joplin, MO | 2.0 | 2.0 | 1000 | $900 | $0.90 | 21d | 1 | 1.30mi |
Listing history 22 events
-
2026-06-19days on market $117,950 Active 56 DOM
-
2026-06-18days on market $117,950 Active 55 DOM
-
2026-06-17days on market $117,950 Active 54 DOM
-
2026-06-16days on market $117,950 Active 53 DOM
-
2026-06-15days on market $117,950 Active 52 DOM
-
2026-06-14days on market $117,950 Active 50 DOM
-
2026-06-13days on market $117,950 Active 49 DOM
-
2026-06-10days on market $117,950 Active 47 DOM
-
2026-06-09days on market $117,950 Active 46 DOM
-
2026-06-08days on market $117,950 Active 45 DOM
-
2026-06-07pricedays on market $117,950 Active 44 DOM
-
2026-06-05days on market $119,950 Active 41 DOM
-
2026-06-03days on market $119,950 Active 40 DOM
-
2026-06-02days on market $119,950 Active 39 DOM
-
2026-06-01days on market $119,950 Active 38 DOM
-
2026-05-31days on market $119,950 Active 37 DOM
-
2026-05-30days on market $119,950 Active 36 DOM
-
2026-04-24$119,950 Active
-
2021-11-16soldstatus 181-char remark
Show marketing remark (181 chars)
Adorable Joplin home! Close to the Medical School. Spacious rooms and natural light throughout. New carpet and paint throughout. Oversized garage. Perfect home to raise your family!
-
2021-09-08$94,900 181-char remark
Show marketing remark (181 chars)
Adorable Joplin home! Close to the Medical School. Spacious rooms and natural light throughout. New carpet and paint throughout. Oversized garage. Perfect home to raise your family!
-
2006-12-05soldstatus
-
1984-04-09soldstatus
ⓘ Source: listings_history table (triggers on properties + properties_extension) + one-shot
backfill from property_details.listing_events for pre-trigger history.
Tax reassessment forecast MO · Resets to sale price
- Current annual tax
- $604 · $50/mo
- Projected year-2 tax
- $1,144 · $95/mo
- Expected delta
- +$540/yr (+$45/mo · 89.3%)
ⓘ Screening estimate from a state-policy table — verify with the county assessor before closing.
Climate risk First Street
- Flood 1/10 Low FEMA zone X (unshaded) · 0% chance over 30 yrs
- Wildfire 2/10 Low
- Heat 5/10 Major 7 d/yr ≥107°F today · 20 d/yr by 30 yrs out
- Wind 2/10 Low 2% chance of damaging wind over 30 yrs
- Air quality 2/10 Low 1 unhealthy d/yr today · 1 by 30 yrs out
Nearby sold comps map
Loading sold comps map…
Walkable amenities ~0.75 mi
Loading nearby amenities…
Taxation est. · year 1
- Rental income
- $16,419
- − Mortgage interest
- −$6,607
- − Property taxes
- −$604
- − Insurance
- −$590
- − Repairs & maintenance
- −$1,314
- − Management
- −$1,314
- − Depreciation
- −$3,431
- Taxable income
- $2,560
- Est. tax owed @ 24.0%
- −$614
- After-tax cash flow
- $3,740/yr
For passive investors: Depreciation is non-cash, so a rental often shows a tax loss while cash-flowing — sheltering income. Rental losses are passive: they offset passive income freely, and up to $25,000/yr can offset ordinary (W-2) income if you actively participate and your MAGI is under $100k (phasing out to $0 by $150k); unused losses carry forward. On sale, claimed depreciation is recaptured at up to 25%, and gains may owe capital-gains tax (a 1031 exchange can defer both). Figures are a year-1 estimate at your 24.0% rate — not tax advice; consult a CPA.
Schools (NCES district)
- District
- Joplin Schools
- NCES district ID
- 2916350
- Math proficiency
- 30% ▼ -3.00%
- Reading proficiency
- 39% ▼ -3.00%
- Median HH income
- $38,648
- Composite
- 28.82/100
- National rank
- #6657
- State rank
- #231 of 324 in MO
Livability — Joplin
- Score
- 64/100
- State rank
- #318
- US rank
- #14578
Category grades
Schools grade is shown separately in the Schools card above.
Census & demographics
- Census place
- Joplin, MO
- County
- Newton County · 37,016 people
- City population
- 73,303
- Metro
- Joplin, MO
- Population (ZIP)
- 37,016
- Household income
- $62,574
- Rent vs Own
- Severe rent burden
- 1082.0
Population outlook (Jasper County) Hauer SSP2
- Today (2025)
- 120,033 people
- By 2030
- 120,091 · +0.0%
- By 2040
- 119,297 · -0.6%
- By 2050
- 117,705 · -1.9%
- By 2075
- 110,402 · -8.0%
- By 2100
- 99,719 · -16.9%
Race, ethnicity, and origin ACS 2023
- Neighborhood character
- Predominantly White (84%)
- Race & ethnicity
- White 84% Two or more races 9% Hispanic / Latino 6% Black 2% Asian 2%
- Hispanic origin (detail)
- Mexican 3%
- Common ancestry
- Slovak 3% Italian 2% Lithuanian 2%
- Foreign-born
- 3% · Canada, Vietnam
- Languages at home
- 96% English-only · Spanish 1% Other Indo-European 1% Vietnamese 1%
Political lean MEDSL · Jasper
- 2024 margin
- Solid R (+46.8) · D 25.9% · R 72.7% · Other 1.4%
- 2008→2024 swing
- -13.6pp toward R · 2008: -33.2pp · 2024: -46.8pp
- All cycles
- 2024: R+46.8 2020: R+46.2 2016: R+50.8 2012: R+41.0 2008: R+33.2
Not yet ingested
- Civics
- —
Market trends
- HPI YoY
- ▼ -204.80%
- Current HPI
- 279.4471
- Rent YoY
- ▲ 15.66%
- Metro
- Joplin, MO
- State GDP YoY
- ▲ 1.84%
- F500 in state
- 20
Industry mix (Fortune 500 HQ in MO)
| Industry | F500 HQs | Revenue |
|---|---|---|
| Healthcare | 1 | $163B |
|
||
| Insurance | 1 | $21B |
|
||
| Industrial Technology | 1 | $17B |
|
||
| Retail | 1 | $16B |
|
||
| Industrial Distribution | 1 | $10B |
|
||
| Utilities | 1 | $9B |
|
||
Price history
+26.4% since first listed5 events — show timeline
- 2026-04-24 Listed $119,950 OGAR
- 2021-11-16 Sold (MLS) — OGAR
- 2021-09-08 Listed $94,900 OGAR
- 2006-12-05 Sold (Public Records) — Public Records
- 1984-04-09 Sold (Public Records) — Public Records
Property tax history
+3.5%/yrLatest (2025): $604 · +12.8% YoY. Source: county tax records.
Cash-flow waterfall
monthlySold comps — $/sqft
last 12 mo · ≤1 miLoading sold comps…