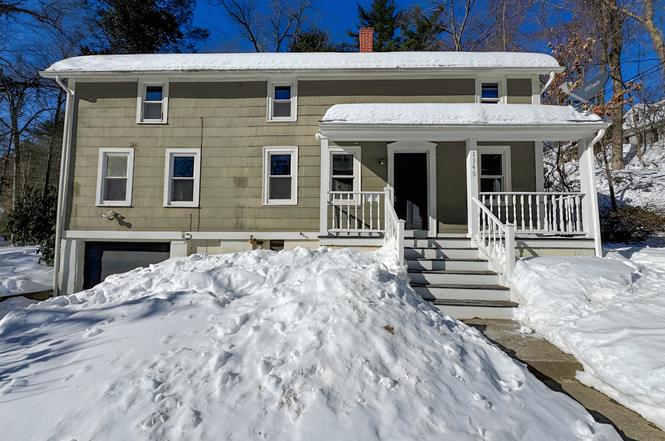
1346 Route 169 · Southbridge Town, MA
Flood risk 1/10 · Minimal
- FEMA flood zone
- X
- Chance of flooding over 30 yrs
- 0.0%
- Est. flood insurance / yr
- $473 – $860
Fire risk 2/10 · Minimal
- Est. fire insurance / yr
- $829 – $1,539
Heat risk 3/10 · Minor
- Hot days now (above 95°F)
- 7 days/yr
- Hot days in 30 yrs
- 15 days/yr
Wind risk 6/10 · Moderate
- Chance of severe wind over 30 yrs
- 38.0%
Air-quality risk 2/10 · Minimal
- Unhealthy air days now
- 2 days/yr
- Unhealthy air days in 30 yrs
- 2 days/yr
Risk factors via First Street. Map © Google.
Why this score? — see what drove the D+ grade
The composite is a weighted blend of 9 inputs, each scored 0–100. Each bar is that input's sub-score; the figure is the points it added to the 100-point composite (weight × sub-score).
- Cash flow +15.6/30.0
- ARV discount +11.3/15.0
- DSCR +4.8/10.0
- 1% rule +4.0/10.0
- Schools +4.0/10.0
- Livability +2.8/5.0
- Rent growth +2.5/5.0
- Condition / age +2.5/5.0
- Appreciation +0.0/10.0
$265,000
🖨 Deal sheet (PDF) 📄 Offer letter ✓ Due diligence
Listing remarks MLS
GREAT HOME WITH 3 BEDS, 1.5 BATHS!!! ATTACHED GARAGE ON WOODED LOT!! SPACIOUS WITH MANY UPDATES!! HUD Home. Sold “AS-IS” by elec. bid only. Prop available 11-14-17. ONLINE BIDDING PERIOD TO 23 NOV 2017 at 11:59 PM Central Time; then daily online bidding until sold. FHA Case #061-386491. FHA IN (Insurable). Eligible for FHA 203k. Financing terms: FHA, CASH, and CONVENTIONAL. LBP addendum attached.
Key facts
- Classic built-ins
- Full basement
- Rear deck
Tags
Neighborhood map
What this means for you Summary
Snapshot
- This is a 4-bed/1.5-bath single-family listed at $265k.
Deal economics
- At list price, monthly cash flow is $113 ($1k/yr) — positive.
- The deal already cash-flows at list — no discount required.
- To meet the 1% rule (rent ≥ 1% of price), the offer needs to be $237k (10.4% below list).
- Recommended offer: $237k (10.4% below list) — sets the bar for 1% rule.
- Cap rate 6.8% vs local median 3.7% in Southbridge Town — top-decile yield for the area; either an underpriced asset or a hidden risk that comps aren't pricing in. Stress-test before assuming the spread holds.
Location & tenants
- Location reads 56/100 on livability (#235 in MA) — a working-class tenant base; expect higher turnover. Strengths: housing A+; Watch: cost of living C-, employment D, amenities F.
- Woodstock School District (rural): math 32% / reading 55% proficiency, ranked #89 of 153 in CT (top 58%) — families likely to look elsewhere, expect single-tenant / working-renter base with shorter leases; only 9% free/reduced lunch — higher-income household profile.
- Zoned schools: Woodstock Elementary School (math 42% / reading 52%, grade D-, #256 of 553 statewide, top 48%, 427 students, 21% FRL); Woodstock Middle School (math 28% / reading 56%, grade D-, #103 of 175 statewide, top 59%, 346 students, 20% FRL).
- Market conditions: 149 units permitted in Northeastern Connecticut Planning Region in 2024 (0 in 5+ unit buildings).
Forward outlook
- Local home prices are declining (-3.0%/yr); year-one equity from $2k of loan paydown is wiped out by about $8k of value loss. Plan a longer hold.
Negotiation context
- Only 6 days on market — expect competitive offers; lowballing is unlikely to land.
- 10 sale attempts since 27y ago with the ask held roughly flat each time — persistent listings suggest the price (not the market) is what's stuck; bring a comps-based counter.
- Current owner paid $120k; list at $265k implies a 121% gain — meaningful room to come down on a strong offer.
Risks & watch-outs
- Watch-outs: built in 1910 — expect roof / HVAC / electrical / plumbing capex.
- Climate carrying-cost: major wind risk, 38% chance of damaging wind over 30y — expect insurance premiums to compound above CPI over the hold.
Questions for the listing agent
- Built in 1910 — when were the roof, HVAC, electrical panel, plumbing, and water heater last replaced?
- Is there a deadline driving the sale (1031 exchange, divorce, estate, relocation)? That informs how much negotiation room exists.
- Schools are F-rated, which usually means shorter tenancies and higher turnover. Who's the typical renter profile here, and what's been the actual vacancy rate?
- The area grade is low — what's the realistic commute time and amenity access for the typical tenant pool here? Any planned neighborhood developments (good or bad) we should know about?
- What's the average days-on-market for RENTAL listings here right now (not sales)? A rising rental-DOM trend means longer vacancies and softer asking-rent achievability than the comps imply.
- What's the recent tenant-quality profile in this submarket — average credit score on applications, eviction rate, late-payment / NSF rate, and stable-employment percentage? A property-management company in the area should have these aggregated.
- How much new for-sale + rental construction is in the pipeline within 1–3 miles? Heavy new supply typically softens prices + rents 12–24 months out; constrained supply supports both.
Investment metrics
- 1% rule
- 0.90% ✗
- Cap rate
- 6.81%
- Cash-on-cash
- 1.83%
- DSCR
- 1.08
- GRM
- 9.3
CMA / ARV
- ARV (on-the-fly)
- $289,440
- Comps found
- 3
Show comp detail 3 sales within ~0.75 mi
| Address | Dist | Beds/Ba | Sqft | Sold | Price | $/sf | Match |
|---|---|---|---|---|---|---|---|
| 566 Route 197 | 0.54mi | 3/1.5 (-1) | 1,440 (0%) | 10mo | $290,000 | $201 | 62 |
| 610 Route 197 | 0.55mi | 3/1.5 (-1) | 1,368 (-5%) | 18mo | $385,000 | $281 | 46 |
| 1281 Route 169 | 0.30mi | 3/1.0 (-1) | 1,243 (-14%) | 17mo | $175,000 | $141 | 42 |
Match score weights: distance 35% · size 25% · config 20% · recency 20%. Top-matched comps best support the ARV.
Projected returns pro-forma
-3.0% appreciation · 3.0% rent growth · sell at horizon
- IRR
- -13.4%
- Equity multiple
- 0.52×
- Total profit
- $-35,722
- Equity at exit
- $39,512
- IRR
- -4.5%
- Equity multiple
- 0.71×
- Total profit
- $-21,829
- Equity at exit
- $22,912
Cash invested: $74,200 (down + closing). Projections, not guarantees.
Landlord ↔ Tenant lean methodology
- Overall (STATE)
- 20 Strongly Tenant-Friendly
- State Massachusetts
- 20 Strongly Tenant-Friendly · D+15
- County
- — inherits STATE
- City
- — inherits STATE
ZIP-level market 06281
- Home prices YoY
- -14.7%
- Price-to-rent
- 9.3×
Monthly cashflow live
- Estimated rent
- $2,374 medium interval (Pro) →
- Mortgage (P&I)
- −$1,390
- Tax from tax record
- −$262 /mo · $3,144/yr
- Insurance
- −$110
- HOA
- −$0
- Lot rent
- −$0
- Vacancy / Maint / Mgmt
- −$499
- Net cashflow
- $113
Break-even live
Sensitivity live
| Price | -10% $263 | -5% $188 | +0% $113 | +5% $38 | +10% $-37 |
|---|---|---|---|---|---|
| Rent | -10% $-74 | -5% $20 | +0% $113 | +5% $207 | +10% $301 |
| Rate | -1.0pp $247 | -0.5pp $181 | base $113 | +0.5pp $45 | +1.0pp $-25 |
UW: 25.0% down · 7.5% · 30yr · 1.5% tax · 5.0% vac · 8.0% maint · 8.0% mgmt
Financing live
Cash to close
- Down payment
- $66,250
- Closing costs
- $7,950
- Reserves months
- —
- Total cash needed
- —
Loan-product check · same deal, 3 products live
Conventional
25% down · 7.5% · 30yr
- Down + closing
- —
- Monthly P&I
- —
- Monthly cashflow
- —
- DSCR
- —
- Eligible?
- —
Personal DTI + credit; lowest rate.
DSCR
20% down · 8.5% · 30yr
- Down + closing
- —
- Monthly P&I
- —
- Monthly cashflow
- —
- DSCR
- —
- Eligible?
- —
No personal income docs; deal must DSCR.
Hard money
10% down · 12.0% · 12mo
- Down + closing
- —
- Monthly P&I
- —
- Monthly cashflow
- —
- DSCR
- —
- Eligible?
- —
Short-term bridge; refi at stabilization.
Listing history 23 events
-
2026-02-19status Under Contract
-
2026-02-13$265,000 Active
-
2024-07-29historical
-
2024-07-12$305,000 Active
-
2018-02-13soldstatus $120,000 411-char remark
Show marketing remark (411 chars)
GREAT HOME WITH 3 BEDS, 1.5 BATHS!!! ATTACHED GARAGE ON WOODED LOT!! SPACIOUS WITH MANY UPDATES!! HUD Home. Sold “AS-IS” by elec. bid only. Prop available 11-14-17. ONLINE BIDDING PERIOD TO 23 NOV 2017 at 11:59 PM Central Time; then daily online bidding until sold. FHA Case #061-386491. FHA IN (Insurable). Eligible for FHA 203k. Financing terms: FHA, CASH, and CONVENTIONAL. LBP addendum attached.
-
2017-11-14$103,000 411-char remark
Show marketing remark (411 chars)
GREAT HOME WITH 3 BEDS, 1.5 BATHS!!! ATTACHED GARAGE ON WOODED LOT!! SPACIOUS WITH MANY UPDATES!! HUD Home. Sold “AS-IS” by elec. bid only. Prop available 11-14-17. ONLINE BIDDING PERIOD TO 23 NOV 2017 at 11:59 PM Central Time; then daily online bidding until sold. FHA Case #061-386491. FHA IN (Insurable). Eligible for FHA 203k. Financing terms: FHA, CASH, and CONVENTIONAL. LBP addendum attached.
-
2017-10-10$120,450
-
2017-10-10historical
-
2010-07-27soldstatus $166,000
-
2010-07-23soldstatus $166,000
-
2009-10-01$172,000
-
2009-07-24soldstatus $90,000
-
2009-01-13$84,900
-
2002-08-18historical
-
2002-02-18$149,000
-
2000-10-01soldstatus $57,000
-
2000-07-27historical
-
2000-02-28historical
-
2000-02-28historical
-
2000-02-08$80,000
-
1999-09-14$85,000
-
1999-09-09$85,000
-
1989-12-01soldstatus $100,000
ⓘ Source: listings_history table (triggers on properties + properties_extension) + one-shot
backfill from property_details.listing_events for pre-trigger history.
Tax reassessment forecast MA · Partial reset (capped growth)
- Current annual tax
- $3,144 · $262/mo
- Projected year-2 tax
- $3,202 · $267/mo
- Expected delta
- +$58/yr (+$5/mo · 1.8%)
ⓘ Screening estimate from a state-policy table — verify with the county assessor before closing.
Climate risk First Street
- Flood 1/10 Low FEMA zone X · 0% chance over 30 yrs
- Wildfire 2/10 Low
- Heat 3/10 Moderate 7 d/yr ≥95°F today · 15 d/yr by 30 yrs out
- Wind 6/10 Major 38% chance of damaging wind over 30 yrs
- Air quality 2/10 Low 2 unhealthy d/yr today · 2 by 30 yrs out
Nearby sold comps map
Loading sold comps map…
Walkable amenities ~0.75 mi
Loading nearby amenities…
Taxation est. · year 1
- Rental income
- $28,490
- − Mortgage interest
- −$14,844
- − Property taxes
- −$3,144
- − Insurance
- −$1,325
- − Repairs & maintenance
- −$2,279
- − Management
- −$2,279
- − Depreciation
- −$7,709
- Taxable loss
- −$3,091
- Est. tax savings @ 24.0%
- +$742
- After-tax cash flow
- $2,103/yr
For passive investors: Depreciation is non-cash, so a rental often shows a tax loss while cash-flowing — sheltering income. Rental losses are passive: they offset passive income freely, and up to $25,000/yr can offset ordinary (W-2) income if you actively participate and your MAGI is under $100k (phasing out to $0 by $150k); unused losses carry forward. On sale, claimed depreciation is recaptured at up to 25%, and gains may owe capital-gains tax (a 1031 exchange can defer both). Figures are a year-1 estimate at your 24.0% rate — not tax advice; consult a CPA.
Schools (NCES district)
- District
- Woodstock School District
- NCES district ID
- 0905370
- Math proficiency
- 32% ▼ -14.00%
- Reading proficiency
- 55% ▼ -6.00%
- Median HH income
- $77,483
- Composite
- 39.93/100
- National rank
- #3846
- State rank
- #89 of 153 in CT
Livability — Southbridge Town
- Score
- 56/100
- State rank
- #235
- US rank
- #22429
Category grades
Schools grade is shown separately in the Schools card above.
Census & demographics
- City population
- 17,806
- Population (ZIP)
- 7,417
Population outlook (Northeastern Connecticut County) Hauer SSP2
- By 2040
- 104,160
Race, ethnicity, and origin ACS 2023
- Neighborhood character
- Predominantly White (93%)
- Race & ethnicity
- White 93% Two or more races 6% Hispanic / Latino 5%
- Common ancestry
- Lithuanian 14% Romanian 6% Russian 3%
- Foreign-born
- 2% · Canada
- Languages at home
- 97% English-only · Spanish 3%
Political lean MEDSL · Northeastern Connecticut
- 2024 margin
- R (+15.4) · D 41.5% · R 57.0% · Other 1.5%
- All cycles
- 2024: R+15.4
Not yet ingested
- Civics
- —
Market trends
- HPI YoY
- ▼ -35.31%
- Current HPI
- 205.5225
- Rent YoY
- —
- Metro
- —
- State GDP YoY
- ▲ 2.28%
- F500 in state
- 38
Industry mix (Fortune 500 HQ in MA)
| Industry | F500 HQs | Revenue |
|---|---|---|
| Technology | 3 | $17B |
|
||
| Insurance | 2 | $84B |
|
||
| Retail | 2 | $76B |
|
||
| Life Sciences | 1 | $43B |
|
||
| Energy Technology | 1 | $31B |
|
||
| Aerospace / Defense | 1 | $18B |
|
||
Price history
+165.0% since first listed23 events — show timeline
- 2026-02-19 Pending — Smart MLS
- 2026-02-13 Listed $265,000 Smart MLS
- 2024-07-29 Listing Removed — Smart MLS
- 2024-07-12 Listed $305,000 Smart MLS
- 2018-02-13 Sold (MLS) $120,000 Smart MLS
- 2017-11-14 Listed $103,000 Smart MLS
- 2017-10-10 Listing Removed — Smart MLS
- 2017-10-10 Listed $120,450 Smart MLS
- 2010-07-27 Sold (Public Records) $166,000 Public Records
- 2010-07-23 Sold (MLS) $166,000 Smart MLS
- 2009-10-01 Listed $172,000 Smart MLS
- 2009-07-24 Sold (MLS) $90,000 Smart MLS
- 2009-01-13 Listed $84,900 Smart MLS
- 2002-08-18 Listing Removed — Smart MLS
- 2002-02-18 Listed $149,000 Smart MLS
- 2000-10-01 Sold (MLS) $57,000 MLS PIN
- 2000-07-27 Listing Removed — MLS PIN
- 2000-02-28 Listing Removed — Smart MLS
- 2000-02-28 Listing Removed — Smart MLS
- 2000-02-08 Listed $80,000 MLS PIN
- 1999-09-14 Listed $85,000 Smart MLS
- 1999-09-09 Listed $85,000 Smart MLS
- 1989-12-01 Sold (Public Records) $100,000 Public Records
Property tax history
+3.2%/yrLatest (2023): $3,144 · +7.5% YoY. Source: county tax records.
Cash-flow waterfall
monthlySold comps — $/sqft
last 12 mo · ≤1 miLoading sold comps…