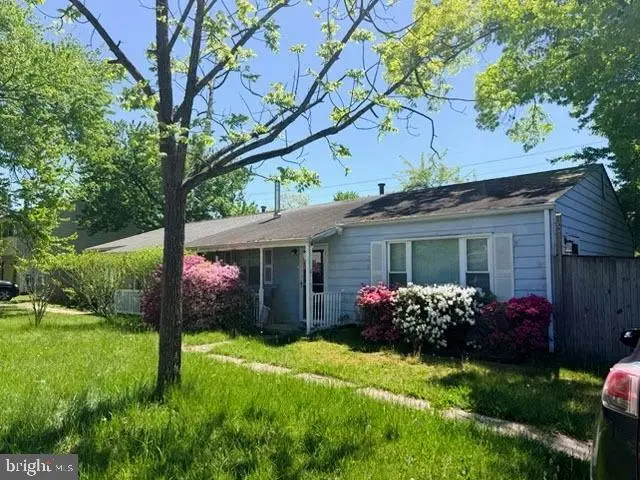
1073 Kings Rd · Pasadena, MD
Flood risk 1/10 · Minimal
- FEMA flood zone
- X (unshaded)
- Chance of flooding over 30 yrs
- 0.0%
- Est. flood insurance / yr
- $507 – $1,088
Fire risk 1/10 · Minimal
- Est. fire insurance / yr
- $755 – $1,403
Heat risk 8/10 · Major
- Hot days now (above 103°F)
- 7 days/yr
- Hot days in 30 yrs
- 15 days/yr
Wind risk 6/10 · Moderate
- Chance of severe wind over 30 yrs
- 59.0%
Air-quality risk 3/10 · Minor
- Unhealthy air days now
- 2 days/yr
- Unhealthy air days in 30 yrs
- 3 days/yr
Risk factors via First Street. Map © Google.
Why this score? — see what drove the B- grade
The composite is a weighted blend of 9 inputs, each scored 0–100. Each bar is that input's sub-score; the figure is the points it added to the 100-point composite (weight × sub-score).
- Cash flow +25.4/30.0
- ARV discount +15.0/15.0
- DSCR +8.4/10.0
- 1% rule +6.5/10.0
- Livability +3.8/5.0
- Schools +2.9/10.0
- Rent growth +2.7/5.0
- Condition / age +2.5/5.0
- Appreciation +0.0/10.0
$230,000
🖨 Deal sheet (PDF) 📄 Offer letter ✓ Due diligence
Listing remarks MLS
Cute and ready to go. .. .. . Sellers have installed new carpeting throughout. Spacious eat-in kitchen. Updated appliances, including brand new refrigerator. Front porch and fenced in back yard.
Key facts
- $11 HOA
- 4 parking spots
- Built 1973
Property features AI
Finance
- Other: Fee simple ownership; Not in a federal flood zone; Property listed condition: Below Average
- HOA & community: HOA fee $130 annually; HOA covers trash and common area maintenance; HOA amenities include common grounds
Exterior
- Parking: Driveway parking (4 spaces); Total of 4 garage/parking spaces
- Utilities: Public water; Public sewer; Municipal trash not provided
- Home design: Semi-detached property; Estimated year built, with major renovation in 2020; Building winterized
- Construction: Aluminum siding; Shingle roof; Slab foundation; Above-grade and below-grade structures
- Exterior features: Privacy fencing; Porch(es); Shed
Interior
- Bedrooms: 3 bedrooms on the main level
- Flooring: Carpet; Ceramic tile
- Bathrooms: 1 full bathroom on the main level
- Heating & cooling: Forced air heating; Natural gas heating fuel; Central air conditioning; Ceiling fans; Electric hot water
- Interior features: Level entry to main floor; No basement
- Laundry & utility: Laundry on the main floor
Neighborhood map
What this means for you Summary
Snapshot
- This is a 3-bed/1.0-bath townhouse listed at $230k.
Deal economics
- At list price, monthly cash flow is $526 ($6k/yr) — positive.
- The deal already cash-flows at list — no discount required.
- Meets the 1% rule at list price ($3k rent vs $230k).
- Recommended offer: $227k (1.5% below list) — sets the bar for market timing.
- Cap rate 9.0% vs local median 4.1% in Pasadena — top-decile yield for the area; either an underpriced asset or a hidden risk that comps aren't pricing in. Stress-test before assuming the spread holds.
Location & tenants
- Location reads 75/100 on livability (#100 in MD, #3,887 nationally) — a middle-class / working-renter tenant base. Strengths: employment A+, housing A+, commute A-; Watch: crime D+, amenities F, cost of living F.
- Anne Arundel County Public Schools (suburban): math 20% / reading 37% proficiency, ranked #10 of 24 in MD (top 42%) — low school quality limits family demand, transient renter base, plan for 1-2y turnover.
- Zoned schools: Northeast High (math 24% / reading 57%, grade F, #130 of 222 statewide, top 58%, 1,390 students, 44% FRL) — zoned schools average 44% FRL vs 25% district-wide (19 pts higher); higher-poverty schools than district average — tighter screening recommended.
- Zoned-school proficiency averages 40% at this address vs 28% district-wide (+12 pts) — the actual schools serving this property are materially stronger than the Anne Arundel County Public Schools average implies; a family-tenant draw the district grade alone would hide.
- Market conditions: Rents flat; 254 active listings in the ZIP; 9 comparable units currently listed for rent nearby; rentals leasing fast (median 12d on market — plan ~1-2 weeks tenant-placement turnaround); high-income renter base; 1,303 units permitted in Anne Arundel County in 2024 (299 in 5+ unit buildings).
Forward outlook
- Local home prices are declining (-3.0%/yr); year-one equity from $2k of loan paydown is wiped out by about $7k of value loss. Plan a longer hold.
- Anne Arundel County population projected at +17% by 2050 — long-run rental-demand tailwind backs the buy-and-hold thesis.
Negotiation context
- It's been on market 22 days — a 2% lower offer ($227k) is reasonable based on typical stale-listing flexibility.
- 6 sale attempts since 21y ago; this cycle's ask has dropped $65k (22%) from the opening price — seller is motivated, your offer sets the floor, not the list.
Risks & watch-outs
- Climate carrying-cost: major wind risk, 59% chance of damaging wind over 30y; extreme-heat days projected 7→15/yr by 2055 (HVAC capex compounding) — expect insurance premiums to compound above CPI over the hold.
Questions for the listing agent
- Built in 1973 — when were the roof, HVAC, electrical panel, plumbing, and water heater last replaced?
- What does the HOA fee cover, when was the last increase, and are there any pending special assessments or reserve-fund shortfalls?
- Is there a deadline driving the sale (1031 exchange, divorce, estate, relocation)? That informs how much negotiation room exists.
- Crime grade is D in this area — have there been break-ins, vandalism, or insurance claims at this property in the last 3 years? What carrier currently insures it and at what premium?
- What's the average days-on-market for RENTAL listings here right now (not sales)? A rising rental-DOM trend means longer vacancies and softer asking-rent achievability than the comps imply.
- What's the recent tenant-quality profile in this submarket — average credit score on applications, eviction rate, late-payment / NSF rate, and stable-employment percentage? A property-management company in the area should have these aggregated.
- How much new for-sale + rental construction is in the pipeline within 1–3 miles? Heavy new supply typically softens prices + rents 12–24 months out; constrained supply supports both.
Investment metrics
- 1% rule
- 1.15% ✓
- Cap rate
- 9.04%
- Cash-on-cash
- 9.80%
- DSCR
- 1.44
- GRM
- 7.2
CMA / ARV
- ARV (median comp)
- $328,629
- List price
- $230,000
- Delta
- -30.01%
- Verdict
- UNDERPRICED
- Comps
- 20 within 1.0 mi
Show comp detail 7 sales within ~0.75 mi
| Address | Dist | Beds/Ba | Sqft | Sold | Price | $/sf | Match |
|---|---|---|---|---|---|---|---|
| 7730 Notley Rd | 0.17mi | 3/1.0 | 1,020 (0%) | 5mo | $337,500 | $331 | 88 |
| 1091 Notley Ct | 0.19mi | 3/1.0 | 1,020 (0%) | 5mo | $305,000 | $299 | 87 |
| 1088 Notley Ct | 0.20mi | 3/1.0 | 1,020 (0%) | 11mo | $330,000 | $324 | 81 |
| 7728 Notley Rd | 0.16mi | 3/1.0 | 1,020 (0%) | 13mo | $350,000 | $343 | 81 |
| 7717 Notley Rd | 0.10mi | 3/1.0 | 1,020 (0%) | 20mo | $320,000 | $314 | 78 |
| 7747 Notley Rd | 0.31mi | 3/1.0 | 1,020 (0%) | 12mo | $315,000 | $309 | 75 |
| 1095 Woodlawn Ave | 0.33mi | 3/1.0 | 1,020 (0%) | 14mo | $330,000 | $324 | 73 |
Match score weights: distance 35% · size 25% · config 20% · recency 20%. Top-matched comps best support the ARV.
Projected returns pro-forma
-3.0% appreciation · 0.76% rent growth · sell at horizon
- IRR
- -4.1%
- Equity multiple
- 0.85×
- Total profit
- $-9,580
- Equity at exit
- $34,294
- IRR
- 2.9%
- Equity multiple
- 1.19×
- Total profit
- $12,000
- Equity at exit
- $19,886
Cash invested: $64,400 (down + closing). Projections, not guarantees.
Landlord ↔ Tenant lean methodology
- Overall (STATE)
- 27 Tenant-Leaning
- State Maryland
- 27 Tenant-Leaning · D+14
- County
- — inherits STATE
- City
- — inherits STATE
ZIP-level market 21122
- Rents YoY
- 0.8%
- Active inventory
- 254
- Price-to-rent
- 7.2×
Monthly cashflow live
- Estimated rent
- $2,648 high interval (Pro) →
- Mortgage (P&I)
- −$1,206
- Tax from tax record
- −$253 /mo · $3,032/yr
- Insurance
- −$96
- HOA
- −$11
- Vacancy / Maint / Mgmt
- −$556
- Net cashflow
- $526
Break-even live
Sensitivity live
| Price | -10% $656 | -5% $591 | +0% $526 | +5% $461 | +10% $396 |
|---|---|---|---|---|---|
| Rent | -10% $317 | -5% $421 | +0% $526 | +5% $631 | +10% $735 |
| Rate | -1.0pp $642 | -0.5pp $585 | base $526 | +0.5pp $466 | +1.0pp $406 |
UW: 25.0% down · 7.5% · 30yr · 1.5% tax · 5.0% vac · 8.0% maint · 8.0% mgmt
Financing live
Cash to close
- Down payment
- $57,500
- Closing costs
- $6,900
- Reserves months
- —
- Total cash needed
- —
Loan-product check · same deal, 3 products live
Conventional
25% down · 7.5% · 30yr
- Down + closing
- —
- Monthly P&I
- —
- Monthly cashflow
- —
- DSCR
- —
- Eligible?
- —
Personal DTI + credit; lowest rate.
DSCR
20% down · 8.5% · 30yr
- Down + closing
- —
- Monthly P&I
- —
- Monthly cashflow
- —
- DSCR
- —
- Eligible?
- —
No personal income docs; deal must DSCR.
Hard money
10% down · 12.0% · 12mo
- Down + closing
- —
- Monthly P&I
- —
- Monthly cashflow
- —
- DSCR
- —
- Eligible?
- —
Short-term bridge; refi at stabilization.
Rent comps 9 comps
| Address | Beds | Baths | Sqft | Rent | $/sqft | DOM | Units | Dist |
|---|---|---|---|---|---|---|---|---|
| 932 12th St Pasadena, MD | 3.0 | 2.5 | 1100 | $2,750 | $2.50 | 44d | 1 | 0.49mi |
| 959 Mount Desert Harbour Pasadena, MD | 3.0 | 1.5 | 1400 | $2,600 | $1.86 | 24d | 1 | 0.63mi |
| 765 202nd St Pasadena, MD | 3.0 | 1.0 | 1200 | $2,300 | $1.92 | 14d | 1 | 0.80mi |
| 7707 Warsaw Ave Glen Burnie, MD | 3.0 | 1.0 | 924 | $2,400 | $2.60 | 12d | 1 | 0.83mi |
| 3630 Saltwood Gln Pasadena, MD | 2.0 | 2.0 | 960 | $2,339 | $2.44 | 3d | 1 | 0.99mi |
| 7810 East Rd Pasadena, MD | 2.0 | 2.0 | 832 | $2,500 | $3.00 | 44d | 1 | 1.08mi |
| 8036 Abbey Ct Unit J Pasadena, MD | 2.0 | 1.0 | 924 | $1,850 | $2.00 | 12d | 1 | 1.22mi |
| 3581 Brickwall Ln Pasadena, MD | 3.0 | 1.0 | 1060 | $2,200 | $2.08 | 5d | 1 | 1.38mi |
| 212 Mulberry Ridge Ct Pasadena, MD | 3.0 | 3.5 | 1335 | $2,595 | $1.94 | 5d | 1 | 1.47mi |
HOA detail
- Monthly dues
- $11 · $132/yr
Listing history 19 events
-
2026-06-15pricestatusdays on market $230,000 Pending 22 DOM
-
2026-06-04status $275,000 Active Under Contract 21 DOM
-
2026-05-15price $275,000 995-char remark
-
2026-05-06$295,000 Active 995-char remark
-
2026-04-28price $295,000 995-char remark
-
2026-04-26historical $340,000 995-char remark
-
2019-05-03soldstatus $215,000 Closed 194-char remark
Show marketing remark (194 chars)
Cute and ready to go. .. .. . Sellers have installed new carpeting throughout. Spacious eat-in kitchen. Updated appliances, including brand new refrigerator. Front porch and fenced in back yard.
-
2019-03-29status Pending 194-char remark
Show marketing remark (194 chars)
Cute and ready to go. .. .. . Sellers have installed new carpeting throughout. Spacious eat-in kitchen. Updated appliances, including brand new refrigerator. Front porch and fenced in back yard.
-
2019-03-23$212,990 Active 194-char remark
Show marketing remark (194 chars)
Cute and ready to go. .. .. . Sellers have installed new carpeting throughout. Spacious eat-in kitchen. Updated appliances, including brand new refrigerator. Front porch and fenced in back yard.
-
2006-02-16soldstatus $217,500
-
2006-01-30soldstatus $217,500
Show marketing remark (343 chars)
Enjoy cozy times in your LR with your wood-stove FP during these chilly winter months. Very nice home with spacious eat-in kitchen. Nice-size lot, beautiful new doors, chair rails, freshly painted interior, updated bath, new light fixtures. Move-in condition and ready for your personal touches. Lockbox on side gate. Excellent price for AACO.
-
2006-01-13historical
Show marketing remark (343 chars)
Enjoy cozy times in your LR with your wood-stove FP during these chilly winter months. Very nice home with spacious eat-in kitchen. Nice-size lot, beautiful new doors, chair rails, freshly painted interior, updated bath, new light fixtures. Move-in condition and ready for your personal touches. Lockbox on side gate. Excellent price for AACO.
-
2005-09-14$217,500
Show marketing remark (343 chars)
Enjoy cozy times in your LR with your wood-stove FP during these chilly winter months. Very nice home with spacious eat-in kitchen. Nice-size lot, beautiful new doors, chair rails, freshly painted interior, updated bath, new light fixtures. Move-in condition and ready for your personal touches. Lockbox on side gate. Excellent price for AACO.
-
2005-03-09soldstatus $175,000
-
2005-02-25soldstatus $175,000
-
2005-02-01historical
-
2005-01-04$175,000
-
1988-12-14soldstatus $74,500
-
1986-01-23soldstatus $61,900
ⓘ Source: listings_history table (triggers on properties + properties_extension) + one-shot
backfill from property_details.listing_events for pre-trigger history.
Tax reassessment forecast MD · Partial reset (capped growth)
- Current annual tax
- $3,032 · $253/mo
- Projected year-2 tax
- $3,032 · $253/mo
- Expected delta
- $0/yr ($0/mo · 0.0%)
ⓘ Screening estimate from a state-policy table — verify with the county assessor before closing.
Climate risk First Street
- Flood 1/10 Low FEMA zone X (unshaded) · 0% chance over 30 yrs
- Wildfire 1/10 Low
- Heat 8/10 Severe 7 d/yr ≥103°F today · 15 d/yr by 30 yrs out
- Wind 6/10 Major 59% chance of damaging wind over 30 yrs
- Air quality 3/10 Moderate 2 unhealthy d/yr today · 3 by 30 yrs out
Nearby sold comps map
Loading sold comps map…
Walkable amenities ~0.75 mi
Loading nearby amenities…
Taxation est. · year 1
- Rental income
- $31,772
- − Mortgage interest
- −$12,884
- − Property taxes
- −$3,032
- − Insurance
- −$1,150
- − Repairs & maintenance
- −$2,542
- − Management
- −$2,542
- − HOA
- −$132
- − Depreciation
- −$6,691
- Taxable income
- $2,800
- Est. tax owed @ 24.0%
- −$672
- After-tax cash flow
- $5,640/yr
For passive investors: Depreciation is non-cash, so a rental often shows a tax loss while cash-flowing — sheltering income. Rental losses are passive: they offset passive income freely, and up to $25,000/yr can offset ordinary (W-2) income if you actively participate and your MAGI is under $100k (phasing out to $0 by $150k); unused losses carry forward. On sale, claimed depreciation is recaptured at up to 25%, and gains may owe capital-gains tax (a 1031 exchange can defer both). Figures are a year-1 estimate at your 24.0% rate — not tax advice; consult a CPA.
Schools (NCES district)
- District
- Anne Arundel County Public Schools
- NCES district ID
- 2400060
- Math proficiency
- 20% ▼ -21.00%
- Reading proficiency
- 37% ▼ -13.00%
- Median HH income
- $87,880
- Composite
- 28.52/100
- National rank
- #6733
- State rank
- #10 of 24 in MD
Livability — Pasadena
- Score
- 75/100
- State rank
- #100
- US rank
- #3887
Category grades
Schools grade is shown separately in the Schools card above.
Census & demographics
- Census place
- Pasadena, MD
- County
- Anne Arundel County · 535,653 people
- City population
- 61,566
- Metro
- Baltimore-Columbia-Towson, MD
- Population (ZIP)
- 61,566
- Household income
- $127,587
- Rent vs Own
- Severe rent burden
- 791.0
Population outlook (Anne Arundel County) Hauer SSP2
- Today (2025)
- 617,384 people
- By 2030
- 642,094 · +4.0%
- By 2040
- 686,621 · +11.2%
- By 2050
- 723,031 · +17.1%
- By 2075
- 809,346 · +31.1%
- By 2100
- 837,658 · +35.7%
Race, ethnicity, and origin ACS 2023
- Neighborhood character
- Predominantly White (80%)
- Race & ethnicity
- White 80% Two or more races 7% Black 7% Hispanic / Latino 5% Asian 2%
- Common ancestry
- Romanian 4% Lithuanian 2% Slovak 2%
- Foreign-born
- 4% · Canada, China
- Languages at home
- 93% English-only · Spanish 3% Other Indo-European 1% Chinese 0%
Political lean MEDSL · Anne Arundel
- 2024 margin
- D (+13.9) · D 55.7% · R 41.7% · Other 2.6%
- 2008→2024 swing
- +15.7pp toward D · 2008: -1.8pp · 2024: 13.9pp
- All cycles
- 2024: D+13.9 2020: D+14.5 2016: D+0.7 2012: R+0.9 2008: R+1.8
Not yet ingested
- Civics
- —
Market trends
- HPI YoY
- ▼ -401.00%
- Current HPI
- 283.1566
- Rent YoY
- ▲ 0.76%
- Metro
- Baltimore-Columbia-Towson, MD
- State GDP YoY
- ▲ 2.97%
- F500 in state
- 12
Industry mix (Fortune 500 HQ in MD)
| Industry | F500 HQs | Revenue |
|---|---|---|
| Aerospace / Defense | 1 | $71B |
|
||
| Utilities | 1 | $25B |
|
||
| Hotels | 1 | $24B |
|
||
| Consumer Goods | 1 | $7B |
|
||
| Real Estate | 1 | $6B |
|
||
| Chemicals | 1 | $2B |
|
||
Price history
+271.6% since first listed25 events — show timeline
- 2026-06-14 Pending — BRIGHT MLS
- 2026-06-13 Listing Removed — BRIGHT MLS
- 2026-06-13 Price Changed $230,000 BRIGHT MLS
- 2026-06-12 Price Changed $225,000 BRIGHT MLS
- 2026-06-12 Relisted — BRIGHT MLS
- 2026-06-11 Listing Removed — BRIGHT MLS
- 2026-06-03 Relisted — BRIGHT MLS
- 2026-05-26 Listing Removed — BRIGHT MLS
- 2026-05-15 Price Changed $275,000 BRIGHT MLS
- 2026-05-06 Listed $295,000 BRIGHT MLS
- 2026-04-28 Price Changed $295,000 BRIGHT MLS
- 2026-04-26 Coming Soon $340,000 BRIGHT MLS
- 2019-05-03 Sold (MLS) $215,000 BRIGHT MLS
- 2019-03-29 Pending — BRIGHT MLS
- 2019-03-23 Listed $212,990 BRIGHT MLS
- 2006-02-16 Sold (Public Records) $217,500 Public Records
- 2006-01-30 Sold (MLS) $217,500 MRIS
- 2006-01-13 Delisted — MRIS
- 2005-09-14 Listed $217,500 MRIS
- 2005-03-09 Sold (Public Records) $175,000 Public Records
- 2005-02-25 Sold (MLS) $175,000 MRIS
- 2005-02-01 Delisted — MRIS
- 2005-01-04 Listed $175,000 MRIS
- 1988-12-14 Sold (Public Records) $74,500 Public Records
- 1986-01-23 Sold (Public Records) $61,900 Public Records
Property tax history
+5.4%/yrLatest (2025): $3,032 · +7.2% YoY. Source: county tax records.
Cash-flow waterfall
monthlySold comps — $/sqft
last 12 mo · ≤1 miLoading sold comps…