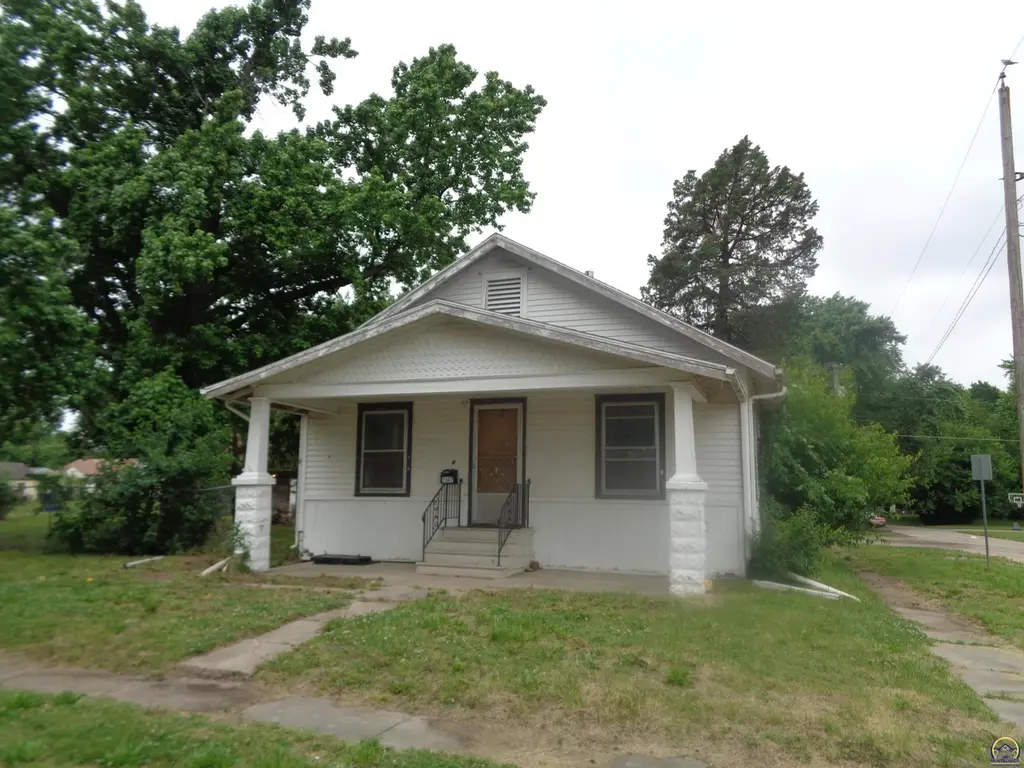
1347 NE Winfield Ave · Topeka, KS
Flood risk 1/10 · Minimal
- FEMA flood zone
- X
- Chance of flooding over 30 yrs
- 0.0%
- Est. flood insurance / yr
- $473 – $860
Fire risk 3/10 · Minor
- Est. fire insurance / yr
- $1,154 – $2,142
Heat risk 4/10 · Minor
- Hot days now (above 107°F)
- 7 days/yr
- Hot days in 30 yrs
- 17 days/yr
Wind risk 2/10 · Minimal
- Chance of severe wind over 30 yrs
- —
Air-quality risk 2/10 · Minimal
- Unhealthy air days now
- 1 days/yr
- Unhealthy air days in 30 yrs
- 2 days/yr
Risk factors via First Street. Map © Google.
Why this score? — see what drove the B- grade
The composite is a weighted blend of 9 inputs, each scored 0–100. Each bar is that input's sub-score; the figure is the points it added to the 100-point composite (weight × sub-score).
- Cash flow +30.0/30.0
- 1% rule +10.0/10.0
- DSCR +10.0/10.0
- ARV discount +7.5/15.0
- Livability +3.5/5.0
- Rent growth +2.5/5.0
- Condition / age +2.5/5.0
- Schools +1.7/10.0
- Appreciation +0.0/10.0
$99,500
🖨 Deal sheet 📄 Offer letter ✓ Due diligence
Listing remarks
Loads of potential in this Oakland bungalow. Spacious main floor with hardwood floors. Attached garage as well as an outbuilding for your projects. Large yard. Newer roof. Call to schedule your showing today.
Key facts
- Outbuilding
- Attached garage
- Newer roof
Tags
Property features AI
Finance
- Other: Located in Brigham & Rice subdivision
Exterior
- Parking: Detached 2-car garage
- Utilities: Public water; Public sewer
- Home design: Single-family residence; Residential property
- Construction: Frame construction; Above-grade finished area approximately 1,280; Unfinished block basement
- Exterior features: Corner lot
Interior
- Flooring: Hardwood
- Bathrooms: 1 full bathroom
- Heating & cooling: Central air conditioning
- Interior features: Gas water heater; Hardwood floors; Basement present (block, unfinished)
- Laundry & utility: Laundry in basement
Neighborhood map
What this means for you Summary
Snapshot
- This is a 3-bed/1.0-bath single-family listed at $100k.
Deal economics
- At list price, monthly cash flow is $479 ($6k/yr) — positive.
- The deal already cash-flows at list — no discount required.
- Meets the 1% rule at list price ($1k rent vs $100k).
- Recommended offer: $98k (1.5% below list) — sets the bar for market timing.
- Cap rate 12.1% vs local median 4.3% in Topeka — top-decile yield for the area; either an underpriced asset or a hidden risk that comps aren't pricing in. Stress-test before assuming the spread holds.
Location & tenants
- Location reads 69/100 on livability (#195 in KS) — a middle-class / working-renter tenant base. Strengths: cost of living A+, housing A+, health & safety A+; Watch: employment C-, crime F, commute F.
- Topeka Public Schools (urban): math 17% / reading 23% proficiency, ranked #158 of 169 in KS (top 94%) — low school quality limits family demand, transient renter base, plan for 1-2y turnover; 69% free/reduced lunch — lower-income household profile, screen leases tightly.
- Zoned schools: State Street Elem (math 23% / reading 21%, grade F, #569 of 684 statewide, top 85%, 456 students, 89% FRL); Chase Middle School (math 11% / reading 15%, grade F, #188 of 219 statewide, top 87%, 378 students, 93% FRL); Highland Park High (math 8% / reading 12%, grade F, #306 of 327 statewide, top 95%, 857 students, 85% FRL) — zoned schools average 89% FRL vs 69% district-wide (20 pts higher); higher-poverty schools than district average — tighter screening recommended.
- Market conditions: 27 active listings in the ZIP; 1 comparable units currently listed for rent nearby; 219 units permitted in Shawnee County in 2024 (25 in 5+ unit buildings).
Forward outlook
- Local home prices are declining (-3.0%/yr); year-one equity from $688 of loan paydown is wiped out by about $3k of value loss. Plan a longer hold.
- Shawnee County population projected to shrink 7% by 2050 — rents likely to lag national; underwrite the cash flow, not the appreciation.
- At projected returns (-3.0% appreciation + 3.0% rent growth), your $28k cash investment doubles in ~6 years — after that, you're playing with house money.
Negotiation context
- It's been on market 29 days — a 2% lower offer ($98k) is reasonable based on typical stale-listing flexibility.
- 2 sale attempts since 10y ago with the ask held roughly flat each time — persistent listings suggest the price (not the market) is what's stuck; bring a comps-based counter.
Risks & watch-outs
- Watch-outs: built in 1930 — expect roof / HVAC / electrical / plumbing capex.
Questions for the listing agent
- Built in 1930 — when were the roof, HVAC, electrical panel, plumbing, and water heater last replaced?
- Is there a deadline driving the sale (1031 exchange, divorce, estate, relocation)? That informs how much negotiation room exists.
- Schools are D-rated, which usually means shorter tenancies and higher turnover. Who's the typical renter profile here, and what's been the actual vacancy rate?
- Crime grade is F in this area — have there been break-ins, vandalism, or insurance claims at this property in the last 3 years? What carrier currently insures it and at what premium?
- What's the average days-on-market for RENTAL listings here right now (not sales)? A rising rental-DOM trend means longer vacancies and softer asking-rent achievability than the comps imply.
- What's the recent tenant-quality profile in this submarket — average credit score on applications, eviction rate, late-payment / NSF rate, and stable-employment percentage? A property-management company in the area should have these aggregated.
- How much new for-sale + rental construction is in the pipeline within 1–3 miles? Heavy new supply typically softens prices + rents 12–24 months out; constrained supply supports both.
Investment metrics
- 1% rule
- 1.50% ✓
- Cap rate
- 12.07%
- Cash-on-cash
- 20.62%
- DSCR
- 1.92
- GRM
- 5.5
CMA / ARV
No comps found within radius.
Projected returns pro-forma
-3.0% appreciation · 3.0% rent growth · sell at horizon
- IRR
- 13.0%
- Equity multiple
- 1.52×
- Total profit
- $14,392
- Equity at exit
- $14,836
- IRR
- 21.9%
- Equity multiple
- 2.86×
- Total profit
- $51,914
- Equity at exit
- $8,603
Cash invested: $27,860 (down + closing). Projections, not guarantees.
Landlord ↔ Tenant lean methodology
- Overall (STATE)
- 83 Strongly Landlord-Friendly
- State Kansas
- 83 Strongly Landlord-Friendly · R+10
- County
- — inherits STATE
- City
- — inherits STATE
ZIP-level market 66616
- Home prices YoY
- -7.1%
- Active inventory
- 27
- Price-to-rent
- 5.5×
Monthly cashflow live
- Estimated rent
- $1,495 medium interval (Pro) →
- Mortgage (P&I)
- −$522
- Tax from tax record
- −$139 /mo · $1,670/yr
- Insurance
- −$41
- HOA
- −$0
- Vacancy / Maint / Mgmt
- −$314
- Net cashflow
- $479
Break-even live
UW: 25.0% down · 7.5% · 30yr · 1.5% tax · 5.0% vac · 8.0% maint · 8.0% mgmt
Financing live
Cash to close
- Down payment
- $24,875
- Closing costs
- $2,985
- Reserves months
- —
- Total cash needed
- —
Loan-product check · same deal, 3 products live
Conventional
25% down · 7.5% · 30yr
- Down + closing
- —
- Monthly P&I
- —
- Monthly cashflow
- —
- DSCR
- —
- Eligible?
- —
Personal DTI + credit; lowest rate.
DSCR
20% down · 8.5% · 30yr
- Down + closing
- —
- Monthly P&I
- —
- Monthly cashflow
- —
- DSCR
- —
- Eligible?
- —
No personal income docs; deal must DSCR.
Hard money
10% down · 12.0% · 12mo
- Down + closing
- —
- Monthly P&I
- —
- Monthly cashflow
- —
- DSCR
- —
- Eligible?
- —
Short-term bridge; refi at stabilization.
Rent comps 1 comps
| Address | Beds | Baths | Sqft | Rent | $/sqft | DOM | Units | Dist |
|---|---|---|---|---|---|---|---|---|
| 724 NE Wabash Ave Topeka, KS | 4.0 | 2.0 | 1771 | $1,495 | $0.84 | 21d | 1 | 0.85mi |
Listing history 18 events
-
2026-06-19days on market $99,500 Active 29 DOM
-
2026-06-18days on market $99,500 Active 28 DOM
-
2026-06-17days on market $99,500 Active 27 DOM
-
2026-06-16days on market $99,500 Active 26 DOM
-
2026-06-15days on market $99,500 Active 25 DOM
-
2026-06-14days on market $99,500 Active 23 DOM
-
2026-06-13days on market $99,500 Active 22 DOM
-
2026-06-10days on market $99,500 Active 20 DOM
-
2026-06-09days on market $99,500 Active 19 DOM
-
2026-06-08days on market $99,500 Active 18 DOM
-
2026-06-07days on market $99,500 Active 17 DOM
-
2026-06-02days on market $99,500 Active 12 DOM
-
2026-06-01days on market $99,500 Active 11 DOM
-
2026-05-31days on market $99,500 Active 10 DOM
-
2026-05-30days on market $99,500 Active 9 DOM
-
2026-05-20$99,500 Active
-
2016-10-31$69,900
-
2007-06-19soldstatus
ⓘ Source: listings_history table (triggers on properties + properties_extension) + one-shot
backfill from property_details.listing_events for pre-trigger history.
Tax reassessment forecast KS · Resets to sale price
- Current annual tax
- $1,670 · $139/mo
- Projected year-2 tax
- $1,670 · $139/mo
- Expected delta
- $0/yr ($0/mo · 0.0%)
ⓘ Screening estimate from a state-policy table — verify with the county assessor before closing.
Climate risk First Street
- Flood 1/10 Low FEMA zone X · 0% chance over 30 yrs
- Wildfire 3/10 Moderate
- Heat 4/10 Moderate 7 d/yr ≥107°F today · 17 d/yr by 30 yrs out
- Wind 2/10 Low
- Air quality 2/10 Low 1 unhealthy d/yr today · 2 by 30 yrs out
Nearby sold comps map
Loading sold comps map…
Walkable amenities ~0.75 mi
Loading nearby amenities…
Taxation est. · year 1
- Rental income
- $17,940
- − Mortgage interest
- −$5,574
- − Property taxes
- −$1,670
- − Insurance
- −$498
- − Repairs & maintenance
- −$1,435
- − Management
- −$1,435
- − Depreciation
- −$2,895
- Taxable income
- $4,434
- Est. tax owed @ 24.0%
- −$1,064
- After-tax cash flow
- $4,679/yr
For passive investors: Depreciation is non-cash, so a rental often shows a tax loss while cash-flowing — sheltering income. Rental losses are passive: they offset passive income freely, and up to $25,000/yr can offset ordinary (W-2) income if you actively participate and your MAGI is under $100k (phasing out to $0 by $150k); unused losses carry forward. On sale, claimed depreciation is recaptured at up to 25%, and gains may owe capital-gains tax (a 1031 exchange can defer both). Figures are a year-1 estimate at your 24.0% rate — not tax advice; consult a CPA.
Schools (NCES district)
- District
- Topeka Public Schools
- NCES district ID
- 2012260
- Math proficiency
- 17% ▼ -8.00%
- Reading proficiency
- 23% ▼ -2.00%
- Median HH income
- $37,405
- Composite
- 16.69/100
- National rank
- #9167
- State rank
- #158 of 169 in KS
Livability — Topeka
- Score
- 69/100
- State rank
- #195
- US rank
- #8848
Category grades
Schools grade is shown separately in the Schools card above.
Census & demographics
- Census place
- Topeka, KS
- City population
- 118,130
- Population (ZIP)
- 6,065
Population outlook (Shawnee County) Hauer SSP2
- Today (2025)
- 179,277 people
- By 2030
- 177,762 · -0.8%
- By 2040
- 172,341 · -3.9%
- By 2050
- 166,330 · -7.2%
- By 2075
- 152,417 · -15.0%
- By 2100
- 134,782 · -24.8%
Race, ethnicity, and origin ACS 2023
- Neighborhood character
- Diverse neighborhood (Simpson 0.59)
- Race & ethnicity
- White 55% Hispanic / Latino 32% Two or more races 15% Black 6% Native American 3%
- Hispanic origin (detail)
- Mexican 31% Puerto Rican 2%
- Common ancestry
- Slovak 3% Italian 1% Iranian 1%
- Foreign-born
- 2% · Canada
- Languages at home
- 93% English-only · Spanish 7%
Political lean MEDSL · Shawnee
- 2024 margin
- Toss-up / Even · D 49.3% · R 48.8% · Other 2.0%
- 2008→2024 swing
- +0.8pp no change · 2008: -0.3pp · 2024: 0.5pp
- All cycles
- 2024: D+0.5 2020: D+3.0 2016: R+2.8 2012: R+1.7 2008: R+0.3
Not yet ingested
- Civics
- —
Market trends
- HPI YoY
- ▼ -16.11%
- Current HPI
- 211.4386
- Rent YoY
- —
- Metro
- —
- State GDP YoY
- —
- F500 in state
- 0
Price history
+42.3% since first listed3 events — show timeline
- 2026-05-20 Listed $99,500 Sunflower MLS as distributed by MLS GRID
- 2016-10-31 Listed $69,900 Sunflower MLS as distributed by MLS GRID
- 2007-06-19 Sold (Public Records) — Public Records
Property tax history
+3.7%/yrLatest (2025): $1,670 · +5.0% YoY. Source: county tax records.
Cash-flow waterfall
monthlySold comps — $/sqft
last 12 mo · ≤1 miLoading sold comps…